Sabirnetug (Siemers 2025)
Source:vignettes/articles/Siemers_2025_sabirnetug.Rmd
Siemers_2025_sabirnetug.RmdModel and source
- Citation: Siemers E, Feaster T, Sethuraman G, Sundell K, Skljarevski V, Cline EN, Zhang H, Jerecic J, Honig LS, Salloway S, Sperling R, Trame MN, Dodds MG, Johnson K. INTERCEPT-AD, a phase 1 study of intravenous sabirnetug in participants with mild cognitive impairment or mild dementia due to Alzheimer’s disease. J Prev Alzheimers Dis. 2025;12:100005. doi:10.1016/j.tjpad.2024.100005.
- Article: https://doi.org/10.1016/j.tjpad.2024.100005
- Supplement: Elsevier
mmc1.docx(cognitive-assessment tables only; contains no model equations or parameter values)
Sabirnetug (ACU193) is a humanized, affinity-matured IgG2 monoclonal antibody raised against globular soluble amyloid-beta oligomers (AbetaOs), with at least 650-fold greater binding affinity for AbetaOs than for amyloid-beta monomers and limited binding to amyloid plaque. INTERCEPT-AD (NCT04931459) was its first-in-human phase 1 study in participants with early symptomatic Alzheimer’s disease.
This paper contributes one model: the direct Emax exposure-response relationship between the cerebrospinal-fluid (CSF) sabirnetug concentration and central target engagement, where target engagement is the CSF sabirnetug-AbetaO complex concentration measured by an ultrasensitive anti-idiotype-capture / AbetaO-detection immunoassay and reported in arbitrary units per mL (AU/mL).
cat(rxode2::rxode(readModelDb("Siemers_2025_sabirnetug"))$description)
#> Direct Emax exposure-response model of central target engagement for sabirnetug (ACU193), a humanized IgG2 monoclonal antibody selective for soluble globular amyloid-beta oligomers (AbetaOs), in participants with mild cognitive impairment or mild dementia due to Alzheimer's disease (INTERCEPT-AD phase 1, NCT04931459). Target engagement is the cerebrospinal-fluid sabirnetug-AbetaO complex concentration measured by an anti-idiotype capture / AbetaO detection immunoassay and reported in arbitrary units per mL; it is driven by the CSF sabirnetug concentration supplied as the covariate CEFFECT. PD-only model: Siemers 2025 characterised sabirnetug serum PK non-compartmentally (Table 3) and never fitted a compartmental population PK model, so no sabirnetug PK model is packaged here and users must supply their own CSF concentration trajectory. The companion population-modelling analysis is deferred to a separate publication (Trame 2023 conference abstract, reference [30] of the paper).
Why there is no packaged sabirnetug PK model
Siemers 2025 characterised sabirnetug serum pharmacokinetics non-compartmentally only. Section 2.8 enumerates the reported PK parameters as AUC to the last measurable concentration, Cmax, Tmax, AUC to infinity, terminal half-life, clearance, apparent terminal volume of distribution, and accumulation ratios; Table 3 tabulates per-cohort means and standard deviations of exactly those quantities. There is no compartmental structural model, no random-effects structure, no residual-error model and no covariate model anywhere in the paper or its supplement, and the Discussion states that “additional modeling analyses will be reported separately”.
Reconstructing a compartmental PK model from the Table 3 NCA
summaries would be inventing structure the authors did not fit. The
paper’s own caution makes the point concretely: it reports that terminal
half-life and Vz “appeared to increase with increasing dose” (76.8 h at
2 mg/kg rising to 391.4 h at 60 mg/kg) and attributes this to
assay-floor truncation of the terminal slope at low doses rather than to
real nonlinearity, so those NCA values are not a defensible basis for a
disposition model. The model file therefore carries the PD layer only,
and the user supplies the CSF concentration trajectory. This follows the
registry precedent of Warren_2025_orismilast and
Crass_2025_pegcetacoplan_ga_exposureresponse.
Population
The pharmacokinetic population is the 48 participants who received sabirnetug across the seven INTERCEPT-AD cohorts; Fig. 3, which this model reproduces, is plotted against that population. Participants were 55-90 years old (mean 72.3, SD 7.9 years among sabirnetug recipients), 55.1% women, 93.9% White / 4.1% Black / 2.0% Native American or Alaskan, with 16.3% reporting Hispanic ethnicity (Table 1). All had mild cognitive impairment or mild dementia due to Alzheimer’s disease by National Institute on Aging - Alzheimer’s Association criteria, a Global Clinical Dementia Rating of 0.5 or 1.0, an MMSE of 18-30 (mean 24.1, SD 3.7) and a positive amyloid PET scan (composite SUVr > 1.2). Protocol eligibility required a screening weight of 41-113 kg; individual weights are not reported. APOE e4 carriers were 36.6% heterozygous and 12.5% homozygous. The study ran at 15 United States centres from 23 June 2021 to 12 June 2023.
Part A gave single IV infusions of 2, 10, 25 or 60 mg/kg; Part B gave three infusions of 10 or 60 mg/kg every four weeks, or 25 mg/kg every two weeks.
CSF was sampled by lumbar puncture at baseline and at a single post-dose visit per cohort – day 21 for Part A, and days 70, 63 and 35 for Part B cohorts 5, 6 and 7 respectively (Section 2.8). Each participant therefore contributes essentially one post-dose target-engagement observation, and the exposure-response is fitted across participants rather than over a within-participant time course. That is why the model is a static concentration-effect relationship with no time dependence.
The same information is available programmatically via
readModelDb("Siemers_2025_sabirnetug")()$population.
Source trace
| Equation / parameter | Value | Source location |
|---|---|---|
targetEngagement = emax * CEFFECT / (CEFFECT + ec50) |
n/a | Siemers 2025 Section 2.9, “an Emax model (E = Emax * C/(C + EC50), where E = target engagement, C = sabirnetug concentration in CSF, Emax = maximum target engagement, and EC50 = sabirnetug CSF concentration eliciting half maximal target engagement)” |
lemax |
log(22.71) AU/mL |
Siemers 2025 Fig. 3, annotation printed inside the plot panel (“Emax = 22.71 AU/mL Complex”); independently corroborated by the Section 3.8 body text (“Emax = 22.71 AU/mL sabirnetug-AbetaO complex”) |
lec50 |
log(136) ng/mL |
Siemers 2025 Fig. 3, annotation printed inside the plot panel (“EC50 = 136 ng/mL ACU193”). This value appears only in the figure panel – not in the figure caption, not in Table 3, and not in the body text |
CEFFECT (driver) |
covariate, ng/mL | Siemers 2025 Fig. 3 x-axis (“CSF [Sabirnetug] (ng/mL)”);
C in the Section 2.9 equation |
| Hill coefficient | absent (implicitly 1) | Siemers 2025 Section 2.9 prints the plain hyperbolic form with no exponent; independently confirmed numerically in the “Hill exponent” gate below |
| Per-cohort observed CSF concentrations | medians and ranges | Siemers 2025 Section 3.6 |
| ALTITUDE-AD dose-selection target engagement | 85.1 / 71.1 / 89.1 / 77.9 % of Emax | Siemers 2025 Discussion |
A note on where EC50 lives. Both
parameter values are printed numbers, not digitised ones – but
EC50 is printed as an annotation inside the Fig. 3 plot
panel rather than in a table or in prose. Any text-only extraction of
this paper (including its PubMed Central markdown rendering, where Fig.
3 collapses to an image placeholder) will conclude that
EC50 is unreported and that the Emax model cannot be
reconstructed. It can: the value was read directly from the publisher’s
figure file at native resolution.
Validation
The model is deterministic and has no between-participant variability and no residual error (see Assumptions and deviations), so there is no random draw anywhere in this vignette and no seed is set. Every check below is exactly reproducible.
mod <- rxode2::rxode(readModelDb("Siemers_2025_sabirnetug"))

emax_pub <- 22.71  # AU/mL, Siemers 2025 Fig. 3
ec50_pub <- 136    # ng/mL, Siemers 2025 Fig. 3
Gate 1: the solved model equals the published closed form
Both sides use the same parameter values, so the only difference is numerical round-off and a tight bound is the correct assertion here.
grid <- data.frame(
  id      = 1L,
  time    = seq_along(c(0, 10^seq(0, log10(1800), length.out = 60))) - 1,
  evid    = 0L,
  CEFFECT = c(0, 10^seq(0, log10(1800), length.out = 60))
)

sim <- rxode2::rxSolve(mod, grid, returnType = "data.frame")
sim$closed_form <- emax_pub * sim$CEFFECT / (sim$CEFFECT + ec50_pub)

max_abs_err <- max(abs(sim$targetEngagement - sim$closed_form))
max_abs_err
#> [1] 5.329071e-15

stopifnot(max_abs_err < 1e-10)
Gate 2: EC50 is the half-maximal concentration, by construction
At CEFFECT = EC50 the model must return exactly half of
Emax. This is a dimensional / definitional check on the
encoded equation: it fails if the denominator, the parameterisation, or
the back-transform from log() is wrong.
half <- rxode2::rxSolve(
  mod,
  data.frame(id = 1L, time = 0, evid = 0L, CEFFECT = ec50_pub),
  returnType = "data.frame"
)

c(predicted = half$targetEngagement, expected = emax_pub / 2)
#> predicted  expected
#>    11.355    11.355

stopifnot(abs(half$targetEngagement - emax_pub / 2) < 1e-10)
Gate 3: reproduce Figure 3
Siemers 2025 Fig. 3 plots the observed sabirnetug-AbetaO complex concentration against the observed CSF sabirnetug concentration for the pharmacokinetics population, with the fitted Emax curve overlaid and the two parameter values annotated. The curve below is the packaged model solved over the published x-axis range; the points mark each cohort’s published median CSF concentration (Section 3.6) mapped through the model.
cohorts <- tibble::tibble(
  cohort  = paste0("Cohort ", 1:7),
  regimen = c(
    "SAD 2 mg/kg", "SAD 10 mg/kg", "SAD 25 mg/kg", "SAD 60 mg/kg",
    "MAD 10 mg/kg Q4W", "MAD 60 mg/kg Q4W", "MAD 25 mg/kg Q2W"
  ),
  # Siemers 2025 Section 3.6: median (range) CSF sabirnetug, ng/mL
  csf_median = c(15.7, 98.0, 169.5, 282.7, 148.9, 1161.6, 869.8),
  csf_min    = c( 6.7, 36.8,  65.0,  26.1,   5.2,   48.1,  419.0),
  csf_max    = c(29.2, 130.7, 334.7, 455.9, 255.9, 1722.2, 1474.1)
)

# Solve the model at the median, min and max CSF concentration of every cohort.
cohort_long <- cohorts |>
  tidyr::pivot_longer(
    cols      = c(csf_median, csf_min, csf_max),
    names_to  = "stat",
    values_to = "CEFFECT"
  ) |>
  dplyr::mutate(id = dplyr::row_number(), time = 0, evid = 0L)

cohort_pred <- rxode2::rxSolve(
  mod,
  as.data.frame(cohort_long[, c("id", "time", "evid", "CEFFECT")]),
  returnType = "data.frame"
) |>
  dplyr::left_join(cohort_long[, c("id", "cohort", "regimen", "stat")], by = "id") |>
  dplyr::mutate(pct_emax = 100 * targetEngagement / emax_pub)
med <- dplyr::filter(cohort_pred, stat == "csf_median")
rng <- cohort_pred |>
  dplyr::filter(stat != "csf_median") |>
  dplyr::select(cohort, stat, CEFFECT) |>
  tidyr::pivot_wider(names_from = stat, values_from = CEFFECT) |>
  dplyr::left_join(med[, c("cohort", "targetEngagement")], by = "cohort")

ggplot2::ggplot() +
  ggplot2::geom_line(
    data = sim, ggplot2::aes(x = CEFFECT, y = targetEngagement), linewidth = 0.7
  ) +
  ggplot2::geom_hline(yintercept = emax_pub, linetype = "dashed", colour = "grey50") +
  ggplot2::geom_errorbarh(
    data = rng,
    ggplot2::aes(y = targetEngagement, xmin = csf_min, xmax = csf_max),
    height = 0.4, colour = "grey40"
  ) +
  ggplot2::geom_point(
    data = med, ggplot2::aes(x = CEFFECT, y = targetEngagement, colour = regimen),
    size = 3
  ) +
  ggplot2::annotate(
    "text", x = 950, y = 6, hjust = 0,
    label = sprintf("Emax = %.2f AU/mL\nEC50 = %g ng/mL", emax_pub, ec50_pub)
  ) +
  ggplot2::scale_x_continuous(limits = c(0, 1800)) +
  ggplot2::scale_y_continuous(limits = c(0, 30)) +
  ggplot2::labs(
    x = "CSF [Sabirnetug] (ng/mL)",
    y = "Sabirnetug-AbetaO Complex (AU/mL)",
    colour = NULL
  ) +
  ggplot2::theme_bw()
#> Warning: `geom_errorbarh()` was deprecated in ggplot2 4.0.0.
#> ℹ Please use the `orientation` argument of `geom_errorbar()` instead.
#> This warning is displayed once per session.
#> Call `lifecycle::last_lifecycle_warnings()` to see where this warning was
#> generated.
#> `height` was translated to `width`.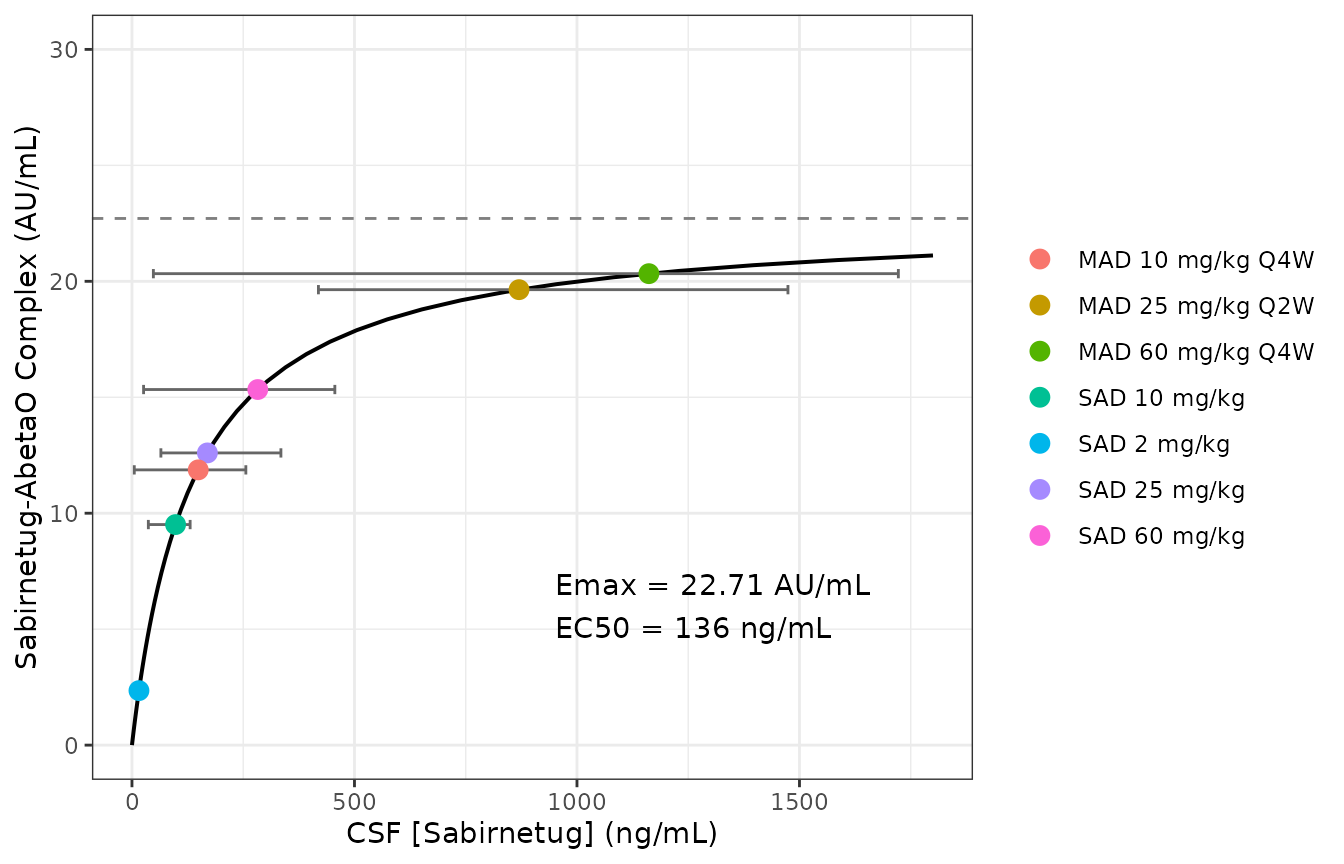
Replicates Figure 3 of Siemers 2025: fitted Emax exposure-response between CSF sabirnetug concentration and CSF sabirnetug-AbetaO complex. Points are each cohort’s published median CSF concentration; horizontal bars span the published within-cohort range.
The published Fig. 3 y-axis runs to 30 AU/mL with the fitted curve approaching roughly 21-22 AU/mL at the right-hand edge of the x-axis; the reproduction above reaches 21.1 AU/mL at 1800 ng/mL, consistent with the published curve.
Gate 4: the cohort ordering reproduces the paper’s stated conclusion
Section 3.8 states that “target engagement approached maximal response in cohorts 6 (60 mg/kg Q4W) and 7 (25 mg/kg Q2W)” and that “the concentrations of sabirnetug administered in these cohorts approached saturation of AbetaO binding in the CSF of these participants”. Evaluated at each cohort’s published median CSF concentration, the packaged model must separate cohorts 6 and 7 from all the others.
med_tbl <- med |>
  dplyr::select(cohort, regimen, `CSF (ng/mL)` = CEFFECT,
                `Complex (AU/mL)` = targetEngagement, `% of Emax` = pct_emax) |>
  dplyr::mutate(dplyr::across(where(is.numeric), \(x) round(x, 1)))

knitr::kable(med_tbl)| cohort | regimen | CSF (ng/mL) | Complex (AU/mL) | % of Emax |
|---|---|---|---|---|
| Cohort 1 | SAD 2 mg/kg | 15.7 | 2.4 | 10.3 |
| Cohort 2 | SAD 10 mg/kg | 98.0 | 9.5 | 41.9 |
| Cohort 3 | SAD 25 mg/kg | 169.5 | 12.6 | 55.5 |
| Cohort 4 | SAD 60 mg/kg | 282.7 | 15.3 | 67.5 |
| Cohort 5 | MAD 10 mg/kg Q4W | 148.9 | 11.9 | 52.3 |
| Cohort 6 | MAD 60 mg/kg Q4W | 1161.6 | 20.3 | 89.5 |
| Cohort 7 | MAD 25 mg/kg Q2W | 869.8 | 19.6 | 86.5 |
saturating <- dplyr::filter(med, cohort %in% c("Cohort 6", "Cohort 7"))$pct_emax
others     <- dplyr::filter(med, !cohort %in% c("Cohort 6", "Cohort 7"))$pct_emax

stopifnot(
  # Cohorts 6 and 7 approach saturation ...
  all(saturating > 85),
  # ... and every other cohort is materially below it.
  all(others < 70),
  # Within the single-ascending-dose arm, target engagement rises monotonically
  # with dose (cohorts 1-4 = 2, 10, 25, 60 mg/kg).
  !is.unsorted(dplyr::filter(med, cohort %in% paste0("Cohort ", 1:4))$pct_emax)
)
Gate 5: the ALTITUDE-AD dose-selection anchors pin the Hill exponent at 1
This is the strongest independent check available, because it uses four published numbers that were not used to build the model file.
The Discussion reports the companion modelling analysis’s predictions for the phase 2 dose selection: at 35 mg/kg Q4W, “85.1% of maximum target engagement would occur at peak sabirnetug concentration and 71.1% … at trough”; at 50 mg/kg Q4W, “peak and trough target engagement would be 89.1% and 77.9% of maximum”.
Invert each percentage through the encoded model to the CSF
concentration that produces it. Because Siemers 2025 reports sabirnetug
exposure to be dose proportional in both serum and CSF (Abstract and
Section 3.5), the implied peak concentrations at 35 and 50 mg/kg must
sit in the ratio 50/35, and likewise for the troughs. Under a
sigmoidal Emax form with Hill exponent h
the inverse is C = EC50 * (f/(1-f))^(1/h), so solving for
the h that makes the implied concentration ratio equal the
dose ratio recovers the paper’s Hill exponent from its own reported
numbers.
anchors <- tibble::tibble(
  measure = c("peak", "trough"),
  f35     = c(0.851, 0.711),   # fraction of Emax at 35 mg/kg Q4W
  f50     = c(0.891, 0.779)    # fraction of Emax at 50 mg/kg Q4W
) |>
  dplyr::mutate(
    odds35        = f35 / (1 - f35),
    odds50        = f50 / (1 - f50),
    dose_ratio    = 50 / 35,
    # Hill exponent implied by requiring dose-proportional CSF concentrations
    hill_implied  = log(odds50 / odds35) / log(dose_ratio),
    # Implied CSF concentrations under the encoded model (h = 1)
    csf35         = ec50_pub * odds35,
    csf50         = ec50_pub * odds50,
    conc_ratio    = csf50 / csf35,
    ratio_pct_dev = 100 * abs(conc_ratio - dose_ratio) / dose_ratio
  )

knitr::kable(
  anchors |>
    dplyr::select(measure, hill_implied, `CSF 35 mg/kg` = csf35,
                  `CSF 50 mg/kg` = csf50, conc_ratio, dose_ratio, ratio_pct_dev) |>
    dplyr::mutate(dplyr::across(where(is.numeric), \(x) round(x, 3)))
)| measure | hill_implied | CSF 35 mg/kg | CSF 50 mg/kg | conc_ratio | dose_ratio | ratio_pct_dev |
|---|---|---|---|---|---|---|
| peak | 1.005 | 776.752 | 1111.706 | 1.431 | 1.429 | 0.186 |
| trough | 1.008 | 334.588 | 479.385 | 1.433 | 1.429 | 0.293 |
The percentages are printed to one decimal place. Propagating that
rounding through f/(1-f) gives an envelope of roughly 0.65%
on the peak concentration ratio and 0.38% on the trough ratio, so a 1%
tolerance is the honest gate:
stopifnot(
  # The plain hyperbolic form (no Hill exponent) is what the paper fitted.
  all(abs(anchors$hill_implied - 1) < 0.02),
  # The four published percentages invert to dose-proportional CSF concentrations.
  all(anchors$ratio_pct_dev < 1.0)
)

sprintf("Hill exponent implied by the published anchors: %.3f (peak), %.3f (trough)",
        anchors$hill_implied[1], anchors$hill_implied[2])
#> [1] "Hill exponent implied by the published anchors: 1.005 (peak), 1.008 (trough)"
sprintf("Concentration-ratio deviation: %.2f%% and %.2f%% of a 1.00%% tolerance",
        anchors$ratio_pct_dev[1], anchors$ratio_pct_dev[2])
#> [1] "Concentration-ratio deviation: 0.19% and 0.29% of a 1.00% tolerance"
The implied Hill exponents are within 1% of 1, independently
confirming that Section 2.9’s plain hyperbolic C/(C + EC50)
– and not a sigmoidal variant – is the form the authors fitted. Note
that this gate is invariant to the magnitude of
EC50, which cancels out of the ratio: it validates
the functional form and the internal consistency of the published
percentages, not the EC50 value itself. EC50’s
magnitude is validated by Gates 2-4 and the Fig. 3 reproduction.
For orientation, the CSF concentrations that the four anchors imply (335-1112 ng/mL) sit between the observed cohort 7 range floor and the cohort 6 median, which is consistent with the phase 2 doses of 35 and 50 mg/kg Q4W falling between the 25 mg/kg Q2W and 60 mg/kg Q4W regimens studied here.
No NCA comparison
There is no PKNCA section in this vignette, and that is deliberate rather than an omission. NCA requires a concentration-time profile, and this model has neither a PK layer nor any time dependence: it is a static concentration-effect relationship fitted across participants from one CSF sample each. The paper’s own NCA results (Table 3) describe serum sabirnetug, which this model does not predict and which no packaged model reproduces. The dimensional, definitional, figure-replication and published-anchor gates above are the validation appropriate to this model class.
Assumptions and deviations
-
EC50is sourced from the Fig. 3 plot-panel annotation. It is a printed value read from the publisher’s figure file at native resolution, not a digitised one – no curve-fitting or pixel measurement was involved. It is nonetheless worth flagging, because the value appears nowhere in the paper’s prose, tables or figure caption, so a text-only reading of this paper concludes it is unreported.Emaxis printed in both the figure panel and the Section 3.8 body text, and the two agree exactly, which corroborates that the panel annotation carries the fitted model’s parameters. -
No PK layer is packaged. Siemers 2025 reports
non-compartmental serum PK only (Table 3) and defers the population
modelling to a companion analysis (Trame M. Determination of target
engagement at various doses of ACU193 in INTERCEPT-AD. J Prev
Alzheimers Dis 2023;10(S1):S13 – a conference abstract, reference [30]
of the paper). Users must supply their own
CEFFECTtrajectory. No compartmental model was reconstructed from the Table 3 NCA summaries; see “Why there is no packaged sabirnetug PK model” above. -
Typical-value only: no IIV and no residual error.
Siemers 2025 reports no between-participant variability, no
residual-error magnitude and no uncertainty (SE, RSE, CI) for either
EmaxorEC50, and reports no basic-model variant from which those could be carried forward. Per the standing policy for a variability structure that is unreported in every model variant, none is invented here; the model carries typical values only. -
No covariate effects. Section 3.8 states that no
correlation with target engagement was observed for APOE e4 genotype,
presence of ARIA, or baseline amyloid burden (“data not shown”), so no
covariate effects are encoded. Those screened-and-not-retained
covariates are not declared in
covariateData, because the paper reports no usable point estimate for any of them. -
CEFFECTis a CSF, not a serum, concentration. The two differ by roughly a factor of 30-60: the paper reports mean CSF-to-serum percent ratios of 1.65% to 3.25% across cohorts (Section 3.7). Substituting a serum concentration intoCEFFECTwould overpredict target engagement severely. The CSF measurement is also total (bound plus unbound) drug whereas the serum measurement is free drug, so the two are not directly comparable even after scaling (Section 3.7). -
Target engagement is in assay-defined arbitrary
units. CSF samples were quantitated relative to a
sabirnetug-AbetaO calibrator and reported as AU/mL (Section 2.9).
Emaxis therefore in AU/mL and is not interpretable as an absolute molar AbetaO concentration or as a percent occupancy; the paper’s own “% of maximum target engagement” statements are ratios to thisEmax. -
units$timeis nominal. The model has no time dependence at all;"h"is recorded to satisfy the registry’s canonical unit vocabulary and matches the hours used by the paper’s PK reporting. - Individual weights are not reported. The population metadata records the 41-113 kg protocol eligibility window and the mean BMI of 28.0 (SD 5.4) kg/m2 rather than an observed weight range. Weight is not a covariate in this model.
Errata
One erratum exists, and it changes nothing in this model.
Siemers E, et al. Erratum to “INTERCEPT-AD, a phase 1 study of intravenous sabirnetug in participants with mild cognitive impairment or mild dementia due to Alzheimer’s disease” [J Prev Alzheimers Dis 2025;12(1):100005]. J Prev Alzheimers Dis. 2025;12(7):100213. doi:10.1016/j.tjpad.2025.100213 (PMID 40450514, PMC12321635).
Its entire content is the restoration of the Declaration of Competing
Interest section, which the publisher had rendered as “none” during
production despite the authors having supplied a full declaration. It
revises no parameter estimate, no equation, no unit and no reported
value, so the main article remains the sole source for every number in
this model. It is recorded here rather than in the model file’s
reference field for that reason.
The Elsevier supplement (mmc1.docx) contains only
Supplemental Tables 1 and 2 (cognitive assessments for study Parts A and
B); it contains no model equations, no parameter values and no control
stream.