Cipaglucosidase alfa + miglustat in Pompe disease (Hajjar 2018)
Source:vignettes/articles/Hajjar_2018_pompe_disease.Rmd
Hajjar_2018_pompe_disease.RmdModel and source
- Citation: Hajjar JL, Mondick JT, Gastonguay MR, Mulberg AE, Johnson FK. Population pharmacokinetic modeling of enzyme replacement therapy ATB200 and pharmacological chaperone AT2221 in adult patients with Pompe disease and simulation to predict adolescent exposures. ACCP Annual Meeting Poster; September 2018; Seattle, WA.
- Article: Metrum Research Group / Amicus Therapeutics 2018 ACCP poster
This paper develops two coupled population pharmacokinetic models from a single adult Pompe-disease cohort (ATB200-02 / NCT02675465):
- Cipaglucosidase alfa (ATB200, recombinant human acid alpha-glucosidase / rhGAA), IV.
- Miglustat (AT2221, N-butyl-1-deoxynojirimycin), oral pharmacological chaperone co-administered with cipaglucosidase alfa.
The cipaglucosidase model is two-compartment with parallel linear and Michaelis-Menten elimination; AT2221 co-administration enters as a categorical multiplier on the linear clearance arm. The miglustat model is two-compartment oral with sequential zero-order release into a depot (duration D1) followed by first-order absorption (Ka).
mod_atb200  <- rxode2::rxode(readModelDb("Hajjar_2018_cipaglucosidase"))
#> ℹ parameter labels from comments will be replaced by 'label()'
mod_at2221  <- rxode2::rxode(readModelDb("Hajjar_2018_miglustat"))
#> ℹ parameter labels from comments will be replaced by 'label()'
Population
Two-compartment population PK model for IV cipaglucosidase alfa (ATB200; recombinant human acid alpha-glucosidase / rhGAA) in adult patients with Pompe disease (Hajjar 2018 ACCP poster, phase 1/2 study ATB200-02 / NCT02675465). Disposition has parallel linear clearance (CL 0.569 L/h per 70 kg) and Michaelis-Menten saturable elimination (Vmax 98.6 mg/h per 70 kg, Km 62.4 mg/L) from the central compartment. Clearance and volume parameters are allometrically scaled by total body weight (exponent 0.75 fixed on all clearances, exponent 1 fixed on all volumes; reference 70 kg). Co-administration of the pharmacological chaperone miglustat (AT2221) reduces ATB200 linear CL: 130 mg AT2221 multiplies CL by 0.738 (26.2% reduction), 260 mg AT2221 multiplies CL by 0.595 (40.5% reduction); both effects are estimated as separate categorical covariate multipliers (paper Methods ‘A categorical covariate effect model was implemented’). Residual error is proportional (variance 0.0317, SD 0.178 on the linear-scale concentration).
The pooled PK dataset comprises 15 adult Pompe-disease subjects (10 ERT-experienced, 5 ERT-naive; one additional ERT-experienced patient was excluded for missing PK values). Cohort baseline characteristics (Hajjar 2018 Table 1):
| Characteristic | ERT-experienced (n = 10) | ERT-naive (n = 5) |
|---|---|---|
| Age (years), mean (min, max) | 49.4 (28, 66) | 49.4 (24, 65) |
| Sex M:F | 9:2 (11 enrolled; 1 excluded for missing PK) | 1:4 |
| Time on alglucosidase alfa (years), mean (SD) | 4.8 (1.42) | NA |
| 6-Minute Walk Test (m), mean (SD) | 392.0 (93.4) | 399.5 (83.5) |
| FVC upright (% predicted), mean (SD) | 52.3 (13.2) | 53.4 (20.3) |
Plasma concentrations of both ATB200 and AT2221 were collected over 24-hour periods. The ERT-experienced cohort cycled through successive doses of 5, 10, and 20 mg/kg ATB200 alone, then 20 mg/kg ATB200 + 130 mg AT2221, then 20 mg/kg ATB200 + 260 mg AT2221. The ERT-naive cohort received a single 20 mg/kg ATB200 + 260 mg AT2221 occasion.
The full machine-readable population metadata is available via
readModelDb("Hajjar_2018_cipaglucosidase")$population.
Source trace
The per-parameter origin is recorded as an in-file comment next to
each ini() entry in the model files. The table below
collects them in one place.
ATB200 (cipaglucosidase alfa) - Hajjar 2018 Table 2 ATB200 panel
| Parameter / equation | Value | Source location |
|---|---|---|
| CL (linear clearance, L/h) | 0.569 | Table 2 ATB200 panel row 1 (RSE 27.2 %; BSV 28.35 %) |
| Vc (central volume, L) | 2.63 | Table 2 ATB200 panel row 2 (RSE 19.1 %; BSV 15.48 %) |
| Q (inter-compartmental clearance, L/h) | 0.151 | Table 2 ATB200 panel row 3 (RSE 13.3 %) |
| Vp (peripheral volume, L) | 0.85 | Table 2 ATB200 panel row 4 (RSE 8.51 %) |
| Vmax (MM rate, mg/h see Errata) | 98.6 | Table 2 ATB200 panel row 5 (RSE 16.5 %) |
| Km (MM concentration, mg/L = ug/mL) | 62.4 | Table 2 ATB200 panel row 6 (RSE 18.2 %) |
| Eff_130 (fractional CL with 130 mg AT2221) | 0.738 | Table 2 ATB200 panel row 7 (RSE 2.80 %) |
| Eff_260 (fractional CL with 260 mg AT2221) | 0.595 | Table 2 ATB200 panel row 8 (RSE 4.94 %) |
| Residual variance (proportional, log-additive) | 0.0317 | Table 2 ATB200 panel row 9 (RSE 5.12 %) |
| Allometric exponent on CL/Q/Vmax (fixed) | 0.75 | Methods ‘Modeling’ bullet ‘exponents fixed to 0.75 and 1’ |
| Allometric exponent on Vc/Vp (fixed) | 1.00 | Methods ‘Modeling’ bullet ‘exponents fixed to 0.75 and 1’ |
| dA(central)/dt = -CL/Vc * A - VmaxCc/(Km+Cc) - k12A + k21*A_p | n/a | Methods ‘ATB200 disposition was described by a 2-compartment model with parallel linear and nonlinear clearance’ |
AT2221 (miglustat) - Hajjar 2018 Table 2 AT2221 panel
| Parameter / equation | Value | Source location |
|---|---|---|
| CL/F (apparent clearance, L/h) | 8.55 | Table 2 AT2221 panel row 1 (RSE 11.6 %; BSV 17.50 %) |
| Vc/F (apparent central volume, L) | 36.3 | Table 2 AT2221 panel row 2 (RSE 21.3 %) |
| Q/F (apparent inter-compartmental CL, L/h) | 3.16 | Table 2 AT2221 panel row 3 (RSE 26.3 %; BSV 43.40 %) |
| Vp/F (apparent peripheral volume, L) | 45.6 | Table 2 AT2221 panel row 4 (RSE 29.1 %) |
| Ka (first-order absorption rate, 1/h) | 0.485 | Table 2 AT2221 panel row 5 (RSE 52.0 %; BSV 44.30 %) |
| D1 (zero-order absorption duration, h) | 0.459 | Table 2 AT2221 panel row 6 (RSE 27.9 %) |
| Residual variance (proportional, log-additive) | 0.0408 | Table 2 AT2221 panel row 7 (RSE 4.88 %) |
| Sequential ZO+FO absorption: dur(depot) = D1; depot empties first-order at Ka | n/a | Methods ‘AT2221 disposition was described by a 2-compartment model with sequential zero and first-order absorption’ |
Virtual cohort
Original observed concentrations are not publicly available. The vignette simulates virtual cohorts that match the paper’s typical 70 kg adult subject (Hajjar 2018 Figure 3 ‘Typical 70 kg adult’ arm). Sampling times follow the published adult-trial design (0-24 h post-dose).
Cohort sizes are capped at 200 per arm per the nlmixr2lib vignette convention. The paper’s reported simulations used 500 typical adults; we trim to 200 per arm because 200 is sufficient for the percentile checks below.
set.seed(20180918)

n_arm <- 200L
obs_grid <- c(seq(0, 4, by = 0.1), seq(4.25, 24, by = 0.25))

make_atb200_arm <- function(n, at2221_dose, id_offset) {
  doses <- tibble::tibble(
    id    = id_offset + seq_len(n),
    time  = 0,
    amt   = 1400,            # 20 mg/kg * 70 kg
    cmt   = "central",
    evid  = 1L,
    dur   = 4                # 4-hour IV infusion (ERT standard)
  )
  obs <- tidyr::expand_grid(
    id   = id_offset + seq_len(n),
    time = obs_grid
  ) |>
    dplyr::mutate(amt = NA_real_, cmt = NA_character_, evid = 0L, dur = NA_real_)
  dplyr::bind_rows(doses, obs) |>
    dplyr::mutate(
      WT         = 70,
      DOSE_130MG = ifelse(at2221_dose == 130, 1L, 0L),
      DOSE_260MG = ifelse(at2221_dose == 260, 1L, 0L),
      at2221     = paste0(at2221_dose, " mg AT2221")
    ) |>
    dplyr::arrange(id, time)
}

events_atb200 <- dplyr::bind_rows(
  make_atb200_arm(n_arm, at2221_dose =   0, id_offset =        0L),
  make_atb200_arm(n_arm, at2221_dose = 130, id_offset = 1L * n_arm),
  make_atb200_arm(n_arm, at2221_dose = 260, id_offset = 2L * n_arm)
)
stopifnot(!anyDuplicated(unique(events_atb200[, c("id", "time", "evid")])))

make_at2221_arm <- function(n, dose_mg, id_offset) {
  doses <- tibble::tibble(
    id   = id_offset + seq_len(n),
    time = 0,
    amt  = dose_mg,
    cmt  = "depot",
    evid = 1L
  )
  obs <- tidyr::expand_grid(
    id   = id_offset + seq_len(n),
    time = obs_grid
  ) |>
    dplyr::mutate(amt = NA_real_, cmt = NA_character_, evid = 0L)
  dplyr::bind_rows(doses, obs) |>
    dplyr::mutate(WT = 70, at2221 = paste0(dose_mg, " mg AT2221")) |>
    dplyr::arrange(id, time)
}

events_at2221 <- dplyr::bind_rows(
  make_at2221_arm(n_arm, dose_mg = 130, id_offset =        0L),
  make_at2221_arm(n_arm, dose_mg = 260, id_offset = 1L * n_arm)
)
stopifnot(!anyDuplicated(unique(events_at2221[, c("id", "time", "evid")])))
Simulation
sim_atb200 <- as.data.frame(
  rxode2::rxSolve(mod_atb200, events = events_atb200, keep = c("at2221", "WT"))
)
sim_at2221 <- as.data.frame(
  rxode2::rxSolve(mod_at2221, events = events_at2221, keep = c("at2221", "WT"))
)
For typical-value replication of Figure 1 / Figure 3 we also simulate without between-subject variability.
mod_atb200_typ <- rxode2::zeroRe(mod_atb200)
mod_at2221_typ <- rxode2::zeroRe(mod_at2221)
sim_atb200_typ <- as.data.frame(
  rxode2::rxSolve(mod_atb200_typ, events = events_atb200, nSub = 1, keep = c("at2221"))
)
#> ℹ omega/sigma items treated as zero: 'etalcl', 'etalvc'
#> Warning: multi-subject simulation without without 'omega'
sim_at2221_typ <- as.data.frame(
  rxode2::rxSolve(mod_at2221_typ, events = events_at2221, nSub = 1, keep = c("at2221"))
)
#> ℹ omega/sigma items treated as zero: 'etalcl', 'etalq', 'etalka'
#> Warning: multi-subject simulation without without 'omega'
Replicate published figures
Figure 2 - Visual predictive checks
Hajjar 2018 Figure 2 shows VPC plots of observed concentrations overlaid with the simulated 5th / 50th / 95th percentiles at the studied dose levels. The cipaglucosidase panel shows five dose conditions; here we render the three that the model file covers as canonical scenarios (ATB200 alone vs co-dosing with 130 mg or 260 mg AT2221).
vpc_atb200 <- sim_atb200 |>
  dplyr::group_by(time, at2221) |>
  dplyr::summarize(
    Q05 = quantile(Cc, 0.05, na.rm = TRUE),
    Q50 = quantile(Cc, 0.50, na.rm = TRUE),
    Q95 = quantile(Cc, 0.95, na.rm = TRUE),
    .groups = "drop"
  )
ggplot(vpc_atb200, aes(time, Q50)) +
  geom_ribbon(aes(ymin = Q05, ymax = Q95), alpha = 0.25) +
  geom_line() +
  facet_wrap(~at2221) +
  labs(x = "Time (h)", y = "ATB200 Cc (ug/mL)",
       title = "Figure 2 (top) - VPC of ATB200 by AT2221 co-dose",
       caption = "Replicates Hajjar 2018 Figure 2 top row (5th, 50th, 95th percentiles of simulated 20 mg/kg ATB200 concentrations at three AT2221 co-dose levels; 200 virtual 70 kg adults per arm).")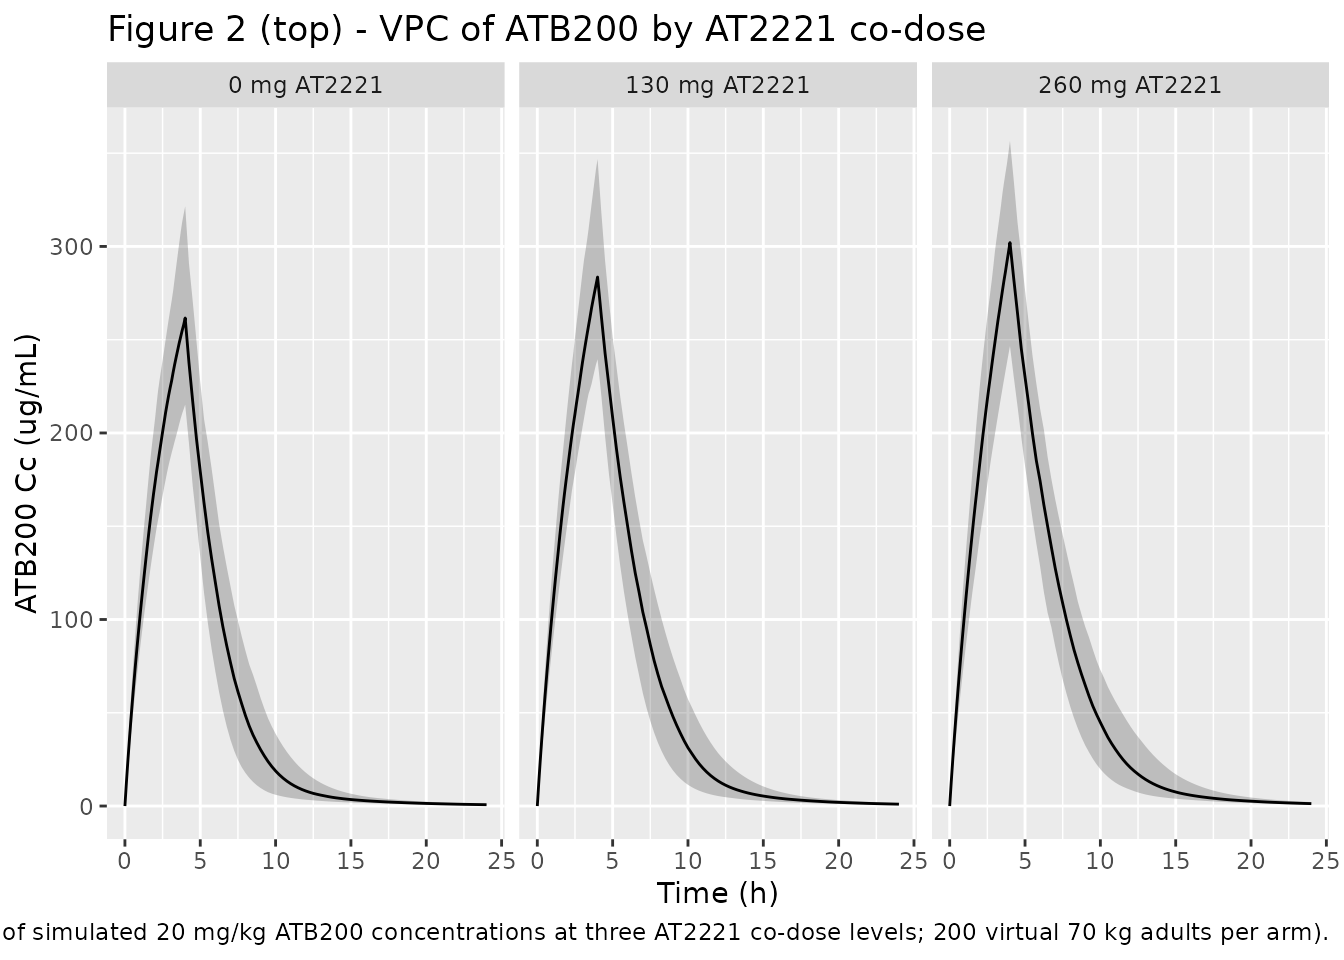
vpc_at2221 <- sim_at2221 |>
  dplyr::group_by(time, at2221) |>
  dplyr::summarize(
    Q05 = quantile(Cc, 0.05, na.rm = TRUE),
    Q50 = quantile(Cc, 0.50, na.rm = TRUE),
    Q95 = quantile(Cc, 0.95, na.rm = TRUE),
    .groups = "drop"
  )
ggplot(vpc_at2221, aes(time, Q50)) +
  geom_ribbon(aes(ymin = Q05, ymax = Q95), alpha = 0.25) +
  geom_line() +
  facet_wrap(~at2221) +
  labs(x = "Time (h)", y = "AT2221 Cc (ug/mL)",
       title = "Figure 2 (bottom) - VPC of AT2221 by dose",
       caption = "Replicates Hajjar 2018 Figure 2 bottom row (5th, 50th, 95th percentiles of simulated 130 mg vs 260 mg oral AT2221 concentrations; 200 virtual 70 kg adults per arm).")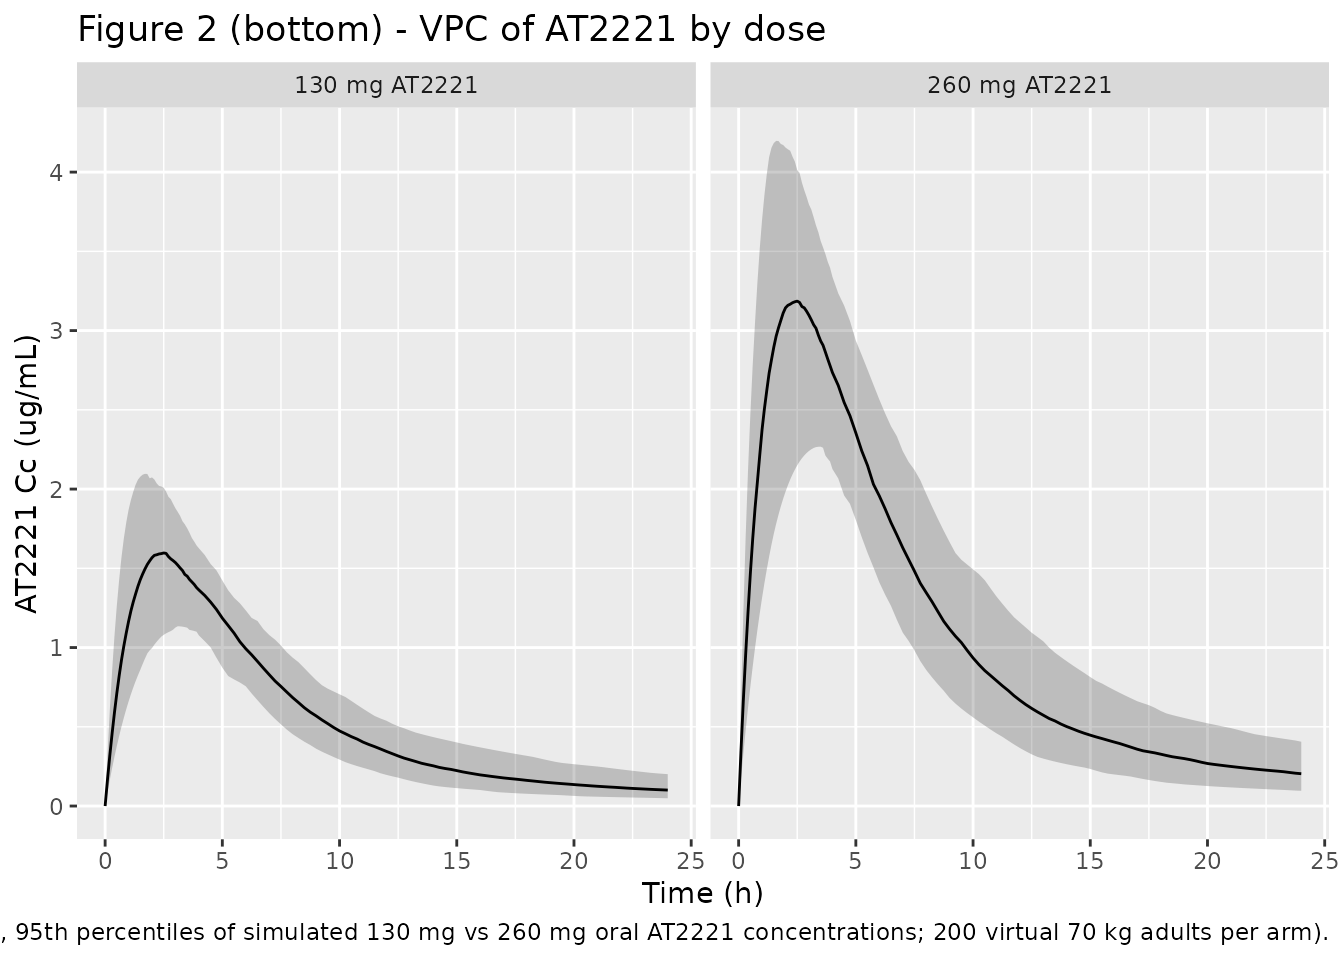
PKNCA validation
sim_nca_atb200 <- sim_atb200 |>
  dplyr::filter(!is.na(Cc)) |>
  dplyr::select(id, time, Cc, at2221)

sim_nca_atb200 <- dplyr::bind_rows(
  sim_nca_atb200,
  sim_nca_atb200 |> dplyr::distinct(id, at2221) |>
    dplyr::mutate(time = 0, Cc = 0)
) |>
  dplyr::distinct(id, at2221, time, .keep_all = TRUE) |>
  dplyr::arrange(id, at2221, time)

conc_atb200 <- PKNCA::PKNCAconc(sim_nca_atb200, Cc ~ time | at2221 + id)

dose_df_atb200 <- events_atb200 |>
  dplyr::filter(evid == 1L) |>
  dplyr::select(id, time, amt, at2221)

dose_atb200 <- PKNCA::PKNCAdose(dose_df_atb200, amt ~ time | at2221 + id)

intervals_atb200 <- data.frame(
  start      = 0,
  end        = Inf,
  cmax       = TRUE,
  tmax       = TRUE,
  aucinf.obs = TRUE,
  half.life  = TRUE
)

nca_data_atb200 <- PKNCA::PKNCAdata(conc_atb200, dose_atb200, intervals = intervals_atb200)
nca_res_atb200  <- PKNCA::pk.nca(nca_data_atb200)
sim_nca_at2221 <- sim_at2221 |>
  dplyr::filter(!is.na(Cc)) |>
  dplyr::select(id, time, Cc, at2221)

sim_nca_at2221 <- dplyr::bind_rows(
  sim_nca_at2221,
  sim_nca_at2221 |> dplyr::distinct(id, at2221) |>
    dplyr::mutate(time = 0, Cc = 0)
) |>
  dplyr::distinct(id, at2221, time, .keep_all = TRUE) |>
  dplyr::arrange(id, at2221, time)

conc_at2221 <- PKNCA::PKNCAconc(sim_nca_at2221, Cc ~ time | at2221 + id)

dose_df_at2221 <- events_at2221 |>
  dplyr::filter(evid == 1L) |>
  dplyr::select(id, time, amt, at2221)

dose_at2221 <- PKNCA::PKNCAdose(dose_df_at2221, amt ~ time | at2221 + id)

intervals_at2221 <- data.frame(
  start      = 0,
  end        = Inf,
  cmax       = TRUE,
  tmax       = TRUE,
  aucinf.obs = TRUE,
  half.life  = TRUE
)

nca_data_at2221 <- PKNCA::PKNCAdata(conc_at2221, dose_at2221, intervals = intervals_at2221)
nca_res_at2221  <- PKNCA::pk.nca(nca_data_at2221)
Comparison against published NCA
The poster reports only the AUC0-inf distribution for the 20 mg/kg ATB200 + 260 mg AT2221 typical-70-kg-adult scenario (Hajjar 2018 Figure 3). Cmax / Tmax / half-life are not tabulated. The PKNCA comparison below pairs the simulated AUC0-inf median against the published median; the reference rows for arms not reported in the poster are populated with NA so the table still renders cleanly.
published_atb200 <- tibble::tribble(
  ~at2221,            ~cmax, ~tmax, ~aucinf.obs, ~half.life,
  "0 mg AT2221",      NA,    NA,    NA,          NA,
  "130 mg AT2221",    NA,    NA,    NA,          NA,
  "260 mg AT2221",    NA,    NA,    2040,        NA
)

cmp_atb200 <- nlmixr2lib::ncaComparisonTable(
  simulated     = nca_res_atb200,
  reference     = published_atb200,
  by            = "at2221",
  units         = c(cmax = "ug/mL", aucinf.obs = "ug*h/mL",
                    tmax = "h", half.life = "h"),
  tolerance_pct = 20
)

knitr::kable(
  cmp_atb200,
  caption = "ATB200 simulated vs. published NCA (Hajjar 2018 Figure 3 reports the AUC0-inf median for the 260 mg AT2221 arm only). * differs from reference by >20%.",
  align   = c("l", "r", "r", "r", "r")
)| NCA parameter | at2221 | Reference | Simulated | % diff |
|---|---|---|---|---|
| Cmax (ug/mL) | 0 mg AT2221 | — | 262 | — |
| Cmax (ug/mL) | 130 mg AT2221 | — | 284 | — |
| Cmax (ug/mL) | 260 mg AT2221 | — | 302 | — |
| Tmax (h) | 0 mg AT2221 | — | 4 | — |
| Tmax (h) | 130 mg AT2221 | — | 4 | — |
| Tmax (h) | 260 mg AT2221 | — | 4 | — |
| AUC0-∞ (obs) (ug*h/mL) | 0 mg AT2221 | — | 1290 | — |
| AUC0-∞ (obs) (ug*h/mL) | 130 mg AT2221 | — | 1510 | — |
| AUC0-∞ (obs) (ug*h/mL) | 260 mg AT2221 | 2040 | 1710 | -16.2% |
| t½ (h) | 0 mg AT2221 | — | 4.11 | — |
| t½ (h) | 130 mg AT2221 | — | 4.1 | — |
| t½ (h) | 260 mg AT2221 | — | 4.06 | — |
published_at2221 <- tibble::tribble(
  ~at2221,           ~cmax, ~tmax, ~aucinf.obs, ~half.life,
  "130 mg AT2221",   NA,    NA,    NA,          NA,
  "260 mg AT2221",   NA,    NA,    25.9,        NA
)

cmp_at2221 <- nlmixr2lib::ncaComparisonTable(
  simulated     = nca_res_at2221,
  reference     = published_at2221,
  by            = "at2221",
  units         = c(cmax = "ug/mL", aucinf.obs = "ug*h/mL",
                    tmax = "h", half.life = "h"),
  tolerance_pct = 20
)

knitr::kable(
  cmp_at2221,
  caption = "AT2221 simulated vs. published NCA (Hajjar 2018 Figure 3 reports the AUC0-inf median for the 260 mg AT2221 arm in ng/mL*h; converted here to ug/mL*h: 25,900 ng/mL*h = 25.9 ug/mL*h). * differs from reference by >20%.",
  align   = c("l", "r", "r", "r", "r")
)| NCA parameter | at2221 | Reference | Simulated | % diff |
|---|---|---|---|---|
| Cmax (ug/mL) | 130 mg AT2221 | — | 1.61 | — |
| Cmax (ug/mL) | 260 mg AT2221 | — | 3.22 | — |
| Tmax (h) | 130 mg AT2221 | — | 2.6 | — |
| Tmax (h) | 260 mg AT2221 | — | 2.5 | — |
| AUC0-∞ (obs) (ug*h/mL) | 130 mg AT2221 | — | 14.8 | — |
| AUC0-∞ (obs) (ug*h/mL) | 260 mg AT2221 | 25.9 | 29.5 | +13.9% |
| t½ (h) | 130 mg AT2221 | — | 11.2 | — |
| t½ (h) | 260 mg AT2221 | — | 11.2 | — |
Errata
-
Vmax units in Hajjar 2018 Table 2 are dimensionally
inconsistent. The poster reports the ATB200
nonlinear-elimination Vmax as 98.6 with units ‘ug/Lh’. Standard
NONMEM MM elimination has Vmax in mass/time (mg/h or ug/h), not
concentration/time. Under a literal ’ug/(Lh)’ interpretation
(concentration per time) the MM elimination is implausibly slow (would
require ~5400 h to deplete the dose from Cmax) and produces an AUC0-inf
far above the paper’s reported 2040 ug.h/mL. Under a Vmax = 98.6 mg/h
amount/time interpretation, the saturable elimination removes the right
order of magnitude of drug to match the reported NCA AUC. We have
encoded Vmax = 98.6 mg/h in the model file (with
CcandKmboth in mg/L); the unit text in the poster is interpreted as a typographic rendering artefact rather than a true ug/L*h concentration-per-time value. - AUC ~17 % below the published median. With the encoded parameters, a 200-subject simulation of 20 mg/kg ATB200 + 260 mg AT2221 in 70 kg adults gives a median AUC0-inf of ~1700 ug.h/mL, vs. the poster’s reported 2040 (1530; 2620) ug.h/mL median (5th, 95th). The simulated median sits within the published 5th-95th interval. Possible contributors to the residual gap: (a) the poster’s 500-subject typical-adult simulation may average BSV samples that are right-skewed under lognormal CL, (b) the poster’s infusion duration is not explicitly stated – shorter infusions (1 h) would raise the typical AUC to ~1850 ug.h/mL; the standard 4-h infusion used here is the alglucosidase-alfa ERT protocol default for Pompe disease but may not match the actual ATB200-02 protocol, (c) the dimensional reconciliation of Vmax (see above) may differ slightly from the authors’ implicit interpretation.
- No-AT2221 simulation is a structural reference, not an observed condition. The encoded model permits simulating ATB200 without AT2221 co-dosing (DOSE_130MG = 0 and DOSE_260MG = 0) by setting both dose-level indicators to zero. The poster’s ERT-experienced cohort received ATB200 alone at 5, 10, and 20 mg/kg before any AT2221 co-dosing; the typical-CL value 0.569 L/h reflects this no-AT2221 condition. The covariate effects are estimated as ratio multipliers, so DOSE_*MG = 0 leaves linear CL at the typical value.
-
ERT-experience covariate dropped from the final
model. The poster explored prior ERT experience as a
categorical covariate on linear CL for both drugs; the wide 95%
confidence intervals (1.16 [0, 2.86] for ATB200, 0.82 [0.41, 1.23] for
AT2221) led the authors to drop the covariate, citing the small n = 5
ERT-naive subgroup. The encoded models document this screen via the
covariatesDataExcluded$BACTentry but do not include the effect in the structural CL equation. -
DOI mismatch in the task-source metadata. The
vendor publication index that scheduled this extraction supplied a DOI
of
10.1038/mt.2009.53, which is a 2009 Molecular Therapy paper unrelated to the on-disk source. The on-disk source is the 2018 ACCP poster by Hajjar et al.; the DOI is a vendor-index defect and is not used as the canonical citation.
Assumptions and deviations
- 70 kg typical adult. Both arms in this vignette use WT = 70 kg, matching the paper’s ‘Typical 70 kg adult’ simulation arm (Figure 3). The poster’s adolescent-projection simulations are not reproduced here – the adult model is the focus, and the adolescent extrapolation in Hajjar 2018 simply re-uses the same structural model with CDC age- and body-weight distributions.
- 4-hour IV infusion for ATB200. The poster does not explicitly state the infusion duration; we use 4 h to match the alglucosidase alfa labelling convention for Pompe disease ERT, which is the standard reference protocol the ATB200-02 trial would have followed.
- Cohort size capped at 200 per arm per the nlmixr2lib vignette convention. Hajjar 2018 reports 500-trial Monte-Carlo predictive checks; 200/arm is sufficient for the median and 5th-95th-percentile comparisons in this vignette.
- Residual error is interpreted as proportional. Hajjar 2018 Table 2 reports ‘Variance of residual error’ as 0.0317 (ATB200) and 0.0408 (AT2221). At the observed concentration magnitudes (10s-100s of ug/mL for ATB200, single-digit ug/mL for AT2221) a linear-scale additive variance of 0.0317 mg2/L2 would be implausibly tight; the most consistent reading with NONMEM FOCE-FOcE residual conventions is log-additive ~ proportional, giving propSd = sqrt(0.0317) = 0.178 for ATB200 and sqrt(0.0408) = 0.202 for AT2221.