Dorzagliatin for PI3K inhibitor-induced hyperglycemia in mice (Jin 2025)
Source:vignettes/articles/Jin_2025_dorzagliatin_pi3ki_hyperglycemia.Rmd
Jin_2025_dorzagliatin_pi3ki_hyperglycemia.RmdModel and source
- Citation: Jin G, Zheng K, Liu S, Yi H, Wei W, Xu C, Xiang X, Kang Y. In Vivo PK-PD and Drug-Drug Interaction Study of Dorzagliatin for the Management of PI3Kalpha Inhibitor-Induced Hyperglycemia. Pharmaceuticals (Basel). 2025;18(6):927. doi:10.3390/ph18060927.
- Article: https://doi.org/10.3390/ph18060927
Jin 2025 studied whether the glucokinase activator dorzagliatin can control the hyperglycemia caused by two PI3K inhibitors, the PI3K/mTOR inhibitor WX390 and the PI3Kalpha inhibitor alpelisib (BYL719), in female BALB/c nude mice. Each drug was given by oral gavage once daily for four weeks, alone or with dorzagliatin given 30 min before the PI3K inhibitor. On day 28 the authors measured plasma concentrations (a PK study, n = 6 per group) and fasting blood glucose (a separate PD study, n = 3 per group), and related the dorzagliatin plasma concentration to the percent reduction in fasting plasma glucose with a sigmoid Emax model, fitted separately for each of the three dorzagliatin-containing groups (Jin 2025 Table 5).
The paper contributes three model files, one per fitted group:
| Model file | Group (Table 5) | Reference group for the glucose reduction (Equation 5) |
|---|---|---|
Jin_2025_dorzagliatin |
Dorz | vehicle control |
Jin_2025_dorzagliatin_wx390 |
Dorz + WX390 | WX390 alone |
Jin_2025_dorzagliatin_alpelisib |
Dorz + BYL719 | BYL719 (alpelisib) alone |
All three are PD-only: Jin 2025 also fitted a
two-compartment PK model with first-order absorption in Phoenix, but did
not publish any of its parameter values (only the non-compartmental
Cmax, Tmax, AUC and half-life of Table 3), so the concentration that
drives each curve is supplied as the covariate
CP_DORZAGLIATIN_NGML. This follows the registry precedent
of Warren_2025_orismilast and
Fostvedt_2021_glasdegib_QTcS.
models <- c("Jin_2025_dorzagliatin", "Jin_2025_dorzagliatin_wx390",
            "Jin_2025_dorzagliatin_alpelisib")
for (m in models) {
  cat(m, "\n  ", rxode2::rxode(readModelDb(m))$description, "\n\n", sep = "")
}
#> Jin_2025_dorzagliatin
#>   Preclinical (mouse). Sigmoid Emax model of the percent reduction in fasting plasma glucose produced by oral dorzagliatin (a glucokinase activator) given alone, relative to the time-matched vehicle control group, driven by an externally supplied dorzagliatin plasma concentration (CP_DORZAGLIATIN_NGML). Fit in female BALB/c nude mice after 28 days of dorzagliatin 10 mg/kg once daily by oral gavage (Jin 2025 Table 5, row 'Dorz'). PD-only model: Jin 2025 fitted a two-compartment first-order absorption PK model in Phoenix but published none of its parameter values, so no PK layer is packaged and users must supply the concentration trajectory. Companion files Jin_2025_dorzagliatin_wx390 and Jin_2025_dorzagliatin_alpelisib carry the separately fitted curves for dorzagliatin given with the PI3K inhibitors WX390 and alpelisib (BYL719).
#>
#> Jin_2025_dorzagliatin_wx390
#>   Preclinical (mouse). Sigmoid Emax model of the percent reduction in fasting plasma glucose produced by oral dorzagliatin (a glucokinase activator) given with the PI3K/mTOR inhibitor WX390, relative to the time-matched WX390-alone control group, driven by an externally supplied dorzagliatin plasma concentration (CP_DORZAGLIATIN_NGML). Fit in female BALB/c nude mice after 28 days of dorzagliatin 10 mg/kg once daily by oral gavage, given 30 min before WX390 0.2 mg/kg (Jin 2025 Table 5, row 'Dorz + WX390'). PD-only model: Jin 2025 fitted a two-compartment first-order absorption PK model in Phoenix but published none of its parameter values, so no PK layer is packaged and users must supply the concentration trajectory. Companion files Jin_2025_dorzagliatin (dorzagliatin alone) and Jin_2025_dorzagliatin_alpelisib (with alpelisib, BYL719) carry the other two separately fitted curves.
#>
#> Jin_2025_dorzagliatin_alpelisib
#>   Preclinical (mouse). Sigmoid Emax model of the percent reduction in fasting plasma glucose produced by oral dorzagliatin (a glucokinase activator) given with the PI3Kalpha inhibitor alpelisib (BYL719), relative to the time-matched alpelisib-alone (BYL719) control group, driven by an externally supplied dorzagliatin plasma concentration (CP_DORZAGLIATIN_NGML). Fit in female BALB/c nude mice after 28 days of dorzagliatin 10 mg/kg once daily by oral gavage, given 30 min before alpelisib (BYL719) 25 mg/kg (Jin 2025 Table 5, row 'Dorz + BYL719'). PD-only model: Jin 2025 fitted a two-compartment first-order absorption PK model in Phoenix but published none of its parameter values, so no PK layer is packaged and users must supply the concentration trajectory. Companion files Jin_2025_dorzagliatin (dorzagliatin alone) and Jin_2025_dorzagliatin_wx390 (with WX390) carry the other two separately fitted curves.
Population
Female BALB/c nude mice, 6-8 weeks old and 18-20 g at purchase (Charles River, Pinghu, China), carrying subcutaneous OVCAR3 ovarian-cancer xenografts in the tumour-growth and PK study (Jin 2025 Section 4.2.1). The glucose PD study used 18 mice in six groups of n = 3 with the same grouping, doses and route (Section 4.5): dorzagliatin 10 mg/kg, WX390 0.2 mg/kg and alpelisib 25 mg/kg by oral gavage once daily for 28 days. Food was removed 6 h before the last dose and tail-vein glucose was measured by glucometer over the following 8 h.
The PD response (Jin 2025 Equation 5) is a between-group quantity:
dFPG = (FPG_control - FPG_exp) / FPG_control x 100%
where the control is the vehicle group for dorzagliatin alone and the PI3K-inhibitor-alone group for each combination. It is therefore the extra glucose lowering that dorzagliatin adds on top of what the mouse would show without it, not a change from the animal’s own baseline. The fits were made to group means, and no between-animal variability or residual error was reported, so all three models are typical-value only.
str(rxode2::rxode(readModelDb("Jin_2025_dorzagliatin"))$population)
#> List of 11
#>  $ species       : chr "mouse (female BALB/c nude)"
#>  $ n_subjects    : int 3
#>  $ n_studies     : num 1
#>  $ age_range     : chr "6-8 weeks at purchase"
#>  $ weight_range  : chr "18-20 g at purchase"
#>  $ sex_female_pct: num 100
#>  $ race_ethnicity: logi NA
#>  $ disease_state : chr "Nude mice of the OVCAR3 ovarian-cancer xenograft programme; the glucose pharmacodynamic study was fasted from 6"| __truncated__
#>  $ dose_range    : chr "Dorzagliatin 10 mg/kg orally once daily for 28 days"
#>  $ regions       : chr "China"
#>  $ notes         : chr "PD study (Jin 2025 Section 4.5): 18 female BALB/c nude mice in six groups of n = 3 (vehicle, WX390, BYL719, dor"| __truncated__
Source trace
Every model has the same equation (Jin 2025 Equation 6),
fpg_reduction = e0 + emax * C^hill / (ec50^hill + C^hill),
with C the dorzagliatin plasma concentration,
CP_DORZAGLIATIN_NGML.
| Parameter | Jin_2025_dorzagliatin |
Jin_2025_dorzagliatin_wx390 |
Jin_2025_dorzagliatin_alpelisib |
Source location |
|---|---|---|---|---|
le0 (%) |
log(10) |
log(12) |
log(18) |
Table 5, constant term of each equation |
lemax (%) |
log(50) |
log(56) |
log(60) |
Table 5, coefficient of the Hill term |
lec50 (ng/mL) |
log(740) |
log(490) |
log(660) |
Section 2.5 text; Table 5 denominators |
lhill (unitless) |
log(0.80) |
log(1.35) |
log(0.95) |
Section 2.5 text; Table 5 exponents (see below for the Dorz row) |
fpg_reduction |
Eq. 6 | Eq. 6 | Eq. 6 | Section 4.6.2, Equations 5 and 6 |
The Hill exponent of the dorzagliatin-alone group
Table 5 prints the dorzagliatin-alone equation as
E = 10 + 50 x C^1.10 / (740^0.80 + C^0.80), with an
exponent of 1.10 in the numerator and 0.80 in the denominator. Equation
6 has a single exponent, so one of the two is a misprint. The model uses
0.80, because:
- Section 2.5 states the Hill coefficients are “0.80, 1.35, and 0.95” for the three groups;
- 0.80 appears twice in the printed equation and 1.10 once;
- Section 2.5 says the Dorz + BYL719 group “also exhibited increased synergism” with gamma = 0.95, which is an increase over 0.80 but would be a decrease from 1.10.
The two other rows of Table 5 use the same exponent throughout. The equation with mismatched exponents as printed is not usable: it reaches a 208% reduction in glucose at 840 ng/mL.
Virtual cohort
The models have no random effects and no differential equation, so there is no cohort to sample: each model is evaluated on a grid of dorzagliatin concentrations spanning the observed range (Table 3 means, up to about 2000 ng/mL). One record per concentration is enough.
conc <- seq(0, 2500, by = 10)
grid <- data.frame(
  id = seq_along(conc),
  time = 0,
  evid = 0L,
  amt = NA_real_,
  cmt = NA_character_,
  CP_DORZAGLIATIN_NGML = conc
)
Simulation
group_label <- c(
  Jin_2025_dorzagliatin = "Dorz",
  Jin_2025_dorzagliatin_wx390 = "Dorz + WX390",
  Jin_2025_dorzagliatin_alpelisib = "Dorz + BYL719"
)
sim <- bind_rows(lapply(models, function(m) {
  out <- as.data.frame(rxode2::rxSolve(readModelDb(m), events = grid,
                                       keep = "CP_DORZAGLIATIN_NGML"))
  out$group <- group_label[[m]]
  out
}))
sim$group <- factor(sim$group, levels = group_label)
stopifnot(nrow(sim) == 3L * length(conc), all(is.finite(sim$fpg_reduction)))
Structural checks
The packaged curves reproduce the quantities the paper derives from
them: the response at zero concentration is E0, the
response at the EC50 is half-way to E0 + Emax, and the EC50
is 34% lower with WX390 and 11% lower with alpelisib than with
dorzagliatin alone (Jin 2025 Section 2.5).
par_tab <- bind_rows(lapply(models, function(m) {
  th <- rxode2::rxode(readModelDb(m))$theta
  data.frame(
    group = group_label[[m]],
    e0 = exp(th[["le0"]]),
    emax = exp(th[["lemax"]]),
    ec50 = exp(th[["lec50"]]),
    hill = exp(th[["lhill"]])
  )
}))
at <- function(g, C) sim$fpg_reduction[sim$group == g & sim$CP_DORZAGLIATIN_NGML == C]

checks <- par_tab |>
  mutate(
    at_zero = mapply(at, group, 0),
    at_ec50 = mapply(function(g, C) {
      m <- names(group_label)[group_label == g]
      ev <- grid[1, ]
      ev$CP_DORZAGLIATIN_NGML <- C
      as.data.frame(rxode2::rxSolve(readModelDb(m), events = ev))$fpg_reduction
    }, group, ec50),
    ec50_change_pct = 100 * (ec50 / ec50[group == "Dorz"] - 1)
  )
stopifnot(
  all(abs(checks$at_zero - checks$e0) < 1e-8),
  all(abs(checks$at_ec50 - (checks$e0 + checks$emax / 2)) < 1e-8),
  # Section 2.5: "decreased by 34%" (WX390) and "less pronounced (11%)" (BYL719)
  round(-checks$ec50_change_pct[checks$group == "Dorz + WX390"]) == 34,
  round(-checks$ec50_change_pct[checks$group == "Dorz + BYL719"]) == 11
)
checks |>
  dplyr::rename(
    "Group" = group, "E0 (%)" = e0, "Emax (%)" = emax, "EC50 (ng/mL)" = ec50,
    "Hill" = hill, "E at C = 0 (%)" = at_zero, "E at EC50 (%)" = at_ec50,
    "EC50 change vs Dorz (%)" = ec50_change_pct
  ) |>
knitr::kable(digits = 2)| Group | E0 (%) | Emax (%) | EC50 (ng/mL) | Hill | E at C = 0 (%) | E at EC50 (%) | EC50 change vs Dorz (%) |
|---|---|---|---|---|---|---|---|
| Dorz | 10 | 50 | 740 | 0.80 | 10 | 35 | 0.00 |
| Dorz + WX390 | 12 | 56 | 490 | 1.35 | 12 | 40 | -33.78 |
| Dorz + BYL719 | 18 | 60 | 660 | 0.95 | 18 | 48 | -10.81 |
Replicate published figures
Figure 6: effect-concentration curves
Jin 2025 Figure 6 shows, for each group, the group-mean percent glucose reduction against the dorzagliatin concentration, as points joined in time order (no fitted curve is drawn). The points below were digitised by the maintainers from Figure 6 and are overlaid on the packaged curves.
fig6 <- tibble::tribble(
  ~group,          ~conc, ~obs,
  "Dorz",            100,  12.0,
  "Dorz",            315,  18.5,
  "Dorz",            540,  35.0,
  "Dorz",            660,  42.5,
  "Dorz",            780,  37.5,
  "Dorz",            840,  44.5,
  "Dorz + WX390",    250,  37.5,
  "Dorz + WX390",    280,  37.3,
  "Dorz + WX390",    545,  45.5,
  "Dorz + WX390",    605,  47.0,
  "Dorz + WX390",    700,  50.0,
  "Dorz + WX390",    715,  51.0,
  "Dorz + BYL719",    60,  24.0,
  "Dorz + BYL719",   270,  32.0,
  "Dorz + BYL719",   630,  44.0,
  "Dorz + BYL719",  1240,  48.0,
  "Dorz + BYL719",  1240,  50.0,
  "Dorz + BYL719",  1910,  62.0
) |>
  mutate(group = factor(group, levels = group_label))

fig6$pred <- mapply(function(g, C) {
  p <- par_tab[par_tab$group == g, ]
  f_emax(C, p$e0, p$emax, p$ec50, p$hill)
}, as.character(fig6$group), fig6$conc)
ggplot(sim, aes(CP_DORZAGLIATIN_NGML, fpg_reduction)) +
  geom_line() +
  geom_point(data = fig6, aes(conc, obs), colour = "firebrick") +
  facet_wrap(~group, scales = "free_x") +
  labs(x = "Dorzagliatin plasma concentration (ng/mL)",
       y = "Reduction in fasting plasma glucose (%)")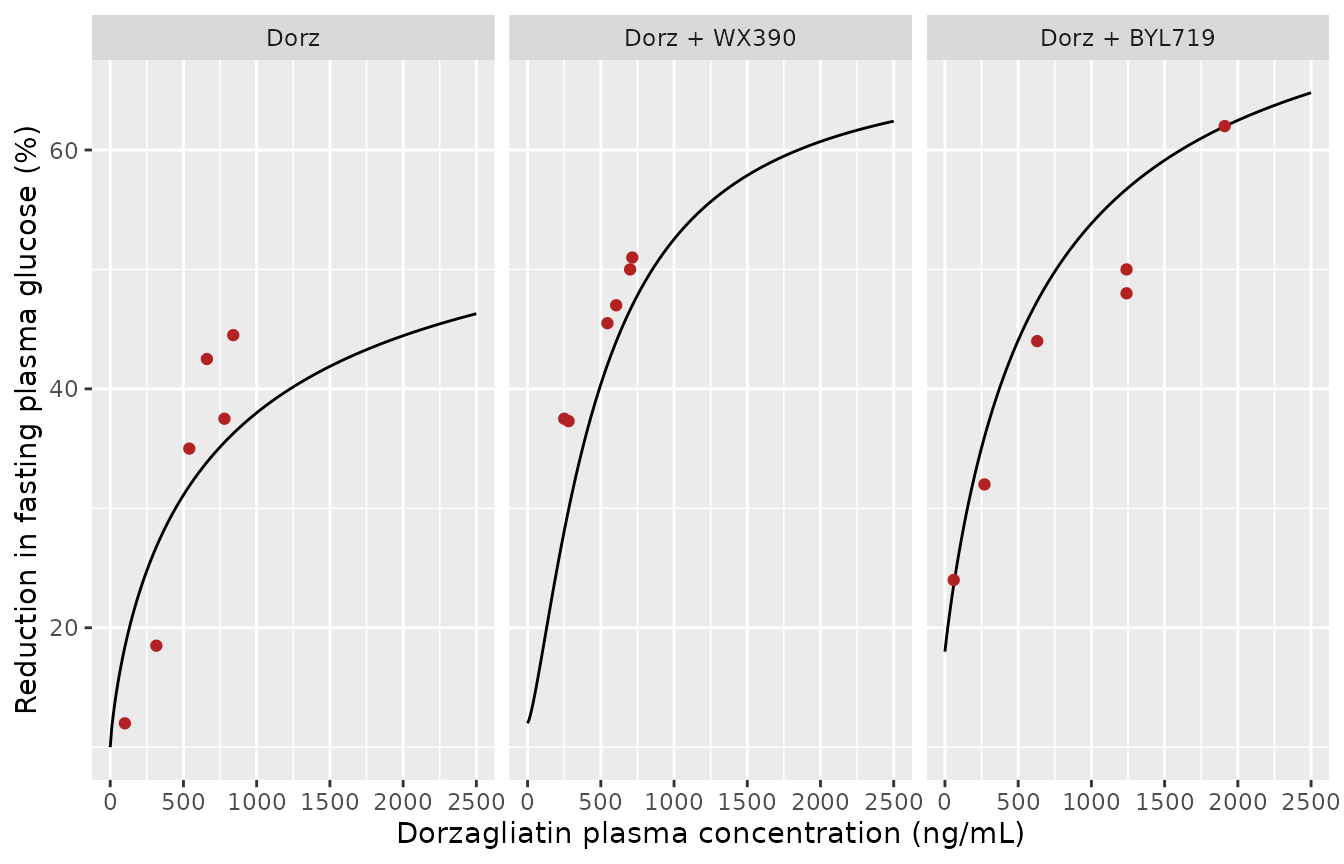
Replicates Figure 6 of Jin 2025. Lines: packaged sigmoid Emax models; points: group means digitised from Figure 6.
agree <- fig6 |>
  group_by(group) |>
  summarise(median_abs_diff = median(abs(pred - obs)),
            max_abs_diff = max(abs(pred - obs)), .groups = "drop")
# The model and the digitised points share no random draw, so this is a fixed
# comparison. A mis-transcribed EC50 or Emax shifts the curve by well over 10
# percentage points across the observed range.
stopifnot(all(agree$median_abs_diff < 10))
agree |>
  dplyr::rename("Group" = group,
                "Median |model - Figure 6| (percentage points)" = median_abs_diff,
                "Max |model - Figure 6| (percentage points)" = max_abs_diff) |>
knitr::kable(digits = 1)| Group | Median |model - Figure 6| (percentage points) | Max |model - Figure 6| (percentage points) |
|---|---|---|
| Dorz | 7.3 | 8.6 |
| Dorz + WX390 | 3.8 | 9.4 |
| Dorz + BYL719 | 3.7 | 8.7 |
The two combination groups track Figure 6 with a median difference of about 4 percentage points. The dorzagliatin-alone curve is flatter than its six points (under-predicting the upper three by about 6-9 points). That is a property of the published parameters: using the 1.10 exponent of the Table 5 numerator in both places does not fit those points better in any material way, and using it only in the numerator is not usable (see above).
Effect of the PI3K inhibitor on the dorzagliatin curve
ggplot(sim, aes(CP_DORZAGLIATIN_NGML, fpg_reduction, colour = group)) +
  geom_line() +
  geom_vline(data = par_tab |> mutate(group = factor(group, levels = group_label)),
             aes(xintercept = ec50, colour = group), linetype = "dashed") +
  labs(x = "Dorzagliatin plasma concentration (ng/mL)",
       y = "Reduction in fasting plasma glucose (%)", colour = NULL)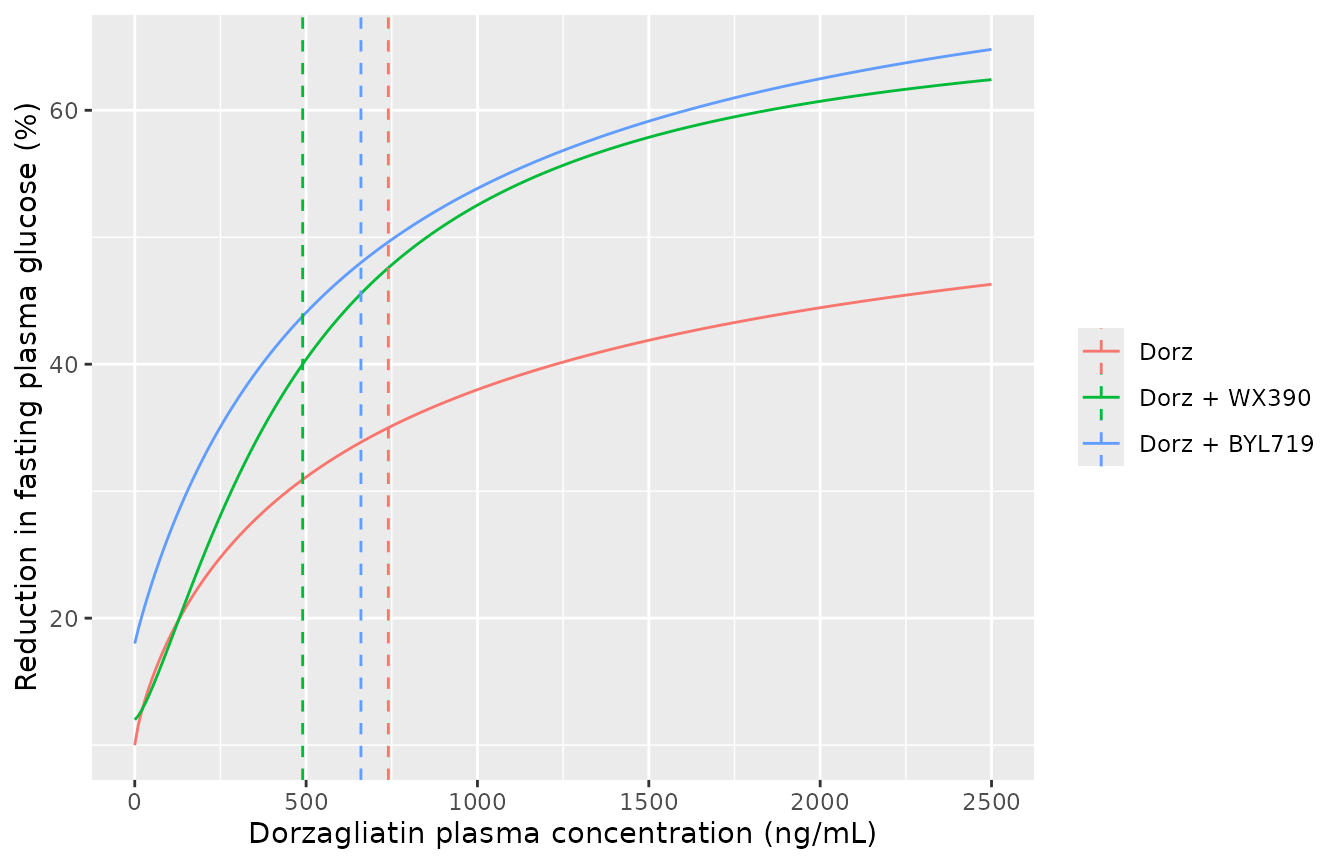
The three packaged curves on one axis: the WX390 combination has the lowest EC50 and steepest curve (Jin 2025 Section 2.5).
PKNCA validation
Not applicable. These are PD-only models with no PK layer: Jin 2025 did not publish the parameters of its dorzagliatin PK model, so there is no simulated concentration-time profile to run a non-compartmental analysis on. The paper’s own NCA results (Table 3) are reproduced below for reference, because they are the concentrations a user would need to supply to drive these models.
tibble::tribble(
  ~Group,          ~Analyte,       ~`t1/2 (h)`, ~`Tmax (h)`, ~`Cmax (ng/mL)`, ~`AUC0-t (ng*h/mL)`,
  "Dorz",          "dorzagliatin",  2.15,        0.50,        1331.00,         3287.90,
  "Dorz + WX390",  "dorzagliatin",  2.93,        0.50,        1776.67,         4657.23,
  "Dorz + BYL719", "dorzagliatin",  1.86,        1.00,        2013.33,         3953.58
) |>
knitr::kable(caption = "Jin 2025 Table 3, dorzagliatin rows (n = 3).")| Group | Analyte | t1/2 (h) | Tmax (h) | Cmax (ng/mL) | AUC0-t (ng*h/mL) |
|---|---|---|---|---|---|
| Dorz | dorzagliatin | 2.15 | 0.5 | 1331.00 | 3287.90 |
| Dorz + WX390 | dorzagliatin | 2.93 | 0.5 | 1776.67 | 4657.23 |
| Dorz + BYL719 | dorzagliatin | 1.86 | 1.0 | 2013.33 | 3953.58 |
Section 2.2 attributes the 41.65% AUC increase to the WX390 group and the 20.25% increase to the BYL719 group, but the Abstract and Section 3.3.1 swap them. Table 3 supports Section 2.2 (4657.23 / 3287.90 = 1.4165 and 3953.58 / 3287.90 = 1.2025). The quoted Cmax increases (33.48% with WX390, 13.32% with BYL719) match Table 3 for WX390 (1776.67 / 1331.00 = 1.3348) but not for BYL719 (2013.33 / 1331.00 = 1.5126).
Assumptions and deviations
-
PD-only packaging. Jin 2025 fitted a
two-compartment, first-order absorption PK model for dorzagliatin in
Phoenix and shows its diagnostics in Figure 7, but no parameter value of
that model is printed in the paper, and the article has no supplement
(data are “available on request” only). The concentration that drives
each curve is therefore an input,
CP_DORZAGLIATIN_NGML. The registered human dorzagliatin modelWang_2023_dorzagliatinis a human population PK model and is not a substitute for the mouse PK. -
Concentration driver. Equation 6 names the driver
Cebut defines it as “the plasma concentration of the drug”, and no equilibration rate constant is reported, so the models use plasma concentration directly with no effect compartment. The concentrations plotted in Figure 6 do not match the observed means of Figure 3 / Table 3 (for example, Figure 6A peaks at about 840 ng/mL while the observed Cmax was 1331 ng/mL), which suggests the authors paired the glucose data with PK-model predictions at the glucose sampling times; the paper does not say so explicitly. - Hill exponent of the dorzagliatin-alone group. 0.80, not the 1.10 printed in the numerator of Table 5 (see Source trace).
- Three separate files. The authors fitted the three groups separately, each with its own AIC (Table 5), and did not estimate a joint model with a PI3K-inhibitor covariate, so each fit is its own file.
- No variability. No between-animal variability or residual error was reported; the models are typical-value only and produce one deterministic curve each.
-
Response definition.
fpg_reductionis the percent reduction relative to the time-matched reference group of Equation 5, not relative to the same animal’s baseline, and it is not zero at zero concentration (E0= 10-18%). - Not packaged. The tumour-growth results (Table 4, Figure 4) are summary statistics (T/C, TGI) with no fitted model, and the WX390 and alpelisib concentrations were analysed by NCA only.