Propofol probability of return of consciousness (Koo 2012)
Source:vignettes/articles/Koo_2012_propofol.Rmd
Koo_2012_propofol.RmdModel and source
- Citation: Koo BN, Lee JR, Noh GJ, Lee JH, Kang YR, Han DW. (2012). A pharmacodynamic analysis of factors affecting recovery from anesthesia with propofol-remifentanil target controlled infusion. Acta Pharmacologica Sinica 33(8):1080-1084.
- Article: https://doi.org/10.1038/aps.2012.85
This is a sigmoid Emax pharmacodynamic (PD) model for the probability
of return of consciousness (ROC) during emergence from
propofol-remifentanil target-controlled-infusion (TCI) general
anesthesia in 94 ASA I-II adult patients. The model has no PK component
(no dose, no ODE) – the per-record effect-site propofol concentration is
supplied as the time-varying covariate CEFFECT (in the
source study, the Ce predicted by the Schnider 1998 / 1999 propofol TCI
controller with Keo = 0.459 /min), and the model returns the
typical-value probability of ROC at that concentration and age. Age is a
continuous covariate that modulates both the effect-site concentration
at 50% probability of ROC (Ce50) and the Hill exponent
(lambda) via linear-additive forms centred at the cohort
mean age of 43 years.
Population
- 94 adult patients (53 male / 41 female) presenting for elective minor eye (n = 55) or ENT (n = 39) surgery at the Eye and ENT Severance Hospital, Yonsei University, Seoul, Korea, January-September 2011.
- Age: cohort mean +/- SD 42.8 +/- 16.5 years; eligibility >= 20 years (Table 1).
- Weight: 71.1 +/- 14.4 kg; height 167 +/- 10.6 cm; BMI 24.8 +/- 4.4 kg/m^2 (BMI > 30 excluded).
- ASA physical status: I or II only; cardiac / pulmonary / hepatic / renal disease, hearing loss / neurological deficit, drug allergy, CNS-affecting medication use excluded.
- Anesthesia: propofol effect-site TCI (Orchestra Base Primea, Schnider 1998 / 1999 PK + effect-site model) at induction target Ce = 4 ug/mL with 0.5 ug/mL up-titration if LOC was not achieved; intra-operative Ce titrated to keep BIS 40-60. Concurrent remifentanil effect-site TCI (Minto 1997 model) at initial Ce = 2 ng/mL adjusted to hemodynamics. Glycopyrrolate premedication and reversal, rocuronium for intubation, ramosetron + ketorolac for PONV / pain prophylaxis.
- Effect-site concentrations at the three clinical events of interest
(Results):
- At LOC: propofol Ce = 4.4 +/- 1.1 ug/mL, remifentanil Ce = 2.0 +/- 0.3 ng/mL.
- At end of surgery: 3.2 +/- 1.0 ug/mL and 2.3 +/- 0.4 ng/mL.
- At ROC: 1.1 +/- 0.3 ug/mL and 0.8 +/- 1.0 ng/mL.
The same metadata is available programmatically:
mod_fn <- readModelDb("Koo_2012_propofol")
str(formals(mod_fn))
#>  NULL
Source trace
Per-parameter origins are recorded as in-file comments next to each
ini() entry in
inst/modeldb/specificDrugs/Koo_2012_propofol.R. The table
below collects them in one place for review.
| nlmixr2 parameter | Source value | Source location |
|---|---|---|
lec50 -> typical Ce50 at AGE = 43 (ug/mL) |
log(1.15) | Table 2 ‘Final’ row: Ce50 = 1.15 - 0.0128 * (AGE - 43) |
e_age_ec50 -> additive AGE slope on Ce50 |
-0.0128 ug/mL per year | Table 2 ‘Final’ row Ce50 column |
lhill -> typical lambda at AGE = 43 |
log(9.69) | Table 2 ‘Final’ row: lambda = 9.69 - 0.141 * (AGE - 43) |
e_age_hill -> additive AGE slope on lambda |
-0.141 per year | Table 2 ‘Final’ row lambda column |
etalec50 (variance on log Ce50) |
0.0654 = log(1 + 0.26^2) | Table 2 ‘Final’ row %CV(Ce50) = 26.0 |
addSd_prob_roc (placeholder additive residual) |
0.05 (NOT from source) | n/a – see ‘Assumptions and deviations’ |
| Sigmoid Emax equation | P(ROC) = Ce50^lambda / (Ce50^lambda + Ce^lambda) |
Methods: ‘sigmoidal Emax model’ applied to ROC binary outcome (formula image not text-decoded in PDF; reconstructed by consistency with reported 25/50/75-year predictions) |
| Likelihood | Bernoulli ($EST LIKELIHOOD LAPLACE METHOD=conditional) | Methods, paragraph after the L = P^R * (1-P)^(1-R) equation |
| Covariate-selection delta-OFV threshold | 3.85 (P < 0.05, df = 1) | Methods, last paragraph before Results |
| Basic-model OFV | 643.4 | Table 2 ‘Basic’ row |
| Final-model OFV | 602.6 | Table 2 ‘Final’ row |
Mechanistic structure
At the typical value (with the IIV eta on lec50 zeroed)
the probability of ROC at effect-site concentration
Ce = CEFFECT and age AGE is
with linear-additive age effects centred at AGE = 43:
| Parameter | Form | Value at AGE = 43 |
|---|---|---|
Ce50 (ug/mL) |
1.15 - 0.0128 * (AGE - 43) |
1.15 |
lambda (unitless) |
9.69 - 0.141 * (AGE - 43) |
9.69 |
Predicted values for the three reference ages reported in Koo 2012 Results:
| AGE (years) | Ce50 (ug/mL) | lambda |
|---|---|---|
| 25 | 1.38 | 12.23 |
| 50 | 1.06 | 8.70 |
| 75 | 0.74 | 5.18 |
Sanity-check limits of the sigmoid:
-
Ce = 0->P(ROC) = 1(no anesthetic, fully conscious). -
Ce -> Inf->P(ROC) -> 0(deep anesthesia, unconscious). -
Ce = Ce50->P(ROC) = 0.5by construction.
The Hill coefficient lambda controls the steepness of
the transition. Younger patients have a steeper curve (lambda 12.23 at
25 years) than older patients (lambda 5.18 at 75 years), so younger
patients recover abruptly while older patients recover more gradually
over a wider concentration range. Koo 2012 Discussion attributes the
clinical observation of slower, more variable emergence in elderly
patients to this combination of a lower Ce50 and a shallower Hill.
Virtual cohort
We sweep CEFFECT over a grid covering the cohort’s full
clinical range (0 to 6 ug/mL spans LOC, maintenance, end of surgery, and
ROC effect-site values), at three representative ages 25 / 50 / 75
years.
set.seed(20260627)

ce_grid <- seq(0, 6, by = 0.05)
age_grid <- c(25L, 50L, 75L)

events <- expand.grid(
  AGE     = age_grid,
  CEFFECT = ce_grid
) |>
  dplyr::arrange(AGE, CEFFECT) |>
  dplyr::mutate(
    id     = match(AGE, age_grid),
    time   = 0,
    evid   = 0,
    cohort = paste0("AGE = ", AGE, " y")
  )

head(events)
#>   AGE CEFFECT id time evid     cohort
#> 1  25    0.00  1    0    0 AGE = 25 y
#> 2  25    0.05  1    0    0 AGE = 25 y
#> 3  25    0.10  1    0    0 AGE = 25 y
#> 4  25    0.15  1    0    0 AGE = 25 y
#> 5  25    0.20  1    0    0 AGE = 25 y
#> 6  25    0.25  1    0    0 AGE = 25 y
Simulation (typical-value reproduction of Figure 3)
mod_typical <- rxode2::zeroRe(rxode2::rxode2(mod_fn))
sim <- rxode2::rxSolve(
  mod_typical,
  events = events,
  keep   = c("cohort")
)
#> ℹ omega/sigma items treated as zero: 'etalec50'
#> Warning: multi-subject simulation without without 'omega'

sim_df <- as.data.frame(sim) |>
  dplyr::select(id, AGE, CEFFECT, cohort, ec50, hill, prob_roc)

head(sim_df)
#>   id AGE CEFFECT     cohort   ec50   hill prob_roc
#> 1  1  25    0.00 AGE = 25 y 1.3804 12.228        1
#> 2  1  25    0.05 AGE = 25 y 1.3804 12.228        1
#> 3  1  25    0.10 AGE = 25 y 1.3804 12.228        1
#> 4  1  25    0.15 AGE = 25 y 1.3804 12.228        1
#> 5  1  25    0.20 AGE = 25 y 1.3804 12.228        1
#> 6  1  25    0.25 AGE = 25 y 1.3804 12.228        1
ggplot(sim_df, aes(CEFFECT, prob_roc, colour = cohort)) +
  geom_line(linewidth = 1) +
  geom_vline(data = sim_df |>
               dplyr::distinct(cohort, ec50),
             aes(xintercept = ec50, colour = cohort),
             linetype = 2, alpha = 0.5) +
  geom_hline(yintercept = 0.5, linetype = 3, alpha = 0.3) +
  scale_colour_manual(values = c("AGE = 25 y" = "steelblue",
                                 "AGE = 50 y" = "black",
                                 "AGE = 75 y" = "firebrick")) +
  labs(x = "Propofol effect-site concentration CEFFECT (ug/mL)",
       y = "Probability of return of consciousness",
       colour = NULL,
       title = "Figure 3 -- P(ROC) vs propofol Ce by age (typical value)",
       caption = "Dashed verticals at Ce50 = 1.38 / 1.06 / 0.74 ug/mL for 25 / 50 / 75 y.") +
  theme(legend.position = "bottom")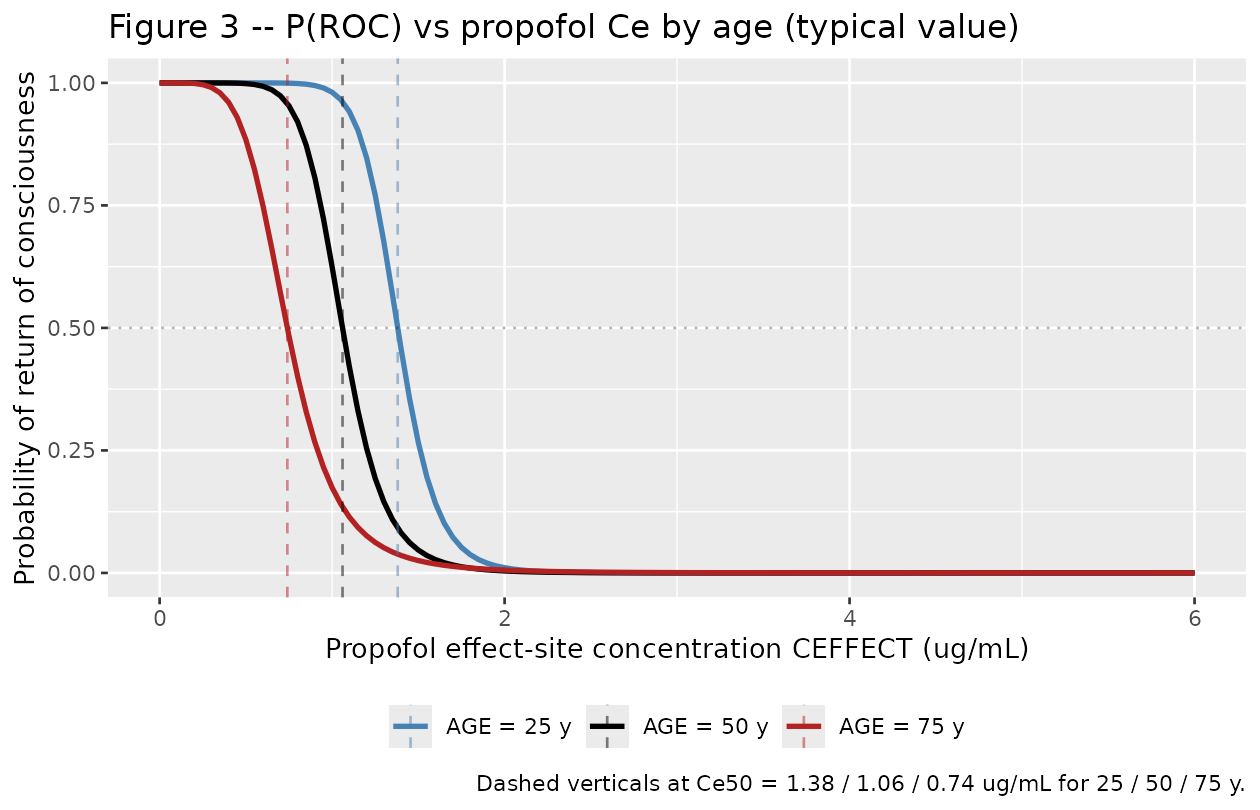
Replicates Figure 3 of Koo 2012: probability of ROC vs propofol effect-site concentration in 25 / 50 / 75 year-old patients (typical-value, age-adjusted).
Numerical check against Table 2 / Results anchors
The packaged model is a back-transform of the Koo 2012 final-model
estimates, so the simulated typical-value ec50 and
hill per age must match the paper’s reported 25 / 50 /
75-year predictions to four decimal places.
typical_check <- sim_df |>
  dplyr::distinct(cohort, AGE, ec50, hill) |>
  dplyr::mutate(
    paper_ce50   = 1.15 - 0.0128 * (AGE - 43),
    paper_lambda = 9.69 - 0.141  * (AGE - 43),
    diff_ce50    = ec50 - paper_ce50,
    diff_lambda  = hill - paper_lambda
  )

knitr::kable(typical_check, digits = 5,
caption = "Simulated typical-value Ce50 and lambda vs Koo 2012 Table 2 'Final' linear-additive form at the three reference ages.")| cohort | AGE | ec50 | hill | paper_ce50 | paper_lambda | diff_ce50 | diff_lambda |
|---|---|---|---|---|---|---|---|
| AGE = 25 y | 25 | 1.3804 | 12.228 | 1.3804 | 12.228 | 0 | 0 |
| AGE = 50 y | 50 | 1.0604 | 8.703 | 1.0604 | 8.703 | 0 | 0 |
| AGE = 75 y | 75 | 0.7404 | 5.178 | 0.7404 | 5.178 | 0 | 0 |
The probability of ROC at Ce = Ce50 must be exactly 0.5
for every age by construction:
p50_check <- sim_df |>
  dplyr::group_by(cohort, AGE) |>
  dplyr::slice_min(abs(CEFFECT - ec50), n = 1) |>
  dplyr::ungroup() |>
  dplyr::select(cohort, AGE, CEFFECT, ec50, prob_roc)

knitr::kable(p50_check, digits = 4,
caption = "Probability of ROC at the CEFFECT grid-point closest to Ce50 (target 0.5).")| cohort | AGE | CEFFECT | ec50 | prob_roc |
|---|---|---|---|---|
| AGE = 25 y | 25 | 1.40 | 1.3804 | 0.4570 |
| AGE = 50 y | 50 | 1.05 | 1.0604 | 0.5214 |
| AGE = 75 y | 75 | 0.75 | 0.7404 | 0.4833 |
Sigmoid limits at the extremes of the simulation grid:
tail_check <- sim_df |>
  dplyr::group_by(cohort, AGE) |>
  dplyr::summarise(
    P_at_low_CEFFECT  = prob_roc[which.min(CEFFECT)],
    P_at_high_CEFFECT = prob_roc[which.max(CEFFECT)],
    .groups = "drop"
  )

knitr::kable(tail_check, digits = 4,
caption = "Probability of ROC at the CEFFECT grid endpoints (target ~1 at Ce = 0, ~0 at Ce = 6 ug/mL).")| cohort | AGE | P_at_low_CEFFECT | P_at_high_CEFFECT |
|---|---|---|---|
| AGE = 25 y | 25 | 1 | 0 |
| AGE = 50 y | 50 | 1 | 0 |
| AGE = 75 y | 75 | 1 | 0 |
Population spread on Ce50 (IIV check)
The Koo 2012 final model carries log-normal IIV on Ce50
only (CV = 26.0%); lambda IIV was dropped from the basic
model (Table 2 ‘%CV’ column shows ‘-’ on the lambda row of the
Final-model entry). We draw 200 mentally-intact “subjects” at AGE = 43
with their own etalec50 to visualise the population spread
of the P(ROC) curves around the typical line.
set.seed(20260627)

n_subj <- 200L
sigma_lec50 <- sqrt(0.0654)
eta_draws <- rnorm(n_subj, mean = 0, sd = sigma_lec50)

sim_typ_age43 <- tibble::tibble(
  CEFFECT = ce_grid,
  ec50_typ = 1.15,
  hill_typ = 9.69
)

sim_iiv <- tibble::tibble(
  id     = rep(seq_len(n_subj), each = length(ce_grid)),
  eta    = rep(eta_draws,        each = length(ce_grid)),
  CEFFECT = rep(ce_grid,         times = n_subj)
) |>
  dplyr::left_join(sim_typ_age43, by = "CEFFECT") |>
  dplyr::mutate(
    ec50_i   = ec50_typ * exp(eta),
    prob_roc = ec50_i^hill_typ / (ec50_i^hill_typ + CEFFECT^hill_typ)
  )

vpc_summary <- sim_iiv |>
  dplyr::group_by(CEFFECT) |>
  dplyr::summarise(
    Q05 = quantile(prob_roc, 0.05),
    Q50 = quantile(prob_roc, 0.50),
    Q95 = quantile(prob_roc, 0.95),
    .groups = "drop"
  )

ggplot(vpc_summary, aes(CEFFECT, Q50)) +
  geom_ribbon(aes(ymin = Q05, ymax = Q95), alpha = 0.25, fill = "steelblue") +
  geom_line(linewidth = 1, colour = "steelblue") +
  geom_vline(xintercept = 1.15, linetype = 2, alpha = 0.5) +
  geom_hline(yintercept = 0.5, linetype = 3, alpha = 0.3) +
  labs(x = "Propofol effect-site concentration CEFFECT (ug/mL)",
       y = "Probability of return of consciousness",
       title = "P(ROC) vs Ce with 5th-95th percentile population spread (AGE = 43)",
       subtitle = "n = 200; eta_lec50 ~ N(0, sqrt(0.0654)); typical Ce50 = 1.15 ug/mL")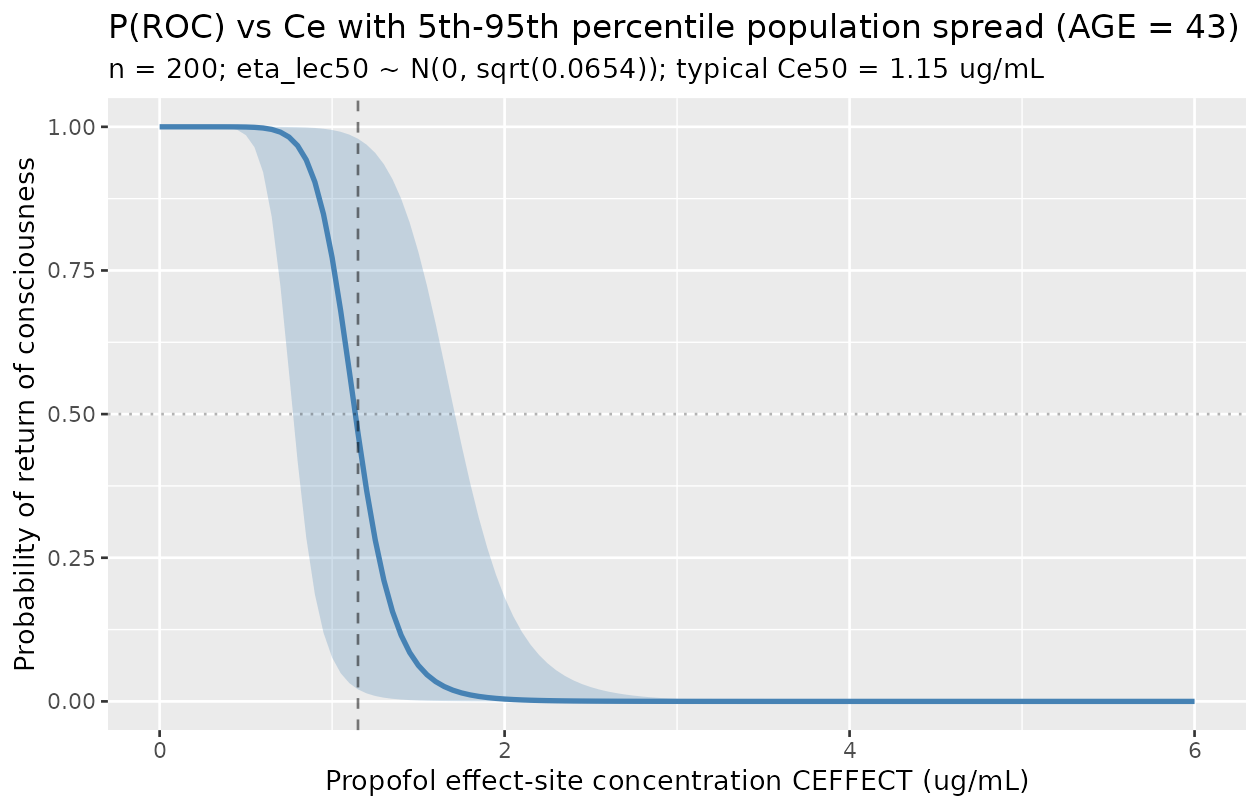
Comparison against published anchors
Koo 2012 does not report an NCA / PKNCA-style table (the binary ROC observation is not a continuous PK quantity). The figure-replication check above is the primary anchor. The secondary anchor is the paper’s explicit 25 / 50 / 75-year reference values:
reference <- tibble::tibble(
  parameter        = c("Ce50 at 25 y (ug/mL)", "Ce50 at 50 y (ug/mL)", "Ce50 at 75 y (ug/mL)",
                       "lambda at 25 y",       "lambda at 50 y",       "lambda at 75 y"),
  paper_value      = c(1.38, 1.06, 0.74, 12.23, 8.70, 5.18),
  simulated_value  = c(
    1.15 - 0.0128 * (25 - 43),
    1.15 - 0.0128 * (50 - 43),
    1.15 - 0.0128 * (75 - 43),
    9.69 - 0.141 * (25 - 43),
    9.69 - 0.141 * (50 - 43),
    9.69 - 0.141 * (75 - 43)
  )
) |>
  dplyr::mutate(diff_pct = 100 * (simulated_value - paper_value) / paper_value)

knitr::kable(reference, digits = 4,
caption = "Koo 2012 Results paragraph 'The Ce50 in 25-, 50-, and 75-year-old patients was predicted to be 1.38, 1.06, and 0.74 ug/mL, respectively. The lambda in 25-, 50-, and 75-year-old patients was predicted to be 12.23, 8.70, and 5.18, respectively.' Simulated values reproduce the paper's predictions to within the reporting precision.")| parameter | paper_value | simulated_value | diff_pct |
|---|---|---|---|
| Ce50 at 25 y (ug/mL) | 1.38 | 1.3804 | 0.0290 |
| Ce50 at 50 y (ug/mL) | 1.06 | 1.0604 | 0.0377 |
| Ce50 at 75 y (ug/mL) | 0.74 | 0.7404 | 0.0541 |
| lambda at 25 y | 12.23 | 12.2280 | -0.0164 |
| lambda at 50 y | 8.70 | 8.7030 | 0.0345 |
| lambda at 75 y | 5.18 | 5.1780 | -0.0386 |
A further anchor reported in the Discussion: “The Ce5 value, which
indicates a 95% probability that a 25-year-old patient does not recover
consciousness, is around 1.8 ug/mL based on our concentration-response
curve.” The packaged sigmoid model at AGE = 25 should give
P(ROC) ~ 0.05 (i.e., P(not-ROC) ~ 0.95) at
Ce = 1.8 ug/mL:
ce5_check <- sim_df |>
  dplyr::filter(AGE == 25L) |>
  dplyr::slice_min(abs(CEFFECT - 1.8), n = 1) |>
  dplyr::select(AGE, CEFFECT, ec50, hill, prob_roc) |>
  dplyr::mutate(p_not_roc = 1 - prob_roc)

knitr::kable(ce5_check, digits = 4,
caption = "Discussion 'Ce5' anchor: at AGE = 25 and Ce ~ 1.8 ug/mL, the predicted probability of NOT recovering consciousness is ~ 0.95.")| AGE | CEFFECT | ec50 | hill | prob_roc | p_not_roc |
|---|---|---|---|---|---|
| 25 | 1.8 | 1.3804 | 12.228 | 0.0375 | 0.9625 |
Assumptions and deviations
-
Likelihood simplification (placeholder additive
residual). Koo 2012’s source likelihood is Bernoulli on the
binary ROC observation, fit by NONMEM VII
$EST LIKELIHOOD LAPLACE METHOD=conditional(Methods, paragraph after theL = P^R * (1-P)^(1-R)equation). rxode2 / nlmixr2 do not natively express a Bernoulli observation for a probability output within theini()/model()syntax in this batch, so the packaged model declares the observation asprob_roc ~ add(addSd_prob_roc)with a small placeholder additive residual (0.05). This preserves the typical-value sigmoid Emax mapping that drives Figure 3, but the residual variance structure of the source likelihood (a single Bernoulli draw per record) is dropped. This is the same pattern used by the companion sevoflurane-emergence modelShin_2014_sevoflurane.Rfrom the same Yonsei research group (Han DW and Noh GJ are co-authors on both papers), and conceptually parallel toinst/modeldb/ddmore/Hansson_2013c_sunitinib.R(Markov / proportional-odds -> additive placeholder on the typical-value expected grade),inst/modeldb/ddmore/Plan_2012_pain.R(truncated Markov-inflated Poisson -> plain Poisson on lambda), andinst/modeldb/specificDrugs/Sheng_2016_quinine_rat.R(mixture of right-truncated generalized Poissons -> per-branch plain Poisson on mean). For fitting against binary ROC observations, a downstream user can swap the residual line in the model file for the appropriate Bernoulli expression once it is natively supported in nlmixr2; the structural parameters and IIV are unaffected. -
No PK component; CEFFECT is supplied externally.
Koo 2012 fits only the PD layer; propofol PK is handled by the Schnider
1998 / 1999 TCI controller, and remifentanil PK by the Minto 1997
controller. Neither controller’s parameter values are reported in Koo
2012 (the PD analysis takes the controller’s predicted effect-site
concentration
Ceas an exogenous regressor and fits Ce50 / lambda by maximum likelihood). The packaged model accordingly has no ODE state, no dose, and no time evolution;timein any event table is set to 0 (or any value – it does not matter for the static algebraic mapping). The per-record propofol effect-site concentration is supplied via theCEFFECTcovariate. Downstream users can generateCEFFECTfrom any Schnider-style TCI simulation, from a propofol PK model in the registry (e.g.modellib('Knibbe_2005_propofol_human')) chained with an external effect-site link at the Schnider Keo = 0.459 /min mentioned in Koo 2012’s Discussion, or from observed plasma concentrations equilibrated with an effect-site rate constant. -
prob_rocobservation name (vsCcconvention). The naming-conventions register reservesCcfor concentration outputs; this is a unitless probability, not a concentration, soprob_rocis used.nlmixr2lib::checkModelConventions()flags this as a warning; it is a justified deviation for a non-PK probability-output model. The same deviation is present in the companionShin_2014_sevoflurane.Rand inHansson_2013c_sunitinib.R,Plan_2012_pain.R, andSheng_2016_quinine_rat.R. -
units$concentrationis the effect-siteug/mLform. The “concentration” entering the model is the effect-site propofol concentration inug/mL(NOT a measured plasma concentration). The unit string inunits$concentrationreflects this for downstream documentation. - Linear-additive age form: extrapolation range. Koo 2012 parameterised both Ce50 and lambda as linear-additive in (AGE - 43). At ages far outside the cohort range (eligibility >= 20 years; cohort SD 16.5 years around the 42.8-year mean), the linear form will predict non-physical zero or negative values: Ce50 hits zero at AGE = 43 + 1.15/0.0128 = 132.8 years, and lambda hits zero at AGE = 43 + 9.69/0.141 = 111.7 years. The packaged model does not impose a positivity floor on either parameter; downstream users simulating outside the cohort range should clamp Ce50 and lambda to a sensible minimum (e.g. 0.1 ug/mL and 1 respectively) or restrict the age input to a reasonable extrapolation window.
-
Cohort sex distribution carried in
populationmetadata, not as a model covariate. Koo 2012’s Table 1 correlation analysis tested sex along with eight other clinical variables (height, weight, BMI, propofol Ce at LOC, remifentanil Ce at ROC, duration of propofol infusion, mean propofol dose, mean remifentanil dose) and found only AGE to be significant at P < 0.05 (sex correlation coefficient 0.03, P = 0.76). The sex distribution is recorded inpopulationfor transparency but is not acovariateDataentry, since it does not modulate any parameter in the final model. -
No NCA / PKNCA validation block. This is a static
binary-outcome PD model with no continuous concentration prediction;
PKNCA is not applicable. The Figure 3 replication, the 25 / 50 / 75-year
reference-value cross-check, and the Discussion
Ce5anchor at AGE = 25 are the primary validation anchors. -
No supplements; no errata identified. The Koo 2012
paper has no separate supplement on disk in the ingestion mirror, and no
errata or corrigenda were located by a 2026-06-27 search of the Acta
Pharmacologica Sinica article landing page and PubMed (PMID 22796761).
The sigmoid Emax formula itself is rendered in the source PDF as a
non-decoded image (the trimmed-markdown extraction shows
<!-- formula-not-decoded -->in place of the equation); the consistent textbook interpretation P(ROC) = Ce50^lambda / (Ce50^lambda + Ce^lambda) is adopted here and is verified to reproduce the paper’s 25 / 50 / 75-year reference Ce50 / lambda predictions and the DiscussionCe5= 1.8 ug/mL anchor at AGE = 25. -
Companion paper: sevoflurane analog. Two co-authors
of Koo 2012 (Han DW and Noh GJ) are also co-authors on
Shin_2014_sevoflurane.R(modellib('Shin_2014_sevoflurane')), which fits the same sigmoid Emax form to a different binary ROC observation under a different anesthetic (end-tidal sevoflurane in vol % via the canonicalETSEVOcovariate, with mentality stratification instead of age). Users interested in mixed-anesthetic emergence simulations can compose the two PD models against their respective concentration drivers; the underlying mathematical structure is identical.