Pacmilimab conditionally activated anti-PD-L1 NSCLC QSP (Ippolito 2024b)
Source:vignettes/articles/Ippolito_2024b_pacmilimab_qsp.Rmd
Ippolito_2024b_pacmilimab_qsp.RmdModel and source
# built once and reused throughout (a 231-state model)
mod <- rxode2::rxode2(readModelDb("Ippolito_2024b_pacmilimab_qsp"))
length(mod$state)
#> [1] 231- Citation: Ippolito A, Wang H, Zhang Y, Vakil V, Popel AS. Virtual clinical trials via a QSP immuno-oncology model to simulate the response to a conditionally activated PD-L1 targeting antibody in NSCLC. J Pharmacokinet Pharmacodyn. 2024;51(6):747-757. doi:10.1007/s10928-024-09928-5. Model structure and every value from the paper’s Supplementary Material 2 (the SimBiology export of the model).
- Article: https://doi.org/10.1007/s10928-024-09928-5
- Supplementary Material 1 (methods, Eqs S1-S18, Figures S1-S3) and Supplementary Material 2 (the SimBiology export of the model: Parameters, Reactions, Rules, Species and Compartments sheets) of the article
Pacmilimab (CX-072) is a PROBODY therapeutic: an anti-PD-L1 antibody
whose two active sites are each covered by a mask tethered by a
protease-cleavable linker. The mask shifts reversibly to reveal a site
(equilibrium constant K_m, the open/closed ratio of one
site), and tumour-associated proteases remove it irreversibly (rate
k_cvg in the tumour, 1% of that elsewhere). This paper
takes the QSP immuno-oncology platform the Popel laboratory calibrated
to advanced non-small cell lung cancer (NSCLC; Wang 2023, npj Precision
Oncology), adds the PROBODY kinetics and out-of-synapse PD-L1 of the
authors’ earlier triple-negative breast cancer study
(Ippolito_2024_pacmilimab_qsp), shifts the tumour cleavage
rate to NSCLC protease activity, and runs a prospective virtual trial of
10 mg/kg every two weeks for 400 days against the unmasked antibody.
This is a deterministic mechanism model. Virtual patients are drawn by Latin hypercube sampling of parameter distributions that the paper does not tabulate, so there are no etas and no residual error, and everything below is a typical-value simulation at the values of Supplementary Material 2.
Population
| Field | Value |
|---|---|
| species | human (in silico virtual cohort) |
| n_subjects | 460 |
| disease_state | non-small cell lung cancer |
| dose_range | Pacmilimab 10 mg/kg every 2 weeks for 400 days, the TNBC phase I regimen applied prospectively to NSCLC; the unmasked anti-PD-L1 antibody (atezolizumab-like) at the same dose and schedule is the reference arm. |
| notes | 20,000 proposed patients drawn by Latin hypercube sampling and grown from a single cancer cell; plausible patients whose tumours reach the 3.7 cm pre-treatment diameter were then selected against the iAtlas NSCLC distributions of three bounded immune-subset fractions, M1/(M1+M2), Treg/(Treg+CD8) and CD4/(CD4+CD8), leaving 460 virtual patients. A further ten 20,000-patient cohorts restrict the T cell clone number to successive deciles of its distribution. No clinical trial of pacmilimab in NSCLC exists; the comparison anchor is the 18% response rate of anti-PD-L1 therapy. |
Twenty thousand proposed patients were grown from a single cancer
cell; those whose tumours reached a plausible 3.7 cm pre-treatment
diameter were kept, and a probability of inclusion built from the iAtlas
NSCLC distributions of three bounded immune-subset fractions,
M1/(M1+M2), Treg/(Treg+CD8) and
CD4/(CD4+CD8) (main-text Eqs 1a-1c), selected 460 virtual
patients. There is no clinical trial of pacmilimab in NSCLC; the paper
compares its simulated response rate of about 16% with the 18% reported
for unmasked anti-PD-L1 therapy.
Model structure
| Layer | Content |
|---|---|
| Physiological compartments | central (V_C), peripheral (V_P), tumour
(V_T, volume from its cell content), tumour-draining lymph
node (V_LN) |
| Antigen presentation | APC endosome (V_e), endosomal and cell-surface MHC
(A_e, A_s) |
| Synapses | T cell-cancer cell (syn_T_C1), T cell-APC
(syn_T_APC), macrophage-cancer cell
(syn_M_C) |
| Out-of-synapse | PD-L1 on cancer cells (nonsyn_C1_T) and APCs
(nonsyn_APC_LN) |
| Cells | cancer cells (live and dead), naive and activated CD8 T cells
(T1), regulatory T cells (T0), helper T cells
(Th), exhausted CD8 and CD4 T cells, APC and mature APC,
MDSC, M1 and M2 macrophages |
| Mediators | IL-2, IL-10, IL-12, IFN-gamma, TGF-beta, CCL2, nitric oxide, arginase-I |
| Checkpoints | PD-1/PD-L1/PD-L2, CTLA-4/CD28/CD80/CD86, CD47/SIRP-alpha |
| PROBODY anti-PD-L1 | six free states in each of V_C, V_P,
V_T, V_LN; nine bound states per PD-L1 pool
(cancer cell or APC PD-L1, and T cell PD-L1) in each T-cell synapse |
| Dormant modules | anti-PD-1 and anti-CTLA-4 antibodies with the same mask kinetics, never dosed in the paper |
States are integrated as amounts
(q_<compartment>_<species>, in nmol, molecules
or cells) and the declared-unit value is derived as
x_<compartment>_<species>, as SimBiology does
internally. Cell counts are molecule counts dimensionally (the platform
declares the unit cell as molecule), which is
what makes the per-cell secretion constants consistent; the Avogadro
constant NAVG_nmol bridges nanomole-denominated binding
constants and molecule-denominated surface densities.
The free antibody states are named for the two sites, c
closed (masked), o open, and a cleaved site dropping its
letter:
| Model state | Figure S3 label | Sites |
|---|---|---|
aPDL1cc |
cc | both masked (the injected pacmilimab) |
aPDL1co |
co | one masked, one open |
aPDL1oo |
oo | both open |
aPDL1c |
mc | one cleaved, one masked |
aPDL1o |
mo | one cleaved, one open |
aPDL1 |
mm | both cleaved (the unmasked antibody) |
The paper counts as active any molecule with at
least one site revealed, whether open or cleaved: every state except
aPDL1cc.
Source trace
| Model element | Source (Supplementary Material 2 unless stated) |
|---|---|
| Compartment capacities | Compartments sheet |
| All 225 parameter values, in their original units | Parameters sheet (each ini() line quotes the row) |
| Tumour growth, death and dead-cell clearance | Reactions 1-5, 59, 497 |
| Naive and activated CD8, Treg and helper T cells, IL-2 | Reactions 6-57, 443-457 |
| Antigen release, uptake, processing, MHC presentation | Reactions 60-88 |
| Anti-PD-L1 transport, lymphatic drainage, clearance | Reactions 89-124, 161-166 |
| Anti-PD-L1 unmasking and cleavage | Reactions 125-160 |
| Anti-PD-L1 synaptic binding (T cell-cancer cell, T cell-APC, macrophage-cancer cell) | Reactions 311-350, 375-414, 493-494 |
| PD-L1/PD-L2 expression, checkpoint binding | Reactions 351-374, 415-442, 484-496 |
| MDSC, cytokines, macrophages, phagocytosis | Reactions 458-483, 497 |
| Dormant anti-PD-1 and anti-CTLA-4 modules | Reactions 167-310, 357-358, 369-370, 421-422, 433-434, 491-492 |
| Tumour volume, totals, Hill terms, T cell generations | Rules sheet, repeated assignments |
| Initial surface densities | Rules sheet, initial assignments |
| Initial cell counts and concentrations | Species sheet |
Units cell = molecule and mU =
mole/litre |
the platform’s MATLAB code
(immune_oncology_model_NSCLC.m, popellab QSPIO), which the
export does not state |
| Spherical tumour for RECIST diameters; cleavage outside the tumour at 1% | Supplementary Material 1, “Model implementation” |
| Pre-treatment diameter 3.7 cm; 10 mg/kg every 2 weeks for 400 days | Parameters sheet (initial_tumour_diameter); main text,
Results |
| Antibody molar mass 145 kDa and body weight 70 kg | not reported; see Assumptions and deviations |
MW <- 145000 # g/mol (not reported; see Assumptions and deviations)
WT <- 70 # kg (not reported)
nmol_of <- function(mgkg) mgkg * WT / MW * 1e6
dose10 <- nmol_of(10)
SOLVE <- list(atol = 1e-9, rtol = 1e-6, maxsteps = 1e6)
solv <- function(...) {
  do.call(
    rxode2::rxSolve,
    c(list(mod, ...), SOLVE, list(returnType = "data.frame"))
  )
}
FREE <- c("aPDL1cc", "aPDL1co", "aPDL1oo", "aPDL1c", "aPDL1o", "aPDL1")
LABEL <- c(
  aPDL1cc = "cc", aPDL1co = "co", aPDL1oo = "oo",
  aPDL1c = "mc", aPDL1o = "mo", aPDL1 = "mm"
)
ACTIVE <- setdiff(FREE, "aPDL1cc")
TISSUE <- c(V_C = "Serum", V_T = "Tumour", V_P = "Tissue")
q2w <- function(cmt) {
  rxode2::et(amt = dose10, time = 0, cmt = cmt, ii = 14, addl = 28)
}
Initialisation: untreated tumour growth
Each virtual patient is grown from a single cancer cell until the tumour reaches the pre-treatment diameter, 3.7 cm for NSCLC, and that state starts the trial.
grow <- solv(rxode2::et(seq(0, 6000, by = 5)))
i_start <- which(grow$tumour_diameter >= 3.7)[1]
day_start <- grow$time[i_start]
day_start
#> [1] 3320
grow$tumour_diameter[i_start]
#> [1] 3.717388
inits <- unlist(grow[i_start, mod$state])
names(inits) <- mod$state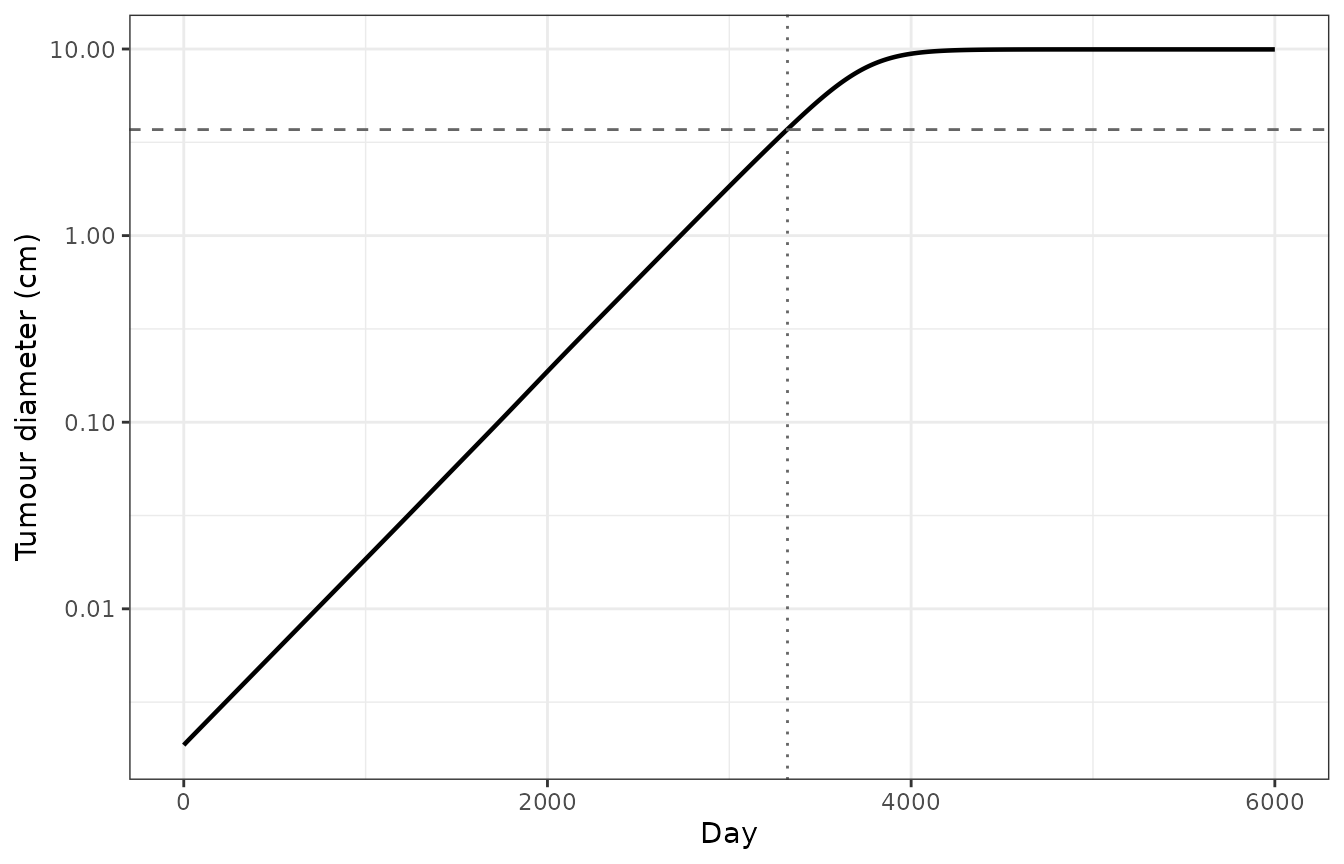
Untreated logistic growth of the typical patient from a single cancer cell to the 3.7 cm pre-treatment diameter.
| Quantity | Value |
|---|---|
| M1/(M1+M2) | 0.2152 |
| Treg/(Treg+CD8) | 0.2650 |
| CD4/(CD4+CD8) | 0.7247 |
| H_PD1_C1 | 0.9988 |
| H_CD28_APC | 0.9560 |
| H_P1 | 0.5058 |
| H_MDSC | 0.2580 |
Structural checks
Free antibody is conserved. Unmasking and cleavage only move antibody between the six free states, and transport only moves it between compartments; synaptic binding reads the free concentration without consuming it (the paper’s assumption of an abundance of antibody relative to the cell surface). With both central clearances switched off, the free antibody summed over the six states and four compartments must therefore stay equal to the dose. This tests every transport, drainage, unmasking and cleavage term and the scaling of each by its compartment, including the growing tumour.
grid84 <- seq(0, 84, by = 0.5)
ev1 <- rxode2::add.sampling(
  rxode2::et(amt = dose10, time = 0, cmt = "q_V_C_aPDL1cc"), grid84
)
cons <- solv(ev1, inits = inits, params = c(k_cl_aPDL1 = 0, k_cln_aPDL1 = 0))
free_amt <- rowSums(cons[, as.vector(outer(
  c("V_C", "V_P", "V_T", "V_LN"), FREE,
  function(a, b) paste0("q_", a, "_", b)
))])
max(abs(free_amt / dose10 - 1))
#> [1] 5.329071e-15
stopifnot(max(abs(free_amt / dose10 - 1)) < 1e-4)
The unmasked antibody stays unmasked, and the dormant modules stay at zero. Dosing the fully cleaved state must never populate a masked or open state (cleavage is irreversible), and with neither anti-PD-1 nor anti-CTLA-4 dosed, every one of their states must stay at zero. (The bivalent complexes of the dormant antibodies pick up integrator round-off of order 1e-13 molecules during the growth phase, against about 7000 PD-1 molecules per synapse, so the check allows a 1e-6 tolerance.)
ev_um <- rxode2::add.sampling(
  rxode2::et(amt = dose10, time = 0, cmt = "q_V_C_aPDL1"), grid84
)
um <- solv(ev_um, inits = inits)
other_states <- as.vector(outer(
  c("V_C", "V_P", "V_T", "V_LN"), setdiff(FREE, "aPDL1"),
  function(a, b) paste0("q_", a, "_", b)
))
dormant <- grep("aPD1|aCTLA4", mod$state, value = TRUE)
c(
  max_masked_or_open = max(abs(as.matrix(um[, other_states]))),
  max_dormant = max(abs(as.matrix(um[, dormant])))
)
#> max_masked_or_open        max_dormant
#>       0.000000e+00       4.049344e-15
stopifnot(
  max(abs(as.matrix(um[, other_states]))) < 1e-6,
  max(abs(as.matrix(um[, dormant]))) < 1e-6
)
Antibody pharmacokinetics
Single dose
pk1 <- bind_rows(
  data.frame(treatment = "pacmilimab", time = cons$time, Cc = NA_real_),
  data.frame(treatment = "unmasked", time = um$time, Cc = um$Cc)
)
pk1$Cc[pk1$treatment == "pacmilimab"] <- solv(ev1, inits = inits)$Cc
pk1$id <- 1L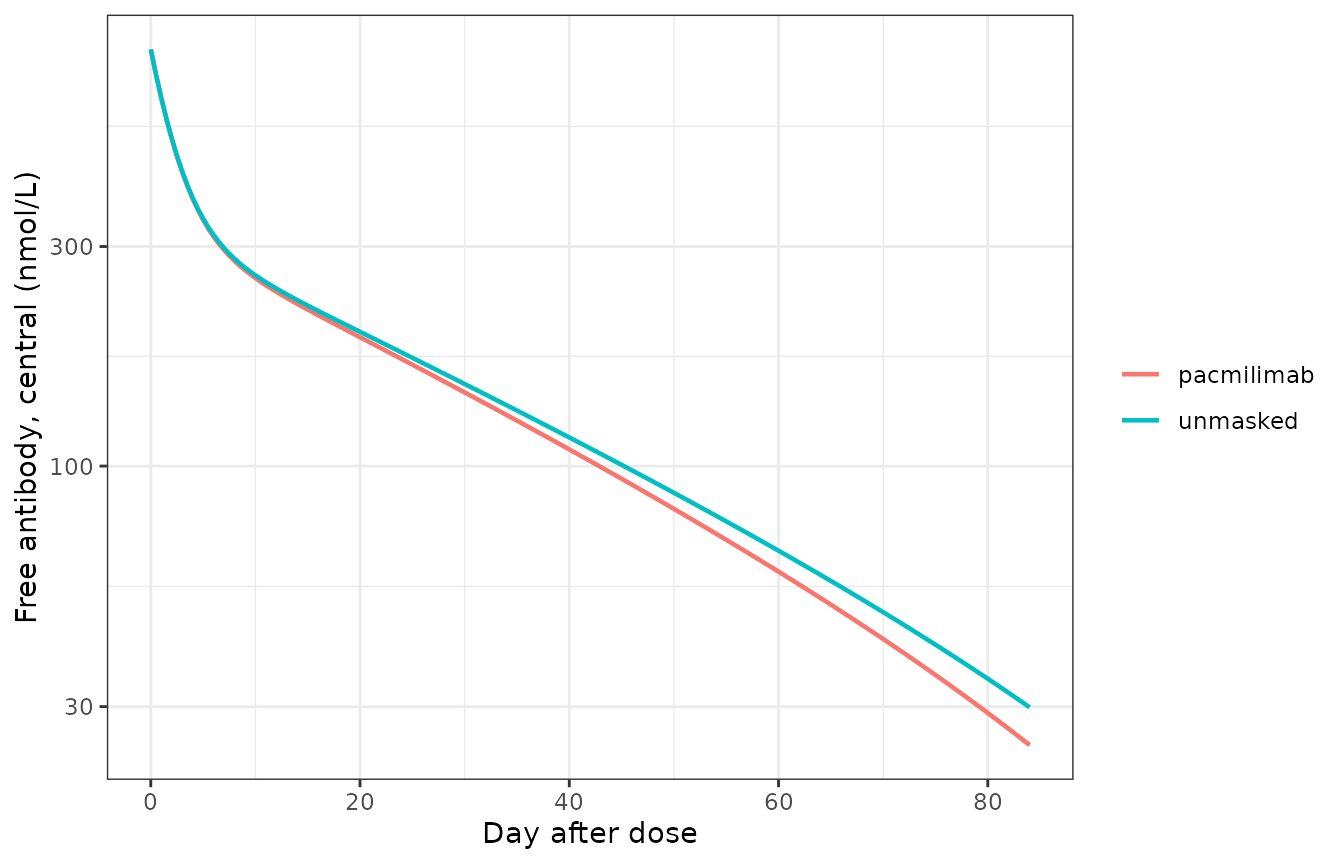
Total free antibody in the central compartment (all six states) after a single 10 mg/kg dose of pacmilimab or of the unmasked antibody.
conc_df <- pk1 |> dplyr::filter(!is.na(Cc))
dose_df <- data.frame(
  id = 1L, treatment = c("pacmilimab", "unmasked"), time = 0, amt = dose10
)
o_conc <- PKNCA::PKNCAconc(conc_df, Cc ~ time | treatment / id)
o_dose <- PKNCA::PKNCAdose(dose_df, amt ~ time | treatment + id,
  route = "intravascular", duration = 0
)
ivl <- data.frame(
  start = 0, end = 84, cmax = TRUE, tmax = TRUE, auclast = TRUE,
  aucinf.obs = TRUE, half.life = TRUE, cl.obs = TRUE
)
res_nca <- PKNCA::pk.nca(PKNCA::PKNCAdata(o_conc, o_dose, intervals = ivl))| Arm | AUClast (nmol*day/L) | Cmax (nmol/L) | t1/2 (day) | AUCinf (nmol*day/L) | CL (L/day) |
|---|---|---|---|---|---|
| pacmilimab | 11700 | 804.6 | 17.35 | 12320 | 0.3918 |
| unmasked | 12170 | 804.6 | 19.66 | 13010 | 0.3709 |
The paper publishes no NCA values, so the table documents the model rather than checking it. Both arms share the atezolizumab-like transport and the linear clearance of 0.324 L/day; the masked arm clears very slightly faster because the saturable clearance acts on each antibody state separately (see below).
Repeated dosing: Figure S3
Figure S3 of Supplementary Material 1 plots each of the six pacmilimab states in serum, tumour and peripheral tissue over the 400-day regimen. The serum bands below were digitised by the maintainers around day 380 of that figure.
s3 <- solv(rxode2::add.sampling(q2w("q_V_C_aPDL1cc"), seq(0, 400, by = 0.5)),
  inits = inits
)
s3_nocln <- solv(rxode2::add.sampling(q2w("q_V_C_aPDL1cc"), seq(0, 400, by = 0.5)),
  inits = inits, params = c(k_cln_aPDL1 = 0)
)
digitised <- data.frame(
  state = FREE,
  lo = c(850, 8, 0.019, 7.9, 0.047, 0.029),
  hi = c(1900, 20, 0.050, 7.9, 0.047, 0.029)
)
band <- function(s, st) {
  w <- s$time >= 372 & s$time <= 386
  v <- s[[paste0("x_V_C_", st)]][w]
  sqrt(min(v) * max(v))
}
s3tab <- digitised |>
  dplyr::mutate(
    label = LABEL[state],
    fig = sqrt(lo * hi),
    model = vapply(state, function(st) band(s3, st), 1),
    model_nocln = vapply(state, function(st) band(s3_nocln, st), 1),
    ratio = model / fig,
    ratio_nocln = model_nocln / fig
)| State | Figure S3 (nmol/L) | Model (nmol/L) | Model / figure | Model, saturable clearance off | Model / figure, clearance off |
|---|---|---|---|---|---|
| cc | 1.27e+03 | 1.12e+03 | 0.882 | 1.15e+03 | 0.908 |
| co | 1.26e+01 | 1.23e+01 | 0.970 | 1.26e+01 | 1.000 |
| oo | 3.08e-02 | 3.50e-02 | 1.140 | 3.61e-02 | 1.170 |
| mc | 7.90e+00 | 9.07e-01 | 0.115 | 7.21e+00 | 0.913 |
| mo | 4.70e-02 | 5.18e-03 | 0.110 | 4.12e-02 | 0.876 |
| mm | 2.90e-02 | 4.65e-04 | 0.016 | 2.71e-02 | 0.936 |
masked_states <- s3tab$state %in% c("aPDL1cc", "aPDL1co", "aPDL1oo")
stopifnot(
  # the masked and open states, 99% of the drug, match the figure as exported
  all(abs(log(s3tab$ratio[masked_states])) < log(1.5)),
  # all six states match once the saturable clearance is switched off
  all(abs(log(s3tab$ratio_nocln)) < log(1.5)),
  # with it on, the cleaved states sit far below the figure
  all(s3tab$ratio[!masked_states] < 0.2)
)
The fully and partly masked states (cc, co, oo) reproduce Figure S3
as exported, to within 15%. The three states with a cleaved site (mc,
mo, mm) reproduce it only once the saturable clearance
k_cln_aPDL1 is set to zero. The export applies that
clearance (Vmax 5.6 nmol/day, Km 1.69 nmol/L) to each state separately,
so at the low concentrations of the cleaved states it adds up to 3.3
L/day of clearance, ten times the linear clearance. The figure behaves
as if that term were absent or saturated by total antibody. The model
keeps the exported rate laws and values; set
k_cln_aPDL1 = 0 to reproduce Figure S3. The choice does not
affect tumour response, because the cleaved states contribute little of
the active antibody either way (checked below).
#> Warning: Removed 19 rows containing missing values or values outside the scale range
#> (`geom_line()`).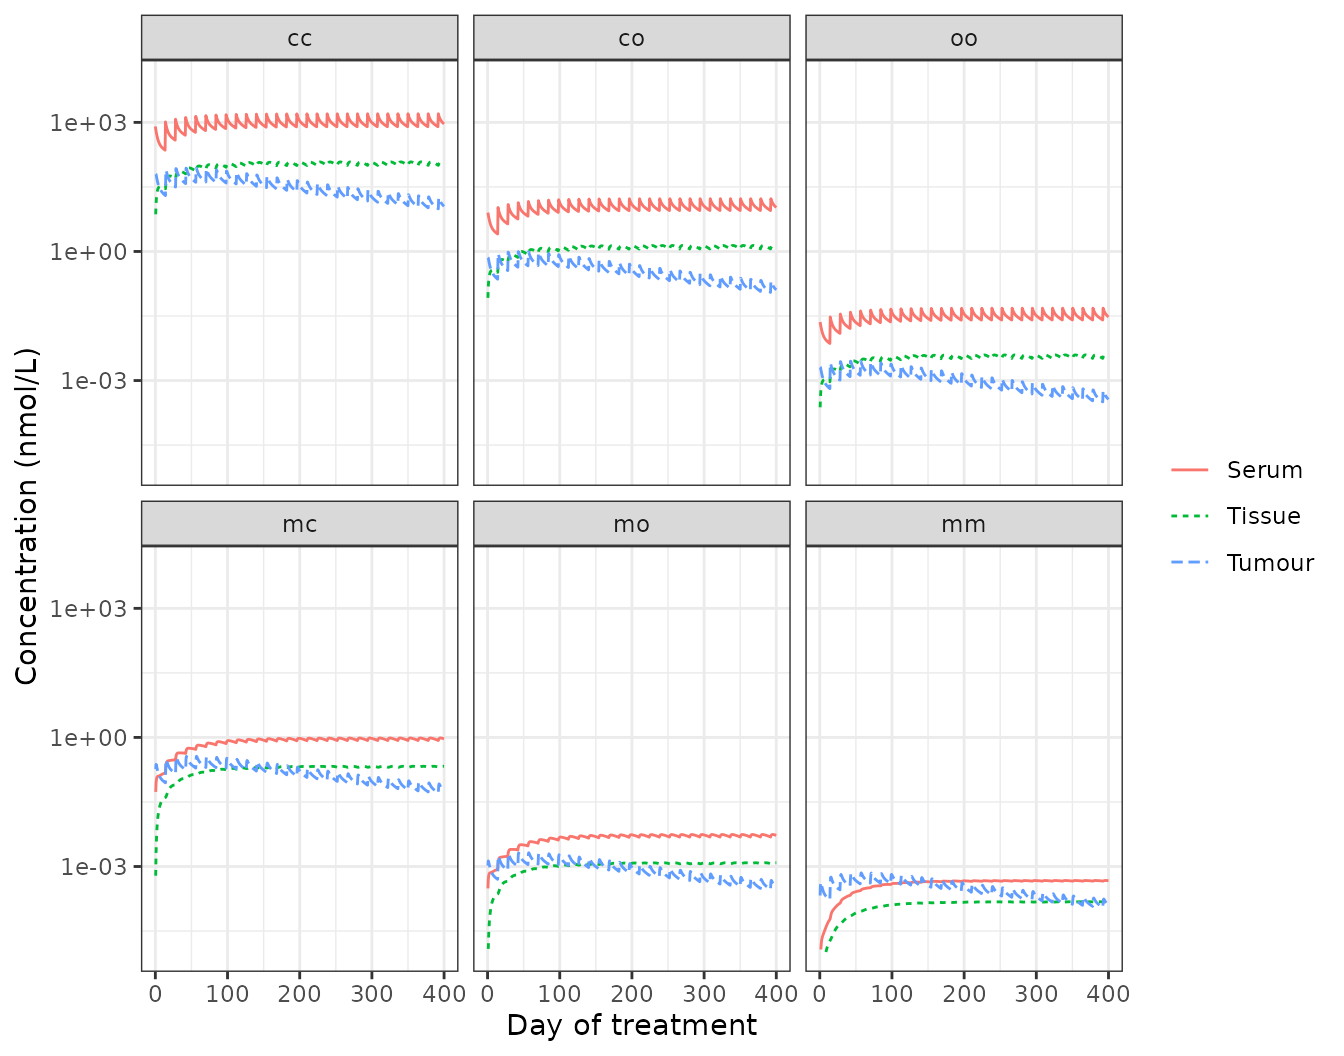
Replicates Figure S3 of Ippolito 2024b for the typical patient: each pacmilimab state in serum (central), tumour and peripheral tissue during 10 mg/kg every 2 weeks.
Tumour and tissue concentrations sit below the figure’s: tumour exposure depends on the tumour’s own size through lymphatic drainage, and the typical patient’s tumour doubles in diameter over the 400 days (below), while the figure’s patient is not identified.
Virtual trial arms for the typical patient
grid400 <- seq(0, 400, by = 1)
arms <- list(
  untreated = rxode2::et(grid400),
  pacmilimab = rxode2::add.sampling(q2w("q_V_C_aPDL1cc"), grid400),
  unmasked = rxode2::add.sampling(q2w("q_V_C_aPDL1"), grid400)
)
arm_res <- lapply(names(arms), function(a) {
  s <- solv(arms[[a]], inits = inits)
  s$arm <- a
  s
}) |> bind_rows()
arm_res <- arm_res |>
  dplyr::group_by(arm) |>
  dplyr::mutate(pct_change = 100 * (tumour_diameter / tumour_diameter[1] - 1)) |>
  dplyr::ungroup()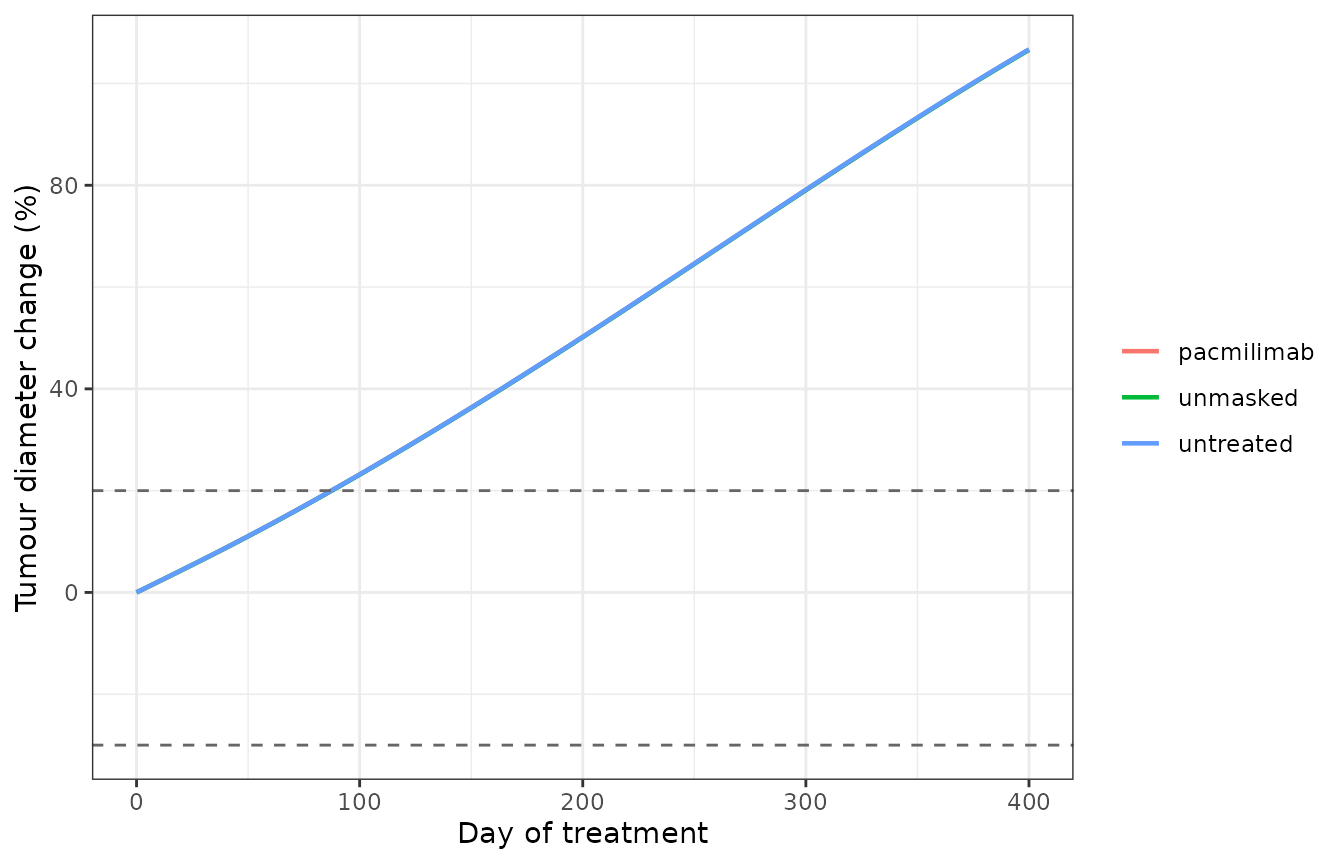
Tumour diameter change from the start of treatment for the typical patient, with the RECIST 1.1 limits of +20% and -30% (compare the spider plot of Figure 3a).
| Arm | Diameter change at day 400 (%) | PD-1 signalling, T cell-cancer cell (H_PD1_C1) | PD-1:PD-L1 (molecule/um^2) | PD-1:PD-L2 (molecule/um^2) |
|---|---|---|---|---|
| untreated | 107 | 0.999 | 192.00 | 17.3 |
| pacmilimab | 107 | 0.998 | 114.00 | 17.5 |
| unmasked | 107 | 0.925 | 3.35 | 17.7 |
chg <- setNames(day400$pct_change, day400$arm)
pd1pdl1 <- setNames(day400$x_syn_T_C1_PD1_PDL1, day400$arm)
stopifnot(
  # the typical patient progresses in every arm (most virtual patients do)
  all(chg > 20),
  # the unmasked antibody blocks PD-1:PD-L1 by over 95%, pacmilimab by less
  pd1pdl1[["unmasked"]] < 0.05 * pd1pdl1[["untreated"]],
  pd1pdl1[["pacmilimab"]] > pd1pdl1[["unmasked"]]
)
The typical patient progresses in all three arms: with an objective
response rate near 16%, most virtual patients do. The unmasked antibody
removes over 95% of PD-1:PD-L1 complexes in the T cell-cancer cell
synapse, but PD-1 signalling stays high because PD-1:PD-L2 (PD-L2 at 7%
of PD-L1, r_PDL2C1) is untouched by an anti-PD-L1 antibody.
That leaves PD-L2 as the gate on response in this patient.
Responsiveness: a lower PD-L2 patient
To see the two arms separate, the same protocol is run for a patient
with slower tumour growth (k_C1_growth 0.003 instead of
0.007 per day) and little PD-L2 (r_PDL2C1 0.001). Both
parameters are among the patient-specific drivers the paper’s
sensitivity analysis ranks highest (Figure 4a). This patient is
illustrative, not one of the paper’s virtual patients.
p_resp <- c(k_C1_growth = 0.003, r_PDL2C1 = 0.001)
grow_r <- solv(rxode2::et(seq(0, 10000, by = 5)), params = p_resp)
i_r <- which(grow_r$tumour_diameter >= 3.7)[1]
inits_r <- unlist(grow_r[i_r, mod$state])
names(inits_r) <- mod$state
resp <- lapply(names(arms), function(a) {
  s <- solv(arms[[a]], inits = inits_r, params = p_resp)
  data.frame(arm = a, time = s$time, d = s$tumour_diameter)
}) |> bind_rows() |>
  dplyr::group_by(arm) |>
  dplyr::mutate(pct_change = 100 * (d / d[1] - 1)) |>
  dplyr::ungroup()
chg_r <- resp |> dplyr::filter(time == 400)
chg_r <- setNames(chg_r$pct_change, chg_r$arm)
signif(chg_r, 3)
#>  untreated pacmilimab   unmasked
#>       41.3       40.9      -31.7
stopifnot(
  # the unmasked antibody shrinks the tumour, and far below the untreated arm
  chg_r[["unmasked"]] < 0,
  chg_r[["untreated"]] - chg_r[["unmasked"]] > 50,
  chg_r[["pacmilimab"]] > chg_r[["unmasked"]],
  chg_r[["pacmilimab"]] <= chg_r[["untreated"]]
)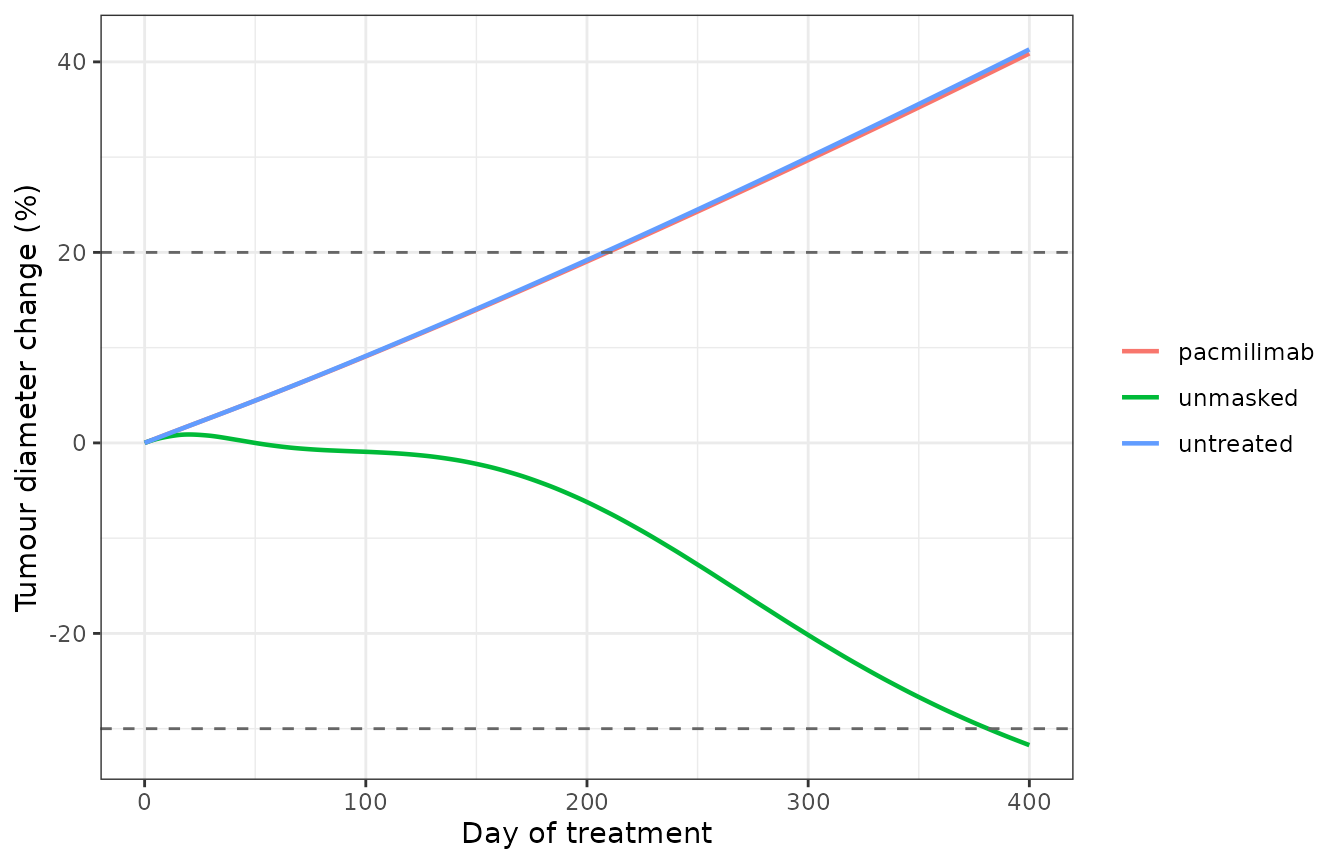
Tumour diameter change for an illustrative low-PD-L2, slow-growing patient.
Here the unmasked antibody shrinks the tumour by about a third, at
the RECIST partial-response limit, while pacmilimab barely slows growth.
Pacmilimab’s serum exposure matches Figure S3, but only about 1% of it
has a site open (2 * K_m, with K_m = 1/175),
and cleavage in the tumour is slow, so the active antibody in the tumour
is roughly fifty-fold below that of the unmasked arm. The paper reports
almost indistinguishable progression-free survival for the two arms
across its 460 virtual patients (Figure 3c). That comparison could not
be repeated: the patient parameter distributions are not in the
supplement, and neither typical-value patient here reproduces the
parity.
Tumour-selective activation
The PROBODY design aims to concentrate active antibody in the tumour. A volume-free measure of that is the active fraction (active over total free antibody) in each compartment.
w <- s3$time >= 372 & s3$time <= 386
act_frac <- sapply(c("V_C", "V_P", "V_LN", "V_T"), function(cmp) {
  tot <- rowSums(s3[w, paste0("x_", cmp, "_", FREE)])
  act <- rowSums(s3[w, paste0("x_", cmp, "_", ACTIVE)])
  mean(act / tot)
})
signif(act_frac, 3)
#>    V_C    V_P   V_LN    V_T
#> 0.0120 0.0132 0.0162 0.0163
stopifnot(
  act_frac[["V_T"]] > act_frac[["V_C"]],
  act_frac[["V_T"]] > act_frac[["V_P"]]
)
The active fraction is highest in the tumour (and in the lymph node it drains to), about 35% above serum. That is the direction of the paper’s selectivity claim. Figure 3d of the paper plots the cumulative AUC of the percentage of dose per gram of tissue: about 20 in the tumour, 8 in the central compartment and 0.06 in the periphery at day 400. Its central value matches total free antibody here (about 10 %dose*day/g with this dose), not the active antibody, and neither reading reproduces its tumour and periphery curves, so that panel is not replicated.
Assumptions and deviations
- Source. Every equation and value comes from the paper’s Supplementary Material 2, the SimBiology export of the model the authors ran. Where the export and the overview equations of Supplementary Material 1 (Eqs S1-S18) differ, the export is encoded, as it is what produced the published simulations. The differences are listed below.
-
Units the export does not state. The platform’s
MATLAB code defines
cellasmoleculeandmUasmole/litre. Without the first, every per-cell rate is off by Avogadro’s number (k_IFNg_Thsec= 80.3 “1/day” is 4e-13/3 nmol per cell per day expressed in molecules per cell per day). Both are applied, and a dimensional check then passes for all retained reactions and rules with no override. - Saturable clearance per state. As discussed under Figure S3, the export’s saturable clearance acts on each of the six antibody states separately, which suppresses the cleaved states about ten-fold relative to the figure. The exported form is kept.
-
Synaptic PD-L1 total. The repeated-assignment rules
for
syn_T_C1.PDL1_totalandsyn_T_APC.PDL1_totalsum free PD-L1, PD-1:PD-L1, the CD80 complexes and the platform’s original single-name antibody complexes (PDL1_aPDL1,PDL1_aPDL1_PDL1), which no reaction forms here. They omit the PROBODY-bound states. PD-L1 expression is driven toward baseline through these totals, so antibody-bound PD-L1 is replaced by new free PD-L1, and since bound complexes have no turnover in the export, they accumulate without limit under treatment. This is the exported behaviour and is kept. The PD-1 Hill terms read only the PD-1 complexes, so it changes no response in this vignette. -
Out-of-synapse binding. Supplementary Material 1
describes PROBODY binding to PD-L1 outside the synapse (Eqs S16-S18).
The export declares the bound states but contains no binding reaction
for them, so only out-of-synapse PD-L1 turnover is active, and the bound
states are held at zero. The paper states the module has negligible
effect, and by construction it cannot affect any other state, because
binding does not deplete free antibody and carries no downstream effect.
The T-cell out-of-synapse areas (
nonsyn_T_T,nonsyn_T_LN) carry no active species and are omitted. -
Export details kept as written. The
central-to-lymph-node exchange of the doubly open state (reaction 106,
and its anti-PD-1 counterpart 182) divides the central concentration by
gamma_LNrather thangamma_C. The binding of the fully cleaved antibody to T-cell PD-L1 in both synapses (reactions 343 and 407) carries a factor of zero. A singly bound doubly open complex (oRo) is cleaved only at its bound site. Each affects a minor state. - Never-dosed modules. The export’s anti-PD-1 and anti-CTLA-4 antibody modules (mask kinetics as for anti-PD-L1, but only the fully cleaved form binds) are carried for completeness. Undosed, they are identically zero and change nothing else.
-
Parameters dropped. The 33 rows of the Parameters
sheet that are targets of repeated-assignment rules
(
C_total,H_PD1_C1,N_aT, …) hold SimBiology’s stored last values. They are computed by their rules instead.A_syn(the synapse area, carried by the synapse compartment capacities) andk_vas_Msec(a vasculature constant with no vasculature module in this model) appear in no rate law and are omitted. - Molar mass and body weight. Neither is reported: 145 kDa (atezolizumab, whose transport parameters the PROBODY shares) and 70 kg are assumed to convert 10 mg/kg into 4828 nmol. Both only scale the dose. The Figure S3 match of the masked states supports the combination.
- Virtual population. The paper’s patient-parameter distributions, its epsilon bound and the iAtlas selection are not reproducible from the supplement, so response rates, progression-free survival, the PRCC analysis (Figure 4) and the T cell clone deciles (Figure 5) are not simulated. The typical patient and the illustrative low-PD-L2 patient stand in.
- No IIV, no residual error. Deterministic mechanism model.