Gentamicin bactericidal activity and adaptive resistance (Mohamed 2012)
Source:vignettes/articles/Mohamed_2012_gentamicin.Rmd
Mohamed_2012_gentamicin.RmdModel and source
- Citation: Mohamed AF, Nielsen EI, Cars O, Friberg LE. Pharmacokinetic-pharmacodynamic model for gentamicin and its adaptive resistance with predictions of dosing schedules in newborn infants. Antimicrob Agents Chemother. 2012 Jan;56(1):179-188. doi:10.1128/AAC.00694-11. Model differential equations (Eqs 1-7), Figure 1 schematic, and final-model parameter estimates (Table 1) are in the main text.
- Description: In vitro (Escherichia coli ATCC 25922). Semi-mechanistic PKPD model of gentamicin bactericidal activity with adaptive resistance: drug-susceptible growing bacteria (bact_growing) plus insusceptible resting bacteria (bact_resting), with a binding model (ar_off / ar_on) by which gentamicin reduces its own Emax. Fit jointly to static and dynamic in-vitro time-kill curves.
- Article: https://doi.org/10.1128/AAC.00694-11
This is not a population PK model. It is a
semi-mechanistic PKPD model of gentamicin bactericidal activity against
Escherichia coli ATCC 25922, fit in NONMEM (Laplacian, ADVAN9)
to bacterial-count data (natural log of CFU/mL) from 48 static and 25
dynamic in-vitro time-kill experiments (Mohamed 2012 Methods, Results).
The gentamicin exposure is reproduced here as a single concentration
state (cgent, mg/L) that the user doses; the structural
neonatal popPK described in the paper’s Discussion (and used for the
clinical-dosing predictions in Figs 4-6) is from a separate upstream
paper (Nielsen 2011 / ref 35) and is not packaged here. Because there is
no absorption-distribution-elimination PK profile to integrate for an
NCA, PKNCA is not an appropriate validation; the checks below are the
mechanistic equivalents (carrying-capacity hold, static and dynamic kill
replication, and the adaptive-resistance time-course arithmetic).
Population (biological context)
The model describes E. coli ATCC 25922 (gentamicin MIC 2 mg/L by macrodilution) grown in cation-adjusted Mueller-Hinton broth at 35 C. Two experimental designs were used (Mohamed 2012 Methods): static time-kill curves at constant gentamicin concentrations of 0.125, 0.25, 0.5, 1, 2, 4, and 16 mg/L (started at inoculum ~5e5 CFU/mL, plus a high-inoculum subset pre-grown 12 h to ~1e9 CFU/mL and exposed to 1, 2, 4, or 16 mg/L), and dynamic time-kill curves in a two-compartment in-vitro kinetic flask simulating preterm-neonate PK with peak concentrations of 2.0, 3.9, 7.8, and 16 mg/L (matching neonatal 1, 2, 4, and 8 mg/kg doses) as single or repeated doses. The simulated neonatal kinetics use two exchanger flow rates corresponding to gentamicin rate constants of 0.33 /h (first 4 h) and 0.037 /h thereafter.
The same information is available programmatically via
readModelDb("Mohamed_2012_gentamicin")$population.
Source trace
Per-parameter origins are recorded as in-file comments next to each
ini() entry in
inst/modeldb/specificDrugs/Mohamed_2012_gentamicin.R. All
numeric values are the final population-mean estimates from Mohamed 2012
Table 1. The model structure follows Figure 1 and Equations 1-7 of the
main text.
| Equation / parameter | Value | Source location |
|---|---|---|
kgrowth (bacterial growth rate constant) |
2.00 /h | Table 1 |
kdeath (natural death rate constant; fixed) |
0.179 /h | Table 1 (fix; from Nielsen 2007 ref 36) |
bp (breakpoint for non-zero S->R transfer) |
2.09e6 CFU/mL | Table 1 |
bmax (stationary-phase total count) |
8.26e8 CFU/mL | Table 1 |
emax0 (max kill rate at zero AR) |
51.0 /h | Table 1 |
ec50 (gentamicin EC50) |
9.93 mg/L | Table 1 |
ar50 (AR_on at half-max E_max inhibition) |
0.113 | Table 1 |
kon (AR development rate constant) |
0.0426 L/(mg*h) | Table 1 |
koff (return-to-susceptibility rate constant;
fixed) |
0.0139 /h | Table 1 (fix) |
s0 (initial inoculum used in predictions) |
4.83e5 CFU/mL | Methods (average across experiments) |
lkel (log in-vitro flask elimination; fixed input) |
log(0.037) default | Methods (set to 0 for static, 0.33 then 0.037 /h for dynamic) |
addSd (residual SD on ln(CFU/mL)) |
1.69 | Table 1 (RE_static); RE_dynamic = 2.80 and RRE = 0.618 also reported |
| ODEs for bact_growing / bact_resting (Eqs 1 + 5) | n/a | Main text Eqs 1, 5 |
| Adaptive-resistance binding ODEs (Eqs 6-7) | n/a | Main text Eqs 6, 7 |
| Inhibition form E_max = E_max(0) * AR50 / (AR50 + AR_on) | n/a | Main text Eq 4 and Results paragraph on maximum inhibition |
| k_SR = ((kgrowth - kdeath) / bmax) * (S + R) * [S + R > BP] | n/a | Methods paragraph on transfer rate, with derivation of beta from Bmax |
Units (dimensional analysis)
| Symbol | Meaning | Units |
|---|---|---|
bact_growing, bact_resting |
susceptible / resting bacterial counts | CFU/mL |
ar_off, ar_on |
adaptive-resistance binding-model states | unitless (mass-balance 1) |
cgent |
gentamicin concentration in flask | mg/L |
kgrowth, kdeath, kel = exp(lkel), drug, emax, emax0, ksr |
rate constants | 1/h |
kon |
binding on-rate | L/(mg*h) |
koff |
binding off-rate | 1/h |
ec50 |
half-effect concentration | mg/L |
ar50 |
half-effect AR_on level | unitless |
bp, bmax, s0 |
bacterial count scales | CFU/mL |
beta |
inverse-carrying-capacity constant | 1/(CFU/mL * h) |
Every bacterial ODE term has the form (1/h) * (CFU/mL) = (CFU/mL)/h;
the AR-binding ODEs are (L/(mgh)) (mg/L) * (unitless) =
(unitless)/h; the cgent ODE is (1/h) * (mg/L) = (mg/L)/h.
All consistent.
mod <- rxode2::rxode(readModelDb("Mohamed_2012_gentamicin"))
mod$state
#> [1] "bact_growing" "bact_resting" "ar_off"       "ar_on"        "cgent"
Parameter table (paper vs. file)
params <- mod$theta
knitr::kable(
  data.frame(parameter = names(params), file_value = unname(params)),
  caption = "Typical / fixed parameter values as loaded from the model file (Mohamed 2012 Table 1)."
)| parameter | file_value |
|---|---|
| kgrowth | 2.000000e+00 |
| kdeath | 1.790000e-01 |
| bp | 2.090000e+06 |
| bmax | 8.260000e+08 |
| emax0 | 5.100000e+01 |
| ec50 | 9.930000e+00 |
| ar50 | 1.130000e-01 |
| kon | 4.260000e-02 |
| koff | 1.390000e-02 |
| s0 | 4.830000e+05 |
| lkel | -3.296837e+00 |
| addSd | 1.690000e+00 |
Mechanistic checks
1. Maximum adaptive-resistance inhibition
The paper reports that “the maximum E_max inhibition by the adaptive
resistance mechanism was 90% as the maximum amount possible in AR_on is
1 [1/(1 + 0.113)]” (Results paragraph below Table 1). Mass balance keeps
ar_on + ar_off = 1, so the saturating AR_on is 1 and the
inhibition fraction is 1/(1 + AR50). With AR50 = 0.113 this is 0.898 –
within rounding of the published 90%.
ar50 <- 0.113
data.frame(
  AR_on = c(0, 0.05, ar50, 0.5, 1),
  inhibition_fraction = c(0, 0.05, ar50, 0.5, 1) / (ar50 + c(0, 0.05, ar50, 0.5, 1)),
  E_max_remaining_fraction = ar50 / (ar50 + c(0, 0.05, ar50, 0.5, 1))
) |>
  knitr::kable(digits = 3,
caption = "Adaptive-resistance attenuation of E_max. At AR_on = 1 the inhibition fraction is 0.898 (90%), matching Mohamed 2012.")| AR_on | inhibition_fraction | E_max_remaining_fraction |
|---|---|---|
| 0.000 | 0.000 | 1.000 |
| 0.050 | 0.307 | 0.693 |
| 0.113 | 0.500 | 0.500 |
| 0.500 | 0.816 | 0.184 |
| 1.000 | 0.898 | 0.102 |
2. Adaptive-resistance half-lives at constant gentamicin
For first-order saturation of ar_on toward its steady
state, the relaxation rate is kon * C + koff and the
half-time is ln(2) / (kon * C + koff). The paper reports
concentration-dependent half-lives of 16, 4, and 1 h at constant
gentamicin concentrations of 1, 4, and 16 mg/L (Mohamed 2012
Discussion). The binding-model arithmetic reproduces the 4-mg/L and
16-mg/L values closely; at 1 mg/L the simple two-state half-life is
shorter (~12 h) than the published 16 h estimate, reflecting that at low
C the off-rate dominates and the published “half-life” was likely read
off the simulated trajectory rather than computed analytically.
kon  <- 0.0426
koff <- 0.0139
data.frame(
  C_mgL = c(1, 4, 16),
  rate_per_h = kon * c(1, 4, 16) + koff,
  half_life_h_model = log(2) / (kon * c(1, 4, 16) + koff),
  half_life_h_paper = c(16, 4, 1)
) |>
  knitr::kable(digits = 2,
caption = "Adaptive-resistance half-life ln(2)/(kon*C + koff) versus the values cited in the Discussion of Mohamed 2012.")| C_mgL | rate_per_h | half_life_h_model | half_life_h_paper |
|---|---|---|---|
| 1 | 0.06 | 12.27 | 16 |
| 4 | 0.18 | 3.76 | 4 |
| 16 | 0.70 | 1.00 | 1 |
Growth-control replication (Fig 2A, antibiotic-free curve)
With no gentamicin, the population grows exponentially from the
inoculum (s0 = 4.83e5) and approaches the stationary
bmax = 8.26e8 CFU/mL plateau once the total exceeds
bp = 2.09e6. The paper reports a plateau “of approximately
1e9 CFU/mL” in growth-control experiments – consistent with the model’s
bmax of 8.26e8.
ev_gc <- rxode2::et(seq(0, 24, by = 0.25))
gc <- rxode2::rxSolve(mod, ev_gc, returnType = "data.frame", maxsteps = 1e5)

cat(sprintf("Inoculum  ln(CFU/mL)   = %.3f  (S(0) = %.2e)\n",
            gc$Cc[1], 4.83e5))
#> Inoculum  ln(CFU/mL)   = 13.088  (S(0) = 4.83e+05)
cat(sprintf("Plateau   ln(CFU/mL)   = %.3f  (B_max = 8.26e8, ln = %.3f)\n",
            tail(gc$Cc, 1), log(8.26e8)))
#> Plateau   ln(CFU/mL)   = 20.409  (B_max = 8.26e8, ln = 20.532)

ggplot(gc, aes(time, Cc / log(10))) +
  geom_line(linewidth = 1) +
  geom_hline(yintercept = log10(8.26e8), linetype = 2, colour = "grey50") +
  labs(x = "Time (h)", y = expression(log[10]~CFU/mL),
       title = "Antibiotic-free growth control (replicates Fig 2A grey curve)",
       caption = "Dashed line: stationary B_max = 8.26e8 CFU/mL.")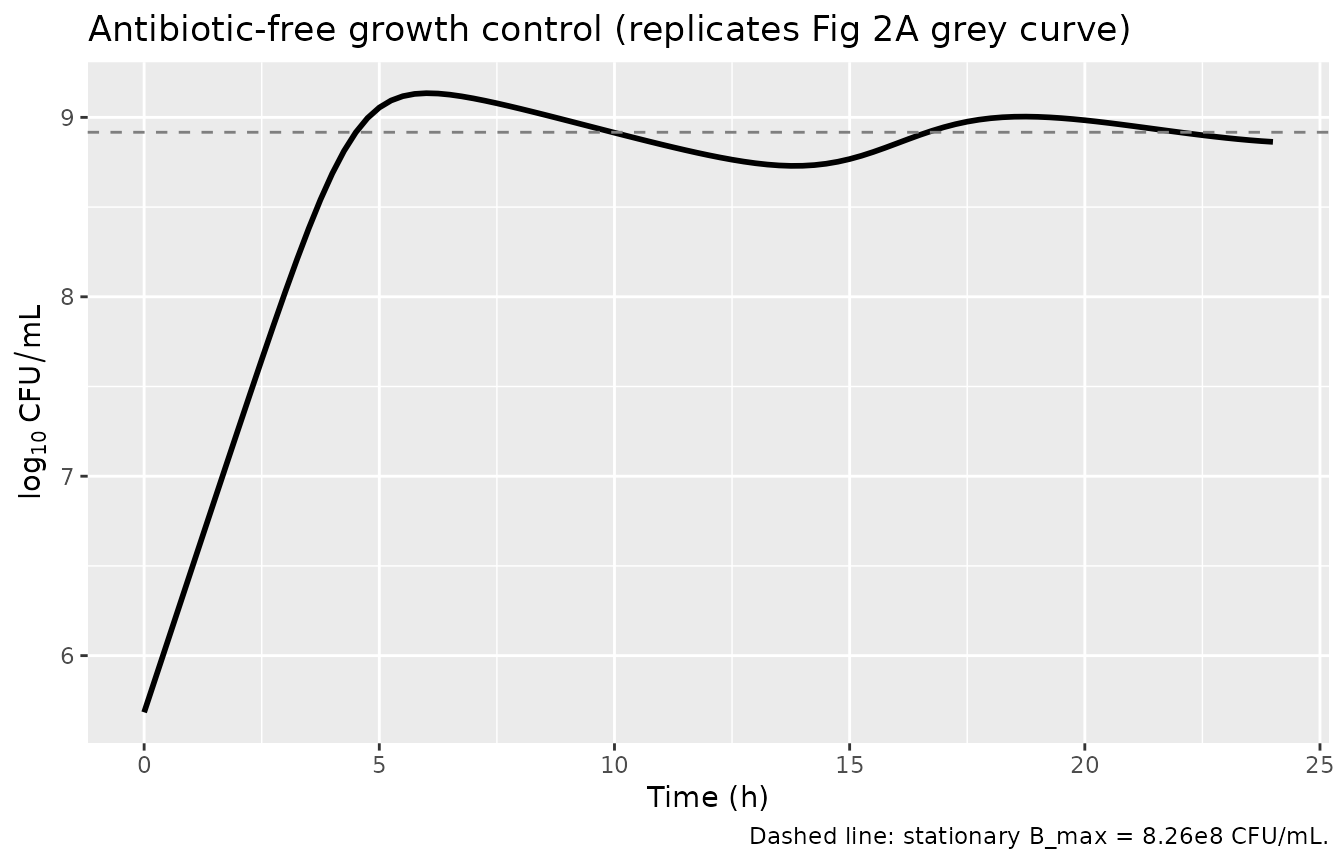
Static-experiment replication (Fig 2A)
Figure 2A shows seven constant gentamicin concentrations from 0.125
to 16 mg/L plus a growth control. The paper text reports that “regrowth
occurred for concentrations of 0.5, 1, and 2 mg/L while the bacterial
count remained below the LOD during the 24 h of incubation following
exposures to concentrations of 4 and 16 mg/L” (Results, Time-kill curve
experiments). Static experiments correspond to kel = 0
(gentamicin does not decline).
loc <- 10            # limit of detection (CFU/mL)
conc <- c(0.5, 1, 2, 4, 16)

run_static <- function(C) {
  ev <- rxode2::et(amt = C, cmt = "cgent", time = 0) |>
    rxode2::et(seq(0, 24, by = 0.5))
  rxode2::rxSolve(mod, ev,
                  params = c(lkel = log(1e-12)),  # static: no decline
                  returnType = "data.frame", maxsteps = 1e5) |>
    mutate(C_mgL = C)
}

sim_static <- bind_rows(lapply(conc, run_static))

sim_static |>
  mutate(C_label = factor(sprintf("%g mg/L", C_mgL),
                          levels = sprintf("%g mg/L", conc))) |>
  mutate(log10_CFU = pmax(log10(pmax(bact_growing + bact_resting, 1)),
                          log10(loc))) |>
  ggplot(aes(time, log10_CFU, colour = C_label)) +
  geom_line(linewidth = 0.9) +
  geom_hline(yintercept = log10(loc), linetype = 3, colour = "grey50") +
  labs(x = "Time (h)", y = expression(log[10]~CFU/mL),
       colour = "Gentamicin", title = "Static time-kill curves (replicates Fig 2A)",
       caption = "Dotted line: limit of detection (10 CFU/mL).")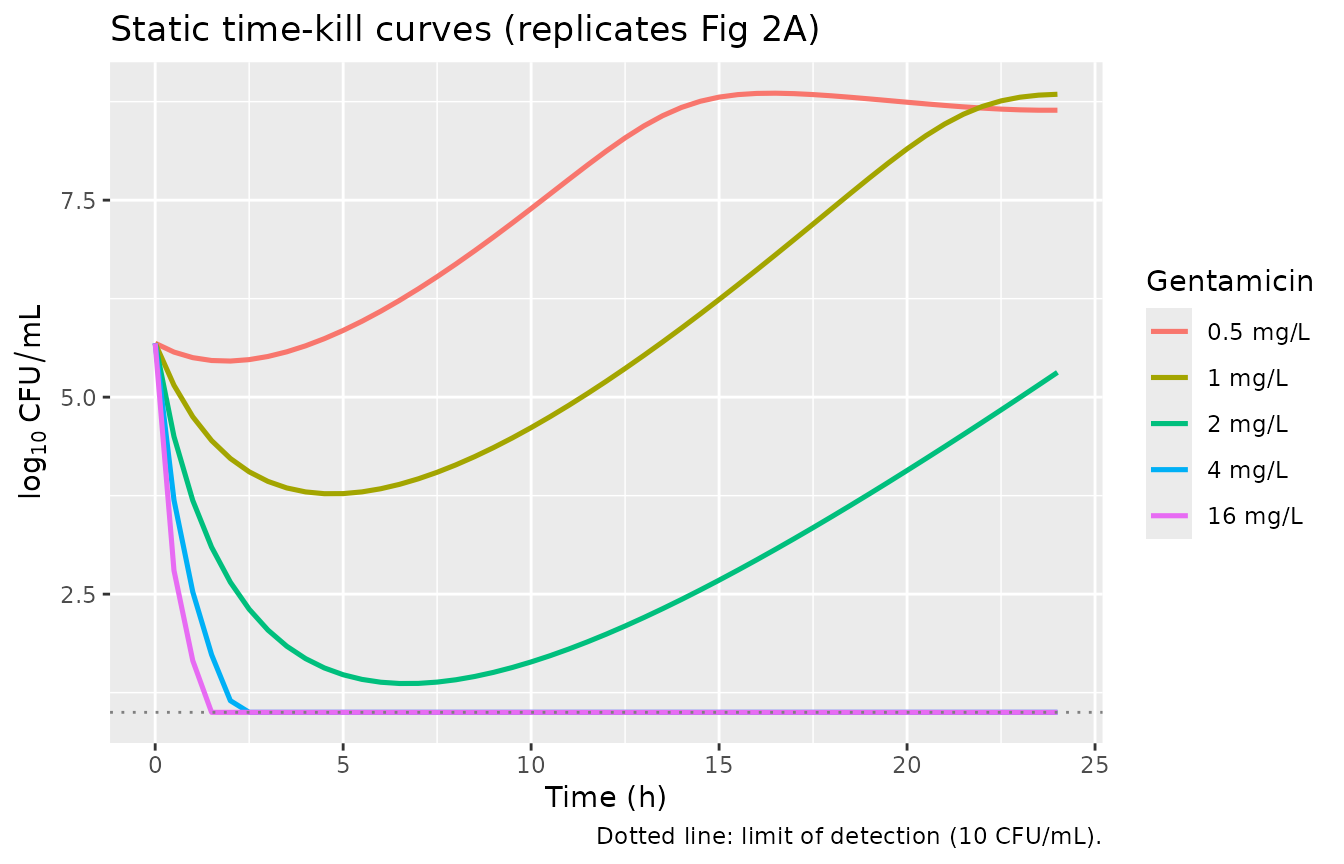
sim_static |>
  group_by(C_mgL) |>
  summarise(
    nadir_log10  = round(log10(min(pmax(bact_growing + bact_resting, 1))), 2),
    at_24h_log10 = round(log10(pmax(tail(bact_growing + bact_resting, 1), 1)), 2),
    .groups = "drop"
  ) |>
knitr::kable(caption = "Nadir and 24-h total bacterial count by static gentamicin concentration. The model reproduces regrowth at 0.5-2 mg/L and below-LOD bacterial counts at 4 and 16 mg/L (Mohamed 2012 Fig 2A, Results paragraph 1).")| C_mgL | nadir_log10 | at_24h_log10 |
|---|---|---|
| 0.5 | 5.46 | 8.64 |
| 1.0 | 3.77 | 8.84 |
| 2.0 | 1.37 | 5.31 |
| 4.0 | 0.00 | 0.00 |
| 16.0 | 0.00 | 0.00 |
Dynamic-experiment replication (Fig 2B single doses)
The dynamic experiments declined gentamicin biphasically: rate constant 0.33 /h for the first 4 h, then 0.037 /h thereafter. We simulate this by splitting the run into two segments around the 4-h flow-rate switch.
peak <- c(2.0, 3.9, 7.8, 16)

run_dynamic <- function(Cmax) {
  ev1 <- rxode2::et(amt = Cmax, cmt = "cgent", time = 0) |>
    rxode2::et(seq(0, 4, by = 0.25))
  s1 <- rxode2::rxSolve(mod, ev1, params = c(lkel = log(0.33)),
                        returnType = "data.frame", maxsteps = 1e5)
  init2 <- tail(s1, 1)
  ev2 <- rxode2::et(seq(4, 24, by = 0.5))
  s2 <- rxode2::rxSolve(mod, ev2,
                        params = c(lkel = log(0.037)),
                        inits = c(bact_growing = init2$bact_growing,
                                  bact_resting = init2$bact_resting,
                                  ar_off       = init2$ar_off,
                                  ar_on        = init2$ar_on,
                                  cgent        = init2$cgent),
                        returnType = "data.frame", maxsteps = 1e5)
  bind_rows(s1, s2) |> mutate(Cmax_mgL = Cmax)
}

sim_dyn <- bind_rows(lapply(peak, run_dynamic))

p_left <- sim_dyn |>
  mutate(Cmax_label = factor(sprintf("Cmax %g mg/L", Cmax_mgL),
                             levels = sprintf("Cmax %g mg/L", peak))) |>
  ggplot(aes(time, cgent, colour = Cmax_label)) +
  geom_line(linewidth = 0.9) +
  scale_y_log10() +
  labs(x = "Time (h)", y = "Gentamicin (mg/L, log scale)",
       colour = NULL, title = "Simulated in-vitro PK (Fig 2B input)") +
  theme(legend.position = "bottom")

p_right <- sim_dyn |>
  mutate(Cmax_label = factor(sprintf("Cmax %g mg/L", Cmax_mgL),
                             levels = sprintf("Cmax %g mg/L", peak))) |>
  mutate(log10_CFU = pmax(log10(pmax(bact_growing + bact_resting, 1)),
                          log10(10))) |>
  ggplot(aes(time, log10_CFU, colour = Cmax_label)) +
  geom_line(linewidth = 0.9) +
  geom_hline(yintercept = log10(10), linetype = 3, colour = "grey50") +
  labs(x = "Time (h)", y = expression(log[10]~CFU/mL),
       colour = NULL, title = "Replicates Fig 2B (dynamic single dose)") +
  theme(legend.position = "bottom")

print(p_left)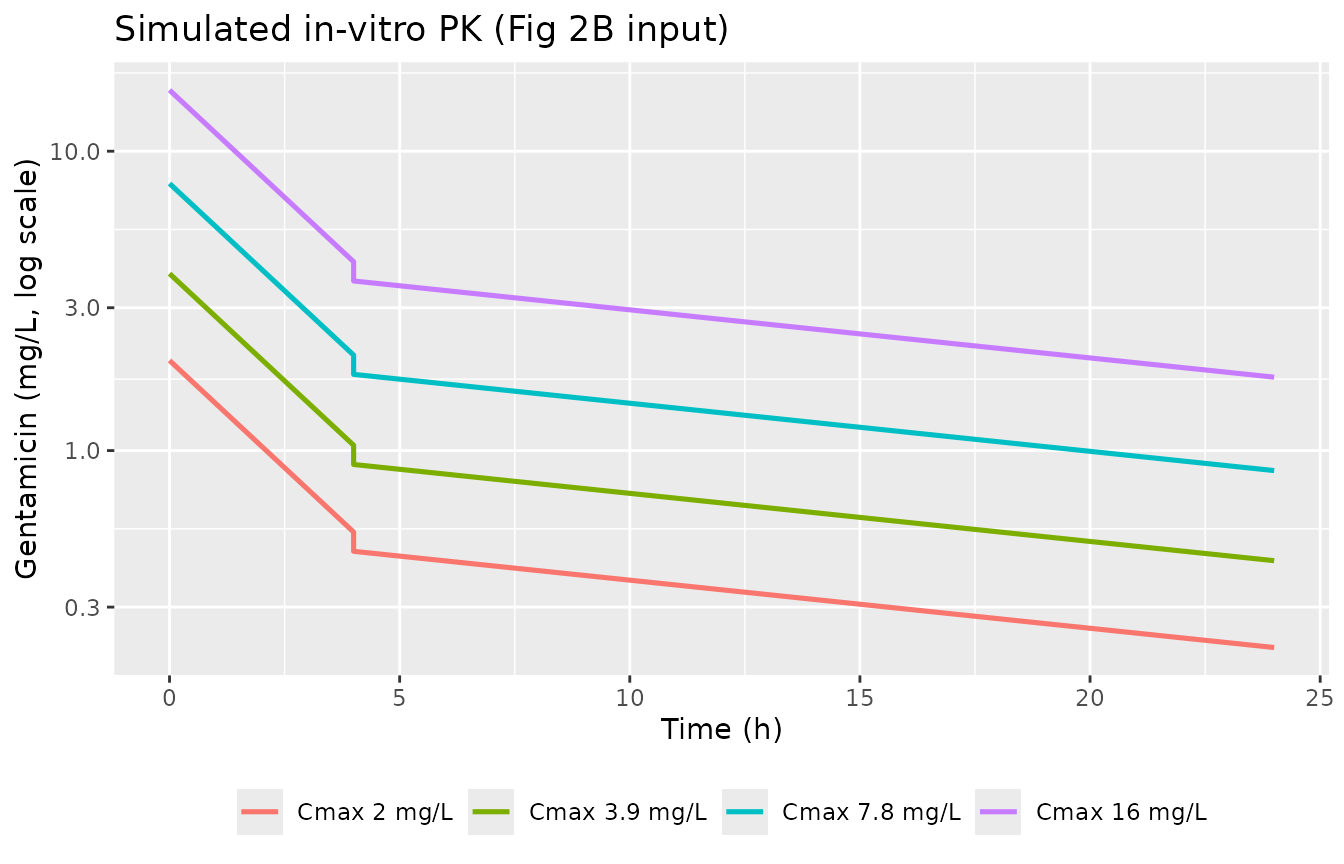
print(p_right)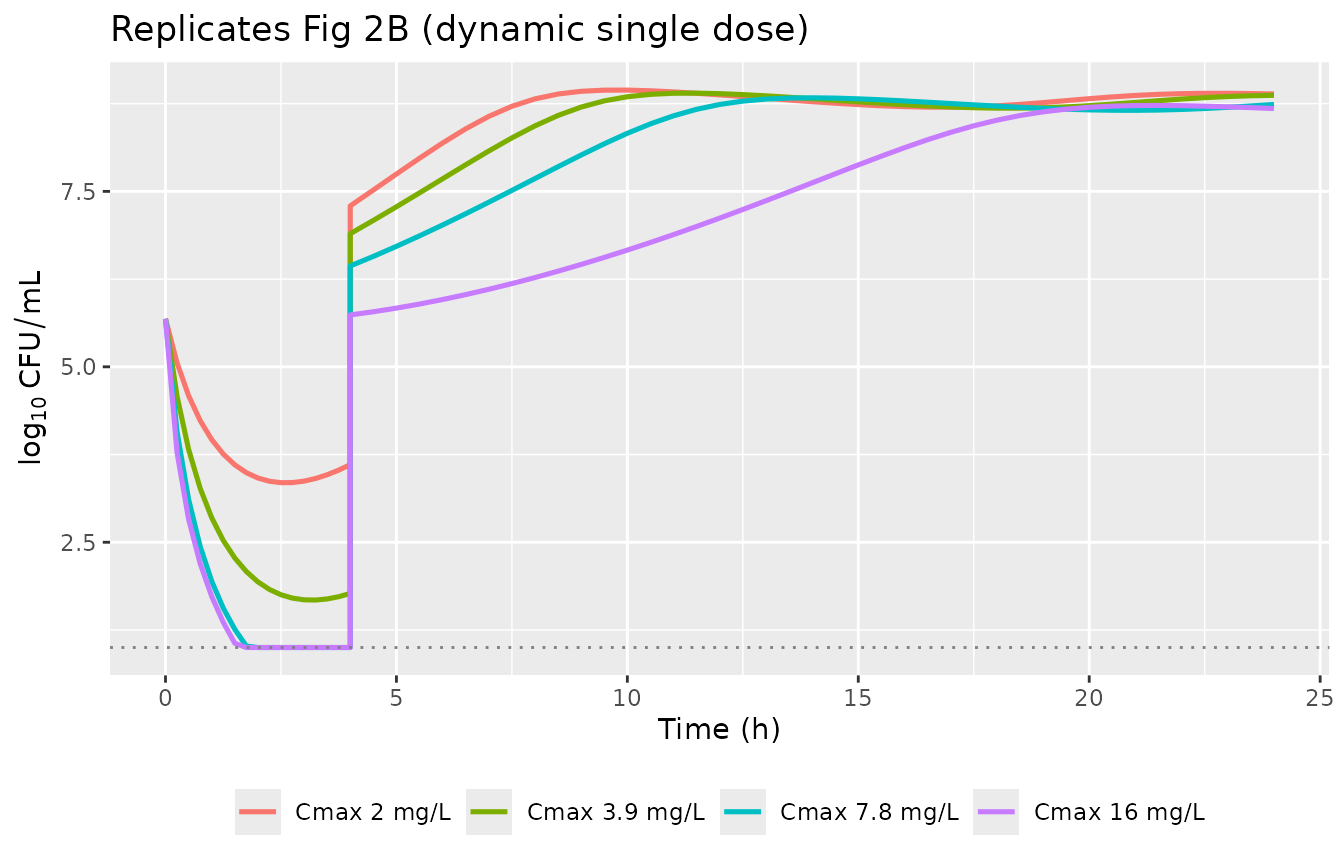
The model reproduces the paper’s qualitative Fig 2B finding: regrowth occurred for all dynamic single doses, but the higher peaks produced deeper initial kills before regrowth.
sim_dyn |>
  group_by(Cmax_mgL) |>
  summarise(
    nadir_log10  = round(log10(min(pmax(bact_growing + bact_resting, 1))), 2),
    at_24h_log10 = round(log10(pmax(tail(bact_growing + bact_resting, 1), 1)), 2),
    ar_on_max    = round(max(ar_on), 3),
    .groups = "drop"
  ) |>
knitr::kable(caption = "Nadir and 24-h total bacterial count plus peak AR_on after a single dynamic gentamicin dose. The 16 mg/L peak drives AR_on close to its saturation of 1, so a subsequent dose would face strongly reduced E_max (Mohamed 2012 Fig 2C resistance development).")| Cmax_mgL | nadir_log10 | at_24h_log10 | ar_on_max |
|---|---|---|---|
| 2.0 | 3.35 | 8.89 | 0.338 |
| 3.9 | 1.68 | 8.87 | 0.534 |
| 7.8 | 0.36 | 8.74 | 0.741 |
| 16.0 | 0.00 | 8.68 | 0.887 |
Adaptive-resistance trajectory under a saturating dose
A single 16 mg/L peak (the highest dynamic experiment in Fig 2B)
drives ar_on past 0.5 within ~1 h, demonstrating that
gentamicin rapidly induces adaptive resistance even as it kills
bacteria. After the gentamicin declines (via the two-phase in-vitro PK),
ar_on falls back through koff with a
characteristic half-life of ln(2)/0.0139 = 50 h (paper’s fixed
value).
ar_run <- sim_dyn |> filter(Cmax_mgL == 16)
ggplot(ar_run, aes(time)) +
  geom_line(aes(y = ar_on, colour = "ar_on"), linewidth = 1) +
  geom_line(aes(y = cgent / 16, colour = "cgent / 16 (mg/L)"), linewidth = 0.6, linetype = 2) +
  labs(x = "Time (h)", y = "AR_on (solid) or scaled cgent (dashed)",
       colour = NULL,
       title = "Adaptive-resistance development under a 16 mg/L peak (Fig 2B context)")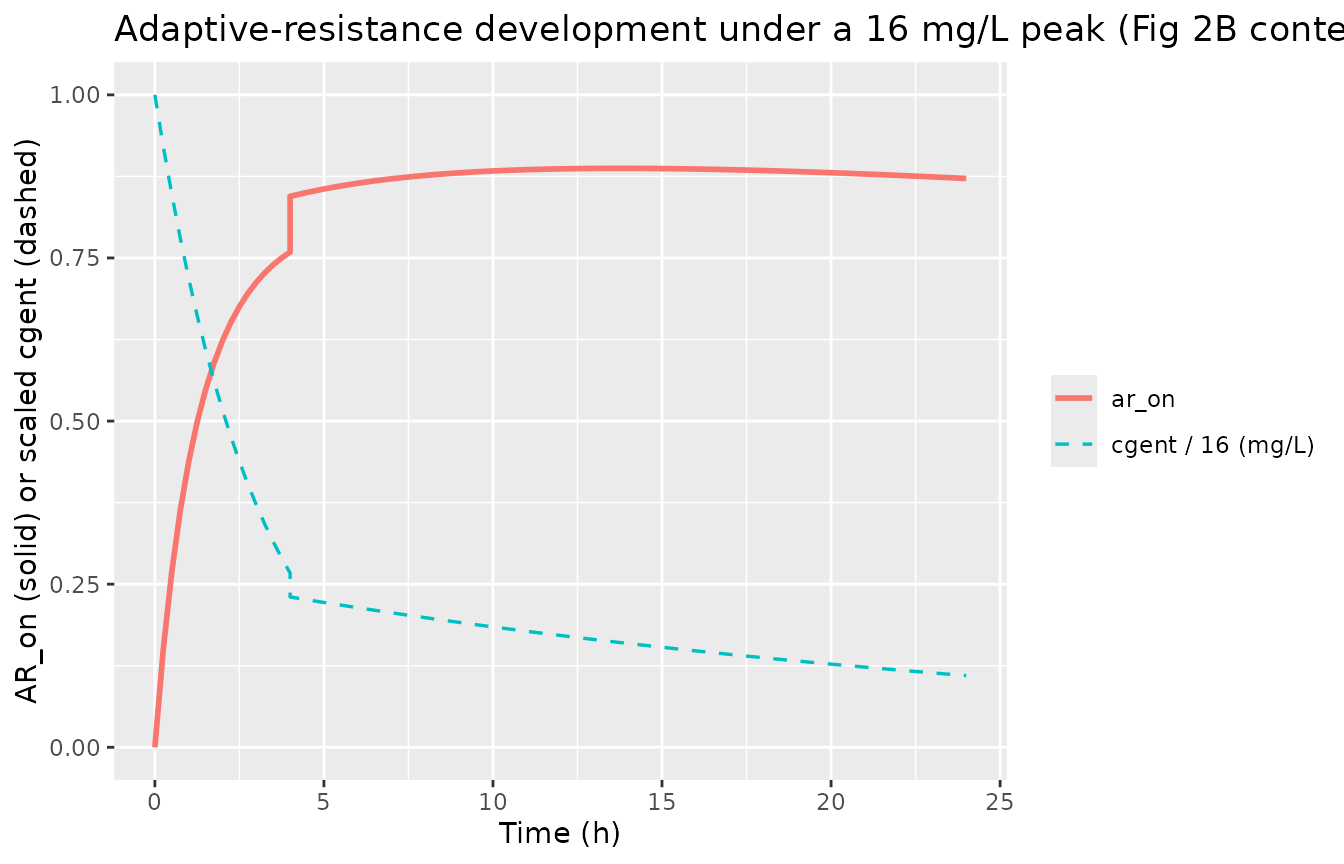
Assumptions and deviations
-
Model class / species. This is an in-vitro
semi-mechanistic PKPD model, not a popPK model;
population$speciesrecords the E. coli ATCC 25922 isolate. No PKNCA validation is performed (there is no drug NCA to compute); the mechanistic checks above replace it. -
File naming. The dispatch metadata listed the drug
as “Antimicrobial Agents and Chemo”, which is the journal name
(Antimicrobial Agents and Chemotherapy), not a drug. The paper
unambiguously models gentamicin, so the model file and this vignette use
Mohamed_2012_gentamicin. - Final model. Parameters are the final population-mean estimates from Table 1; alternative AR formulations explored in the paper (time-and-concn EC50 of Tam et al. 2005, turnover EC50, third bacterial compartment) all gave higher OFV and are not packaged.
-
Fixed parameters.
kdeath = 0.179 /his carried over from Nielsen 2007 (ref 36 in the paper).koff = 0.0139 /hwas fixed at the lowest value that did not worsen OFV (the data only weakly identify the return-to-susceptibility rate). Both are wrapped infixed()inini().lkel = log(0.037)is the default (dynamic phase-2, the neonatal terminal kel); passparams = c(lkel = log(1e-12))to replicate static experiments (no decline) or override tolog(0.33)thenlog(0.037)to replicate the dynamic in-vitro kinetic system (see the Fig 2B chunk). -
In-vitro flask elimination. The gentamicin
concentration is a state variable; the user adds gentamicin via dosing
events. For dynamic experiments the paper used two flow-rate phases
(0.33 /h for the first 4 h, then 0.037 /h thereafter) to mimic
preterm-neonate kinetics. We replicate this by splitting the simulation
into two segments rather than coding a piecewise
kelinto the ODE, so the model file stays general for any user-supplied PK driver. -
Initial inoculum.
s0 = 4.83e5 CFU/mLis the average across all experimental start inocula (Methods) and the value the paper used for its dosing-schedule predictions. The high-inoculum subset (12 h pre-growth to ~1e9 CFU/mL) used to study the inoculum effect is not packaged as a separate scenario; users can simulate it by changings0or by initializingbact_restingnon-zero. -
Three residual-error magnitudes were estimated.
Mohamed 2012 fit
RE_static = 1.69,RE_dynamic = 2.80, and a replicate-specificRRE = 0.618(all on the natural-log scale; Methods + Table 1). The model file shipsaddSd = 1.69(RE_static) as the single residual error because the conditionalRE_static | RE_dynamicswitch would require a new experiment-type covariate. For VPC-style simulation against dynamic experiments, scaleaddSdto 2.80 at rxSolve time. -
No inter-experiment variability. The paper did not
estimate inter-experiment variability (“interexperimental variability
was not estimated”); accordingly the model file has no
eta*IIV terms. -
k_SR breakpoint discontinuity. Mohamed defines
k_SRas zero below the estimated bacterial-count breakpointBPand a linear function above it. This is encoded with the indicator(total_bact > bp), which is a hard discontinuity in the right-hand side. Passmaxsteps = 1e5torxSolvefor robust integration through the threshold; the bundled simulations all do. - High-inoculum-effect overprediction. For the auxiliary 12-h-grown high-inoculum experiments (Fig 3C in the paper), the model overpredicts killing at 2 and 4 mg/L. This is a documented model limitation – the model does not represent the inoculum effect on susceptibility; the high-inoculum subset is not validated in this vignette.
-
Upstream popPK is out of scope. The paper’s
neonatal dosing-schedule predictions (Figs 4-6) linked this PD model to
a separate 3-compartment popPK developed in Nielsen 2011 (ref 35). That
popPK is not packaged here. Users wishing to reproduce the neonatal
predictions should drive
cgentwith the upstream popPK output. -
Convention deviations
(
checkModelConventions()warnings, no errors). All are expected for an in-vitro mechanism-based PKPD model: (a) the bacterial-state (bact_growing,bact_resting), adaptive-resistance (ar_off,ar_on), and gentamicin-concentration (cgent) compartments are paper-mechanistic, declared viapaper_specific_compartment_pattern;- the single observation
Cccarries a non-PK output (natural log of total viable count, not a drug concentration); (c) the dosing/concentration units are bothmg/Lbecause the antibiotic input is a concentration in the in-vitro system.
- the single observation