Time-varying covariates (Wahlby 2004)
Source:vignettes/articles/Wahlby_2004_time_varying_covariates.Rmd
Wahlby_2004_time_varying_covariates.RmdPaper and methodology
Wahlby, Thomson, Milligan, Karlsson (2004) propose two extensions to the standard covariate-modeling approach for population PK/PD analysis when the covariate is time-varying within an individual.
The first extension splits the standard covariate effect into a
between-subject component (the baseline value BCOV,
time-fixed per subject) and a within-subject component
(DCOV = COV - BCOV, time-varying delta). The standard
covariate model
P_pop = theta_p * [1 + theta_COV * (COV - COV_median)]
becomes
P_pop = theta_p * [1 + theta_BCOV * (BCOV - BCOV_median) + theta_DCOV * DCOV].
The second extension adds inter-individual variability to the covariate-effect coefficient itself
P_i = theta_p * [1 + theta_COV * exp(eta_COV_i) * (COV - COV_median)] * exp(eta_P_i),
allowing the magnitude of the covariate effect to differ between subjects.
The paper applies these models to four previously-analyzed datasets
to demonstrate their utility. nlmixr2lib bundles each of the four
final-model configurations as a separate modellib()
entry:
| File | Drug / endpoint | Cohort |
|---|---|---|
Wahlby_2004_gentamicin |
Gentamicin popPK | Cancer adults |
Wahlby_2004_pefloxacin |
Pefloxacin popPK | Critically ill |
Wahlby_2004_voriconazole |
Voriconazole popPK | Pediatric |
Wahlby_2004_paclitaxel_myelosuppression |
Paclitaxel myelosuppression PD (ANC) | Cancer adults |
The structural PK / PD models for each cohort are inherited from the
cited primary publications (Rosario 1998 gentamicin; Karlsson 1993
pefloxacin; Walsh 2004 voriconazole; Friberg 2002 paclitaxel
myelosuppression). The Friberg 2002 paclitaxel PK / myelosuppression
model is already packaged separately as
modellib("Friberg_2002_paclitaxel"); the other three
primary papers are queued for separate extraction.
Source trace
The per-parameter origin is recorded as an in-file comment next to
every ini() entry in each model file. The table below
summarises the source location for the final-model parameter
estimates.
| Parameter group | Source location |
|---|---|
| Gentamicin Eq 4 (CL ~ CRCL) | Wahlby 2004 Eq 4, p. 369 (Reference Model) |
| Gentamicin Eq 5 (V1 ~ BSA, ALB) | Wahlby 2004 Eq 5, p. 369 (Reference Model) |
| Gentamicin final estimates | Wahlby 2004 Table 5, Final-Model column |
| Pefloxacin Eq 6 (CL covariates) | Wahlby 2004 Eq 6, p. 369 |
| Pefloxacin final estimates | Wahlby 2004 Table 6, Final-Model column |
| Voriconazole Eq 7 (CL covariates) | Wahlby 2004 Eq 7, p. 370 |
| Voriconazole final estimates | Wahlby 2004 Table 7, Final-Model column |
| Paclitaxel myelosuppression | Wahlby 2004 Table 8, Final-Model column |
Gentamicin: simulation
The gentamicin model demonstrates the BCOV / DCOV split on creatinine
clearance (CRCL time-varying, CRCL_BASE
per-subject baseline) and a baseline-only BSA effect on V1 paired with a
time-varying albumin effect.
mod_gent <- readModelDb("Wahlby_2004_gentamicin")
set.seed(20040401)

n_subj <- 50L
times  <- c(0, 1, 2, 4, 6, 8, 12, 24, 36, 48)

gent_cohort <- tibble(
  id        = seq_len(n_subj),
  CRCL_BASE = round(runif(n_subj, 30, 130), 1),
  BSA_BASE  = round(runif(n_subj, 1.4, 2.1), 2),
  ALB_BASE  = round(runif(n_subj, 25, 42), 1)
)

gent_evt <- gent_cohort |>
  rowwise() |>
  do({
    sub <- .
    drift_clc <- rnorm(length(times), 0, 10)
    drift_alb <- rnorm(length(times), 0, 2)
    rec <- tibble(
      id   = sub$id,
      time = times,
      CRCL = pmax(5, sub$CRCL_BASE + cumsum(drift_clc) * 0.1),
      ALB  = pmax(10, sub$ALB_BASE + cumsum(drift_alb) * 0.1),
      CRCL_BASE = sub$CRCL_BASE,
      BSA_BASE  = sub$BSA_BASE,
      evid = 0,
      amt  = 0
    )
    dose <- tibble(
      id = sub$id, time = 0,
      CRCL = sub$CRCL_BASE, ALB = sub$ALB_BASE,
      CRCL_BASE = sub$CRCL_BASE, BSA_BASE = sub$BSA_BASE,
      evid = 1, amt = 120
    )
    bind_rows(dose, rec) |> arrange(time)
  }) |>
  ungroup()
sim_gent <- rxode2::rxSolve(mod_gent, events = gent_evt)
#> ℹ parameter labels from comments will be replaced by 'label()'

sim_gent |>
  as.data.frame() |>
  ggplot(aes(time, Cc, group = id)) +
  geom_line(alpha = 0.3) +
  scale_y_log10() +
  labs(x = "Time (h)", y = "Cc (mg/L)",
       title = "Gentamicin: VPC across 50 virtual subjects",
       caption = "Demonstrates Wahlby 2004 BCOV/DCOV split applied to gentamicin CL")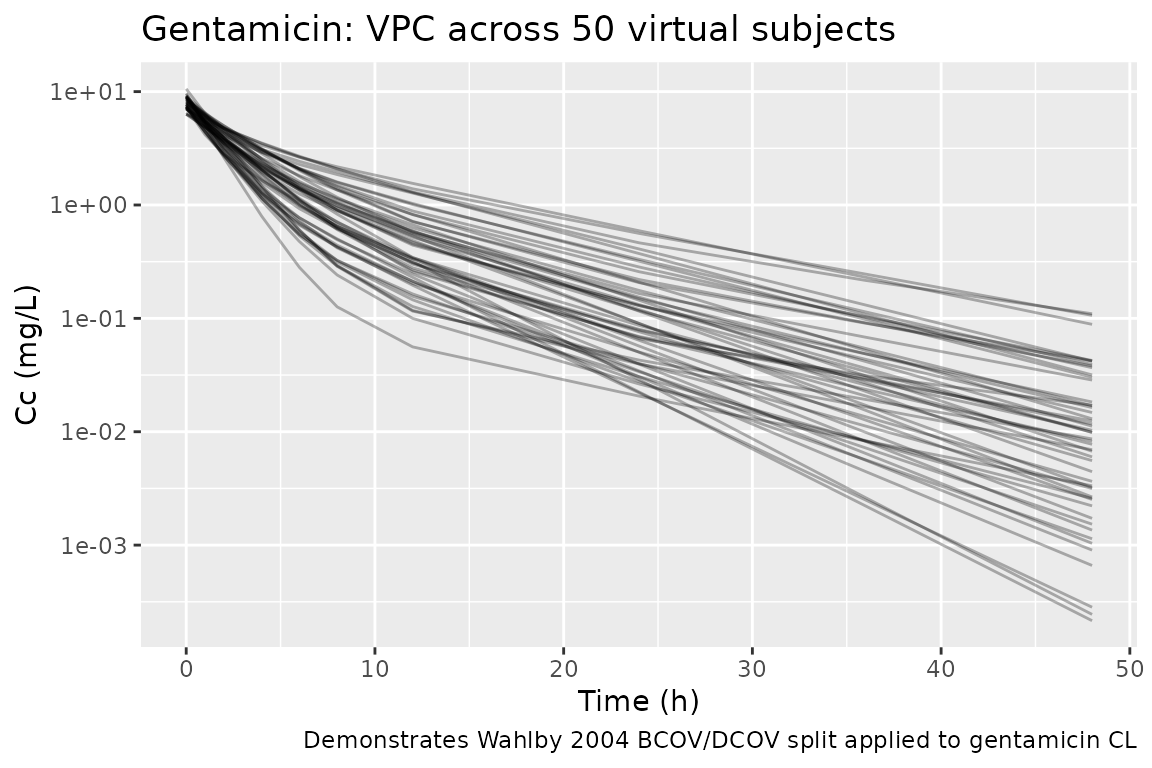
Simulated gentamicin concentrations after a 120 mg IV bolus across 50 virtual subjects with time-varying CRCL and ALB.
Pefloxacin: typical-value prediction
The pefloxacin model illustrates the BCOV / DCOV pattern applied to
bilirubin (TBILI_BASE replaces TBILI in the
final CL equation) and to baseline weight (WT_BASE with a
“saturating up to median WT” qualifier), with inter-individual
variability in the CRCL effect coefficient (Wahlby 2004 Eq 3
demonstrated on pefloxacin).
mod_pef <- readModelDb("Wahlby_2004_pefloxacin")
mod_pef_typ <- rxode2::zeroRe(mod_pef)
#> ℹ parameter labels from comments will be replaced by 'label()'
pef_cohort <- tibble(
  id         = 1:3,
  treatment  = c("normal renal", "mild renal impairment", "severe renal impairment"),
  CRCL_BASE  = c(110, 60, 25),
  WT_BASE    = c(70, 70, 70),
  TBILI_BASE = c(15, 15, 30),
  CEN        = 0,
  AGE        = 55
)

pef_times <- seq(0, 24, by = 1)
pef_evt <- pef_cohort |>
  rowwise() |>
  do({
    sub <- .
    rec <- tibble(
      id = sub$id, time = pef_times, evid = 0, amt = 0,
      CRCL = sub$CRCL_BASE, WT = sub$WT_BASE,
      TBILI = sub$TBILI_BASE,
      CRCL_BASE = sub$CRCL_BASE, WT_BASE = sub$WT_BASE,
      TBILI_BASE = sub$TBILI_BASE, CEN = sub$CEN, AGE = sub$AGE,
      treatment = sub$treatment
    )
    dose <- tibble(
      id = sub$id, time = 0, evid = 1, amt = 400,
      CRCL = sub$CRCL_BASE, WT = sub$WT_BASE,
      TBILI = sub$TBILI_BASE,
      CRCL_BASE = sub$CRCL_BASE, WT_BASE = sub$WT_BASE,
      TBILI_BASE = sub$TBILI_BASE, CEN = sub$CEN, AGE = sub$AGE,
      treatment = sub$treatment
    )
    bind_rows(dose, rec) |> arrange(time)
  }) |>
  ungroup()
sim_pef <- rxode2::rxSolve(mod_pef_typ, events = pef_evt,
                           keep = c("treatment")) |>
  as.data.frame()
#> ℹ omega/sigma items treated as zero: 'etae_crcl_cl', 'etalcl'
#> Warning: multi-subject simulation without without 'omega'

sim_pef |>
  ggplot(aes(time, Cc, color = treatment)) +
  geom_line(linewidth = 0.8) +
  scale_y_log10() +
  labs(x = "Time (h)", y = "Cc (mg/L)",
       title = "Pefloxacin: BBIL / BWT / CRCL covariate effects (typical values)",
       color = NULL)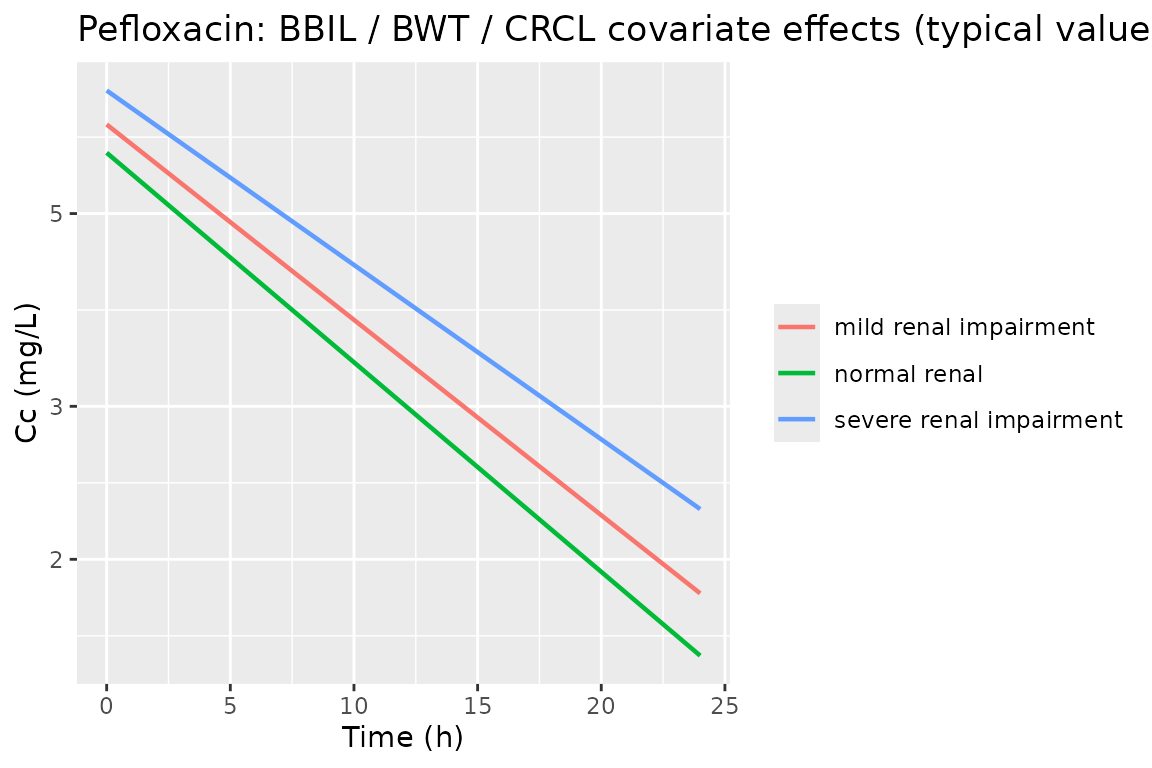
Typical-value pefloxacin concentration profiles by baseline renal function.
Voriconazole: typical-value prediction
The voriconazole model uses linear (not allometric) body-weight
scaling on all disposition parameters and demonstrates the log-ratio
form of the DCOV effect (log(ALP / ALP_BASE) in lieu of a
linear delta, which avoids the log-of-negative problem when ALP falls
below baseline).
mod_vori <- readModelDb("Wahlby_2004_voriconazole")
mod_vori_typ <- rxode2::zeroRe(mod_vori)
#> ℹ parameter labels from comments will be replaced by 'label()'
vori_cohort <- tibble(
  id             = 1:3,
  treatment      = c("EM (CYP2C19 *1/*1)", "non-EM (carrier)", "non-EM, high ALP"),
  WT             = c(20, 20, 20),
  ALT            = c(25, 25, 25),
  ALP            = c(136, 136, 250),
  ALP_BASE       = c(136, 136, 136),
  CYP2C19_NON_EM = c(0, 1, 1)
)

vori_times <- seq(0, 12, by = 0.5)
vori_evt <- vori_cohort |>
  rowwise() |>
  do({
    sub <- .
    rec <- tibble(
      id = sub$id, time = vori_times, evid = 0, amt = 0,
      WT = sub$WT, ALT = sub$ALT, ALP = sub$ALP, ALP_BASE = sub$ALP_BASE,
      CYP2C19_NON_EM = sub$CYP2C19_NON_EM,
      treatment = sub$treatment
    )
    dose <- tibble(
      id = sub$id, time = 0, evid = 1, amt = 80,
      WT = sub$WT, ALT = sub$ALT, ALP = sub$ALP, ALP_BASE = sub$ALP_BASE,
      CYP2C19_NON_EM = sub$CYP2C19_NON_EM,
      treatment = sub$treatment
    )
    bind_rows(dose, rec) |> arrange(time)
  }) |>
  ungroup()
sim_vori <- rxode2::rxSolve(mod_vori_typ, events = vori_evt,
                            keep = c("treatment")) |>
  as.data.frame()
#> ℹ omega/sigma items treated as zero: 'etalcl', 'etae_logalt_cl', 'etae_logdalkp_cl'
#> Warning: multi-subject simulation without without 'omega'

sim_vori |>
  ggplot(aes(time, Cc, color = treatment)) +
  geom_line(linewidth = 0.8) +
  scale_y_log10() +
  labs(x = "Time (h)", y = "Cc (mg/L)",
       title = "Voriconazole: CYP2C19 and ALP effects on CL",
       color = NULL)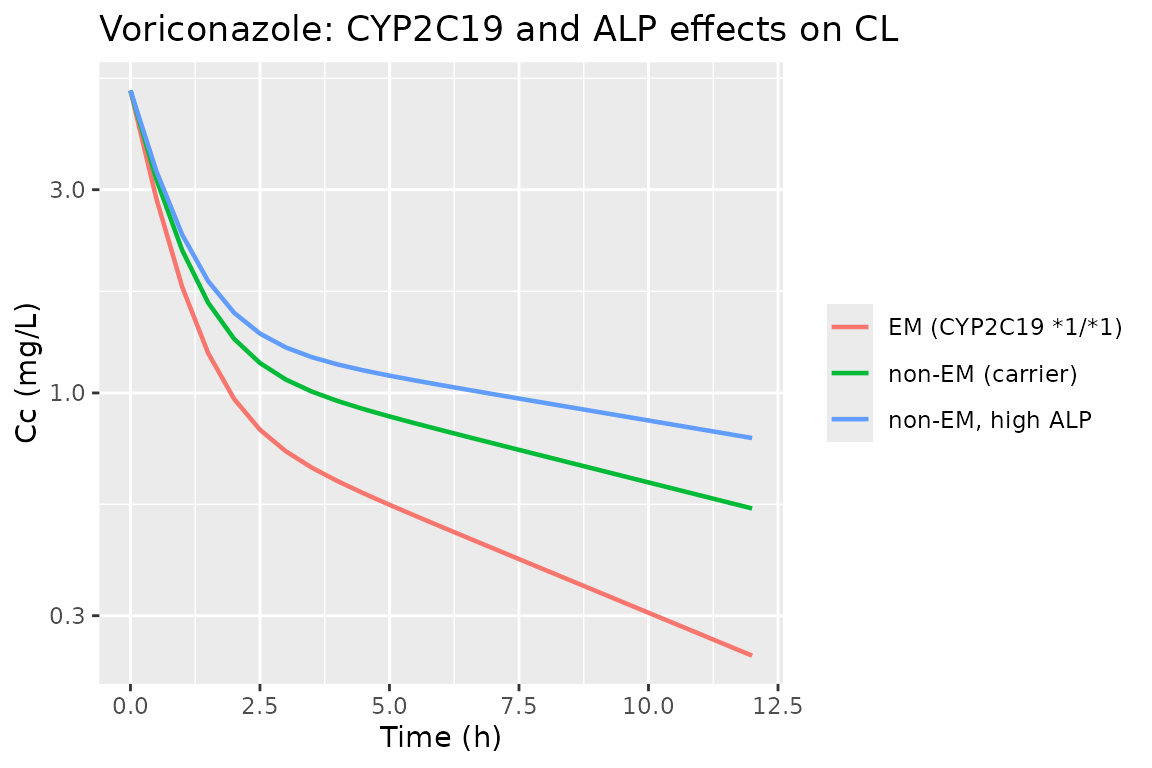
Typical-value voriconazole concentration profiles by CYP2C19 status and ALP elevation.
Paclitaxel myelosuppression: typical-value prediction
The paclitaxel PD model is the Friberg-Karlsson semi-mechanistic neutrophil turnover chain with a bilirubin effect on mean transit time and a delta-bilirubin effect on the linear drug-effect Slope (with IIV in the Slope-DBIL coefficient). Paclitaxel PK is supplied via per-subject empirical-Bayes columns following the Friberg 2002 convention.
mod_pacl <- readModelDb("Wahlby_2004_paclitaxel_myelosuppression")
mod_pacl_typ <- rxode2::zeroRe(mod_pacl)
#> ℹ parameter labels from comments will be replaced by 'label()'
pacl_cohort <- tibble(
  id         = 1:3,
  treatment  = c("normal bilirubin", "elevated baseline BIL", "BIL rising over time"),
  CL_INDIV   = 285,
  VC_INDIV   = 290,
  VP_INDIV   = 995,
  TBILI_BASE = c(6, 30, 6)
)

pacl_times <- seq(0, 21 * 24, by = 6)
pacl_evt <- pacl_cohort |>
  rowwise() |>
  do({
    sub <- .
    bil_trend <- if (sub$treatment == "BIL rising over time")
      seq(sub$TBILI_BASE, sub$TBILI_BASE + 25, length.out = length(pacl_times))
    else rep(sub$TBILI_BASE, length(pacl_times))
    rec <- tibble(
      id = sub$id, time = pacl_times, evid = 0, amt = 0, cmt = "circ",
      CL_INDIV = sub$CL_INDIV, VC_INDIV = sub$VC_INDIV, VP_INDIV = sub$VP_INDIV,
      TBILI = bil_trend, TBILI_BASE = sub$TBILI_BASE,
      treatment = sub$treatment
    )
    # 3-hour infusion of paclitaxel: 200 umol over 3 hours -> rate = 66.7 umol/h
    dose <- tibble(
      id = sub$id, time = 0, evid = 1, amt = 200, cmt = "central",
      rate = 200 / 3,
      CL_INDIV = sub$CL_INDIV, VC_INDIV = sub$VC_INDIV, VP_INDIV = sub$VP_INDIV,
      TBILI = sub$TBILI_BASE, TBILI_BASE = sub$TBILI_BASE,
      treatment = sub$treatment
    )
    bind_rows(dose, rec) |> arrange(time)
  }) |>
  ungroup()
sim_pacl <- rxode2::rxSolve(mod_pacl_typ, events = pacl_evt,
                            keep = c("treatment")) |>
  as.data.frame()
#> ℹ omega/sigma items treated as zero: 'etalcirc0', 'etalmtt', 'etalslope', 'etae_dbil_slope'
#> Warning: multi-subject simulation without without 'omega'

sim_pacl |>
  filter(time > 0) |>
  ggplot(aes(time / 24, ANC, color = treatment)) +
  geom_line(linewidth = 0.8) +
  labs(x = "Time (days)", y = "ANC (10^9/L)",
       title = "Paclitaxel myelosuppression: BIL and DBIL effects",
       color = NULL)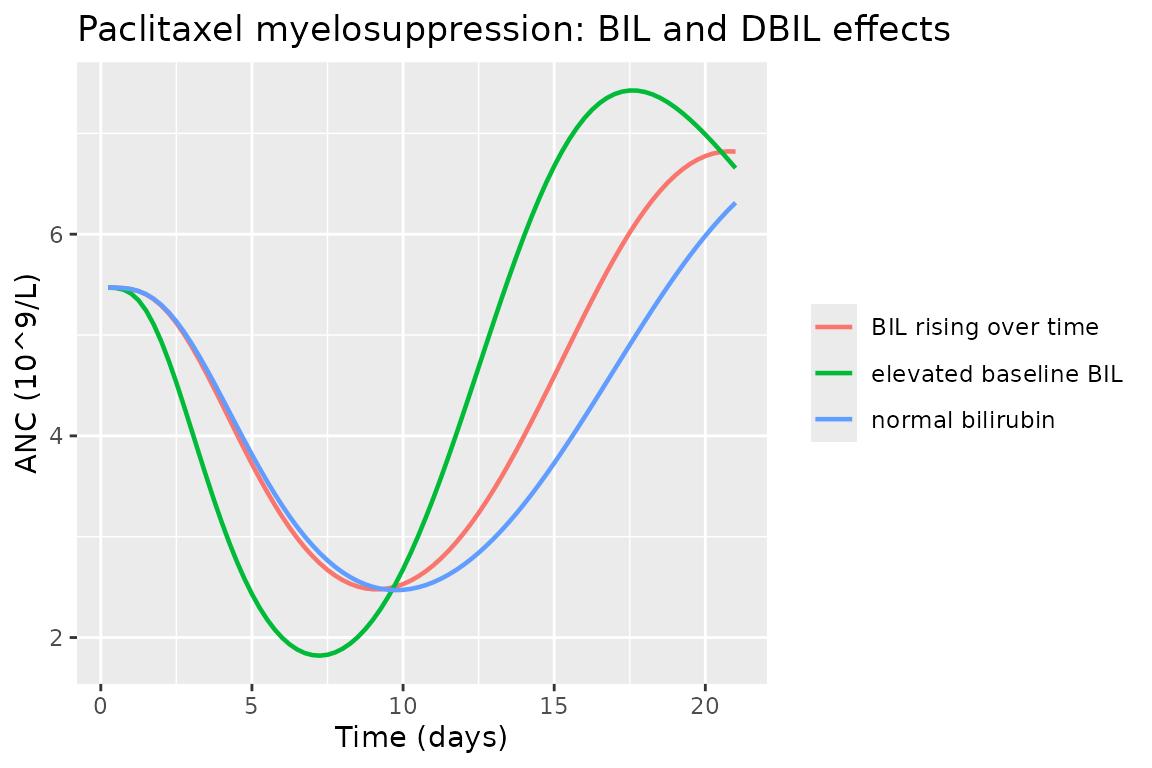
Typical-value neutrophil-count profiles after a single paclitaxel cycle, illustrating the BIL and DBIL covariate effects.
Assumptions and deviations
Several assumptions were necessary because Wahlby 2004 is a
methodology paper that reports final-model parameter estimates for
previously-analyzed cohorts without fully specifying every structural
detail. Cross-reference the in-file comments in each
inst/modeldb/specificDrugs/Wahlby_2004_*.R for the per-line
provenance.
Gentamicin
- The V1 model in the final column of Table 5 is encoded as
V1 = 8.63 * BSA_BASE * (ALB / 34)^-0.41, using the Table 5 footnote a power form rather than the linear approximation in Eq 5. - Time-varying albumin (
ALB) is retained as a canonical column. The Wahlby 2004 final model did not split ALB into BALB / DALB because the BCOV / DCOV decomposition was not supported by the data (Results section). - The cohort demographic detail (age, weight, sex, race) is not reported in Wahlby 2004; the underlying Rosario 1998 popPK paper has the data and should be queued for separate extraction if a full demographic-aware virtual cohort is required.
Pefloxacin
- The Table 6 Final-Model column shows “-” for the typical V value while retaining covariate effects of WT, CRCL, and BIL on V. This entry interprets the dash as “unchanged from the Reference Model column” (theta_V = 61 L) and encodes V with the same exponential covariate form. The underlying Karlsson 1993 paper (the upstream popPK source) is the authoritative reference for the V parameterisation; it is not on disk in this worktree and has been queued for separate extraction.
- The “weight up to median WT” qualifier (Methods) is encoded as
min(WT_BASE, 65)in the CL equation, plateauing the WT effect above 65 kg. This interpretation may differ from the exact Karlsson 1993 NONMEM implementation; users wanting to replicate the source exactly should consult the Karlsson 1993 paper. - The source paper reports inter-occasion variability on CL (pi_CL = 0.32) without an IIV term on CL itself. This entry encodes the variance as IIV on CL (etalcl ~ 0.32^2) to preserve the variance magnitude in single-occasion simulations. Users running a multi-occasion analysis should re-fit with an explicit IOV term.
- The centre indicator
CENhas unspecified semantics in the source paper (Karlsson 1993 did not say which centre corresponds to CEN = 1). Users assembling a virtual cohort should treat CEN as a sensitivity covariate.
Voriconazole
- Equation 7 in the paper reads literally as
CL = theta_CL * WT * [covariate brackets] * [PM * (1 - theta_PM)], which zeroes out CL when PM = 0 (the reference homozygous-EM group) - biologically impossible. This entry encodes the PM term as(1 - theta_PM * CYP2C19_NON_EM), the standard NONMEM equivalent that produces the same value (0.54x) for non-EMs as the published estimate. The literal Eq 7 form is treated as an editorial / OCR artifact. - The paper’s
log(DALKP)term is interpreted aslog(ALP / ALP_BASE)(the within-subject log-ratio), since a literallog(DALKP)with DALKP = ALP - ALP_BASE fails when ALKP decreases below baseline (Table 3 shows DALKP range -101 to 453 IU/L). The log-ratio form is biologically natural and avoids the log-of-negative problem. - The Karlsson 1995 / Karlsson 1998 inter-individual residual-error pattern (sigma varying between individuals with omega_sigma = 0.77) is approximated in this entry by a homoscedastic proportional residual error. Users wanting to replicate the exact Karlsson 1995 residual structure should encode the IIV-on-sigma manually.
- The
CYP2C19_NON_EMindicator is a composite of poor metabolizers and heterozygous-extensive metabolizers; the source paper does not provide separate per-genotype coefficient estimates. A future genotype-aware voriconazole popPK extraction should split into strictCYP2C19_PMandCYP2C19_IMindicators.
Paclitaxel myelosuppression
- The Friberg-Karlsson chain structure (3 transit compartments +
proliferating
- circulating) is carried from the Friberg 2002 paclitaxel paper,
which is already packaged separately as
modellib("Friberg_2002_paclitaxel"). Wahlby 2004 does not re-specify the chain length.
- circulating) is carried from the Friberg 2002 paclitaxel paper,
which is already packaged separately as
- The Q value for the 2-compartment paclitaxel PK is fixed at 204 L/h per the Friberg 2002 convention. Wahlby 2004 does not report Q.
- The observation is
ANC(absolute neutrophil count, 10^9/L) per the paper’s “neutrophil counts monitored” wording. This differs fromFriberg_2002_paclitaxelwhich observes total leukocytes (WBC). - The BIL-MTT effect is encoded with the linear-deviation form
MTT * (1 + e_bil_mtt * (TBILI - 6))centered at the BIL median (6 umol/L, Table 4). The DBIL-Slope effect is encoded with the within-subject delta(TBILI - TBILI_BASE)and includes inter-individual variability on the effect coefficient per Wahlby 2004 Eq 3.
Upstream-paper queue
Three of the four primary popPK / PD models cited by Wahlby 2004 are not yet in nlmixr2lib and should be extracted separately to recover the full structural detail behind each cohort:
- Rosario MC, Thomson AH, Jodrell DI, Sharp CA, Elliott HL. Population pharmacokinetics of gentamicin in patients with cancer. Br J Clin Pharmacol 1998;46(3):229-236. (Gentamicin cohort source.)
- Karlsson MO, Sheiner LB. The importance of modeling interoccasion variability in population pharmacokinetic analyses. J Pharmacokin Biopharm 1993;21(6):735-750. (Pefloxacin cohort source.)
- Walsh TJ, Karlsson MO, Driscoll T, Arguedas AG, Adamson P, Saez-Llorens X, Vora AJ, Arrieta AC, Blumer J, Lutsar I, Milligan P, Wood N. Pharmacokinetics and safety of intravenous voriconazole in children after single- or multiple-dose administration. Antimicrob Agents Chemother 2004;48(6):2166-2172. (Voriconazole cohort source.)
The paclitaxel cohort source (Friberg LE et al. J Clin Oncol
2002;20(24): 4713-4719) is already packaged as
modellib("Friberg_2002_paclitaxel").