Model and source
- Citation: Yang CG, Chen T, Si WT, Wang AH, Ren HC, Wang L. High-performance PBPK model for predicting CYP3A4 induction-mediated drug interactions: a refined and validated approach. Front Pharmacol. 2025;16:1521068. doi:10.3389/fphar.2025.1521068. Disposition parameters are from Table 1 and the deposited GastroPlus compound database (Supplementary Material 2, ‘Rifampicin GastroPlus PK models.mdb’, table Drugs, record ‘Rifampicin-ComPK’).
- Description: PBPK-DDI perpetrator model (GastroPlus 9.7), compartmental disposition layer. Two-compartment intravenous rifampicin model in a 70 kg adult with body-weight-proportional volume and clearance, as deposited in the paper’s GastroPlus compound record ‘Rifampicin-ComPK’. Systemic clearance is the sum of three linear arms: CYP3A4-mediated hepatic metabolism, the remaining hepatic metabolism and renal clearance. The paper’s oral ACAT absorption, its saturable CYP3A4 kinetics, the CYP3A4 induction (EC50/Emax) layer and the 28 victim-drug models are not included (see the vignette). Deterministic typical-value model with no between-subject or residual variability.
- Article: https://doi.org/10.3389/fphar.2025.1521068 (open access, PMC11897275)
Yang and colleagues built a GastroPlus 9.7 PBPK-DDI model for rifampicin as a CYP3A4 inducer, and used it with 28 victim-drug models to predict the AUC and Cmax ratios of CYP3A4 substrates co-administered with rifampicin (Table 3, Figure 3). The rifampicin model is not a whole-body PBPK model: the authors simplified it to a compartmental disposition model (“strategically simplified to a compartmental model”, Discussion), with oral absorption described by GastroPlus’s ACAT gut model.
What this port contains
The paper’s second supplement deposits the GastroPlus compound
database (Rifampicin GastroPlus PK models.mdb). Its record
Rifampicin-ComPK is the compartmental model of Table 1:
central volume 0.15145 L/kg, K12 1.4219 1/h, K21 1.7949 1/h, a linear
“other liver” clearance of 0.0623 L/h/kg and a renal clearance of 0.0169
L/h/kg, all for a 70 kg patient. The Methods add the third clearance
arm, CYP3A4-mediated hepatic metabolism of “about 0.0179 L/h/kg”, and
state that systemic clearance is the sum of the three. Those values
fully specify the intravenous disposition model, which
is what this port implements, with volume and clearance proportional to
body weight as GastroPlus scales per-kg compartmental parameters.
The rest of the paper is not reproduced:
- Oral absorption. The oral arms use GastroPlus’s ACAT model, whose gut physiology (segment volumes, transit times, pH, surface areas) is built into the platform and is neither printed nor deposited. The deposit gives only the drug-side inputs (Peff 1 x 10^-4 cm/s, solubility, particle radius). No first-order absorption rate is available for the paper’s model, so the model has no depot.
- Saturable CYP3A4 kinetics. The CYP3A4 arm is defined in GastroPlus by Michaelis-Menten constants per amount of enzyme, which need the platform’s hepatic and gut CYP3A4 abundances to become a clearance. The paper describes the arm as non-saturated and prints its linear value, which is what this port uses.
- CYP3A4 induction. The induction potency (EC50 0.8 uM) and magnitude (Emax 14.6) are printed, but GastroPlus applies them to a dynamic enzyme-turnover model whose degradation rate constants and driving concentration are platform settings. Without them neither rifampicin’s autoinduction nor its effect on a victim drug can be rebuilt.
- Victim drugs. The 28 victim-drug models are described only through validation figures (Supplementary Material 1); their parameters are not published.
Population
No individual data were fitted. The disposition parameters were calculated with the GastroPlus PKPlus module from published mean plasma profiles after intravenous rifampicin, and the model was checked against mean profiles after 600 mg IV, 200 and 400 mg single oral doses and 600 mg once daily oral dosing in healthy volunteers (Figure 2, Table 2; Acocella 1978, Loos 1985, Peloquin 1997). The deposited compound record uses a 70 kg patient, which is the reference weight here.
Source trace
| Quantity | Value | Source |
|---|---|---|
| Structure | 2-compartment, IV dosing into central | Figure 1; Discussion; Supplementary Material 1 ‘Distribution’ |
lvc |
log(0.15145) L/kg | Table 1 ‘Vc’; mdb Drugs.VolumeDistribution
(Rifampicin-ComPK) |
lk12 |
log(1.4219) 1/h | Table 1 ‘K12’; mdb Drugs.Kcp
|
lk21 |
log(1.7949) 1/h | Table 1 ‘K21’; mdb Drugs.Kpc
|
lcl_3a4 |
log(0.0179) L/h/kg | Methods, ‘PBPK model of rifampicin and model validation’ |
cl_other |
0.0623 L/h/kg (derived) | Table 1 ‘Other liver CL’; mdb Drugs.CLperKg
|
lcl_renal |
log(0.0169) L/h/kg | Table 1 ‘Renal CL’; mdb Drugs.CLr
|
lcl |
log(0.0971) L/h/kg | Methods: sum of the three arms above |
| Reference weight | 70 kg | mdb Drugs.PatientWeight
|
| Validation targets | Predicted NCA, 600 mg IV | Table 2 |
Simulation: 600 mg intravenous
The deposit contains enzyme records for both a 1-hour and a 2-hour 600 mg infusion. Table 2 reports a predicted Tmax of 1 h (observed 1.06 h), so the 1-hour infusion is the one that matches the published predictions; the 2-hour infusion is shown for comparison.
mod <- readModelDb("Yang_2025_rifampicin")

obs_times <- sort(unique(c(seq(0, 2, by = 0.05), seq(2.25, 24, by = 0.25))))
make_events <- function(id, dur) {
  dose <- data.frame(
    id = id, time = 0, amt = 600, rate = 600 / dur, evid = 1,
    cmt = "central", WT = 70
  )
  obs <- data.frame(
    id = id, time = obs_times, amt = 0, rate = 0, evid = 0,
    cmt = "central", WT = 70
  )
  bind_rows(dose, obs)
}
events <- bind_rows(make_events(1L, 1), make_events(2L, 2)) |>
  arrange(id, time, desc(evid))

sim <- rxode2::rxSolve(mod, events = events, returnType = "data.frame") |>
  mutate(treatment = ifelse(id == 1, "600 mg IV, 1-h infusion", "600 mg IV, 2-h infusion"))
ggplot(sim, aes(time, Cc, colour = treatment)) +
  geom_line() +
  labs(x = "Time (h)", y = "Rifampicin plasma concentration (ug/mL)", colour = NULL) +
  theme_bw() +
  theme(legend.position = "bottom")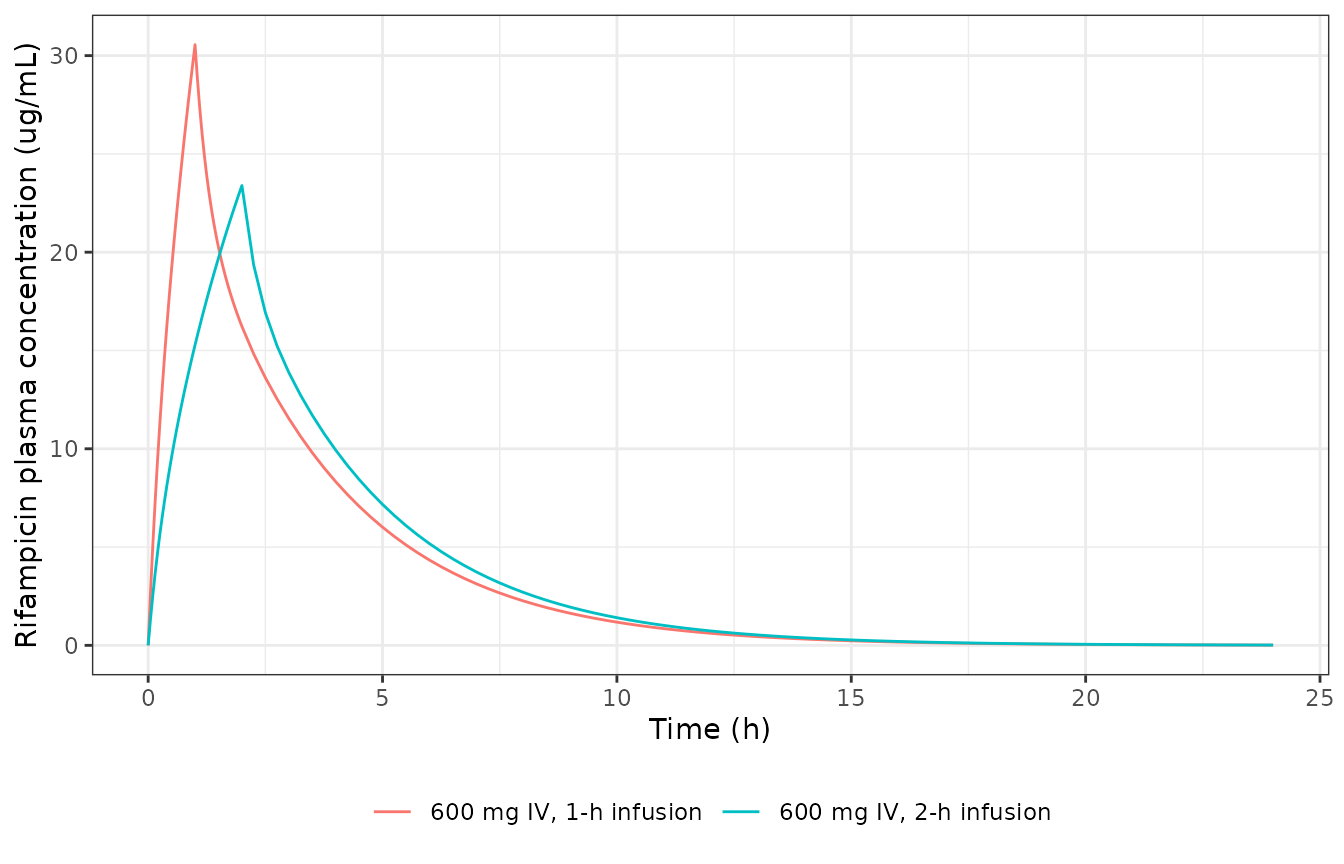
Replicates Figure 2A of Yang 2025: rifampicin plasma concentration after a single 600 mg intravenous dose (typical 70 kg patient).
PKNCA validation against Table 2
Table 2 reports the NCA of the GastroPlus-predicted IV profile. The
“V (L)” row is compared with the steady-state volume from PKNCA
(vss.iv.obs, CL x MRT with the mean residence time
corrected for the 1-hour infusion); the table does not say which volume
it reports, and the terminal volume of this model (about 20.9 L) lies
further from it.
iv1 <- sim |> filter(id == 1)
conc_obj <- PKNCA::PKNCAconc(
  iv1 |> filter(!is.na(Cc)),
  Cc ~ time | treatment + id
)
dose_obj <- PKNCA::PKNCAdose(
  data.frame(treatment = "600 mg IV, 1-h infusion", id = 1L, time = 0, dose = 600, duration = 1),
  dose ~ time | treatment + id,
  route = "intravascular",
  duration = "duration"
)
nca_res <- PKNCA::pk.nca(PKNCA::PKNCAdata(
  conc_obj, dose_obj,
  intervals = data.frame(
    start = 0, end = Inf, cmax = TRUE, tmax = TRUE, aucinf.obs = TRUE,
    half.life = TRUE, cl.obs = TRUE, vss.iv.obs = TRUE
  )
))
sim_nca <- as.data.frame(nca_res) |>
  filter(PPTESTCD %in% c("cmax", "tmax", "aucinf.obs", "half.life", "cl.obs", "vss.iv.obs")) |>
  select(treatment, PPTESTCD, PPORRES)

ref_nca <- data.frame(
  treatment = "600 mg IV, 1-h infusion",
  cmax = 31.9, tmax = 1, aucinf.obs = 93.73, half.life = 2.22,
  cl.obs = 6.24, vss.iv.obs = 18.28
)

cmp <- nlmixr2lib::ncaComparisonTable(
  sim_nca, ref_nca,
  by = "treatment",
  units = c(
    cmax = "ug/mL", tmax = "h", aucinf.obs = "ug*h/mL", half.life = "h",
    cl.obs = "L/h", vss.iv.obs = "L"
  ),
  tolerance_pct = 20
)
knitr::kable(cmp, caption = attr(cmp, "footnote"))| NCA parameter | treatment | Reference | Simulated | % diff |
|---|---|---|---|---|
| Cmax (ug/mL) | 600 mg IV, 1-h infusion | 31.9 | 30.6 | -4.2% |
| Tmax (h) | 600 mg IV, 1-h infusion | 1 | 1 | +0.0% |
| AUC0-∞ (obs) (ug*h/mL) | 600 mg IV, 1-h infusion | 93.7 | 88.3 | -5.8% |
| t½ (h) | 600 mg IV, 1-h infusion | 2.22 | 2.12 | -4.6% |
| CL/F (L/h) | 600 mg IV, 1-h infusion | 6.24 | 6.8 | +8.9% |
| Vss (IV) (L) | 600 mg IV, 1-h infusion | 18.3 | 19 | +3.9% |
pct <- sim_nca |>
  inner_join(
    tidyr::pivot_longer(ref_nca, -treatment, names_to = "PPTESTCD", values_to = "ref"),
    by = c("treatment", "PPTESTCD")
  ) |>
  mutate(pct = 100 * (PPORRES - ref) / ref)
cl_sim <- pct$PPORRES[pct$PPTESTCD == "cl.obs"]
stopifnot(
  # Closed form: a linear model's NCA clearance equals the summed clearance
  # arms (0.0971 L/h/kg x 70 kg). Same parameters on both sides, so tight.
  abs(cl_sim - 0.0971 * 70) / (0.0971 * 70) < 0.01,
  # The deterministic profile reproduces every published predicted NCA
  # value within 10%.
  all(abs(pct$pct) < 10)
)
Every predicted NCA value is reproduced within 10%: Cmax, AUC and half-life are 4-6% low, Vss is 4% high and clearance is 9% high. Lower exposure and higher clearance than GastroPlus are what a linear CYP3A4 arm would give if the platform’s Michaelis-Menten arm were partly saturated near the end of the infusion; the deposit does not allow that to be checked.
Assumptions and deviations
- Clearance is linear. The CYP3A4 arm is encoded at the paper’s non-saturated value of 0.0179 L/h/kg rather than through Michaelis-Menten kinetics (see “What this port contains”).
- Km and Vmax labels in Table 1. Table 1 prints Km = 0.028 mg/L and Vmax = 13.33 mg/s, whereas the deposited enzyme records carry Vmax = 0.028 and Km = 13.33 for every rifampicin scenario. A Km of 13.33 mg/L is consistent with the paper’s statement that the arm is non-saturated at therapeutic concentrations; the Table 1 labels appear to be transposed. Neither value enters this model.
- Additive clearance arms. The Methods list three components of the system clearance; this port sums them. Treating the renal clearance as part of the 0.0623 L/h/kg instead would give an AUC 14% above Table 2’s prediction, against 6% below for the additive reading.
-
Body-weight scaling. Volume and clearances are per
kg and scale linearly with
WT, with 70 kg as the reference (the depositedPatientWeight). Figure 2D notes that the paper’s simulations used study-specific demographics, which are not reported. - Oral arms are not reproducible from the disposition parameters. Table 2’s predicted oral AUCs (49.6 ug*h/mL after 200 mg, 59.41 after 400 mg) imply an apparent bioavailability above 1 for the 200 mg arm against the 70 kg intravenous clearance, so the paper simulated each oral arm in its own study-matched virtual population. Those populations and the ACAT gut physiology are not reported in the paper or its supplement.
- No variability. The paper reports GastroPlus population-simulation quantiles (Figure 2) but no between-subject variances; the model is a deterministic typical-value model.
- No erratum was found (CrossRef and Europe PMC, checked 2026-11-03).