Tacrolimus (Huang 2022)
Source:vignettes/articles/Huang_2022_tacrolimus.Rmd
Huang_2022_tacrolimus.RmdModel and source
- Citation: Huang Q, Lin X, Wang Y, Chen X, Zheng W, Zhong X, Shang D, Huang M, Gao X, Deng H, Li J, Zeng F, Mo X. Tacrolimus pharmacokinetics in pediatric nephrotic syndrome: A combination of population pharmacokinetic modelling and machine learning approaches to improve individual prediction. Front Pharmacol. 2022;13:942129. doi:10.3389/fphar.2022.942129
- Description: One-compartment population PK model with first-order absorption and first-order elimination for oral tacrolimus whole-blood concentrations in Chinese children with steroid-resistant or steroid-dependent (refractory) nephrotic syndrome (Huang 2022). The absorption rate constant ka is fixed at 4.48 1/h from earlier paediatric tacrolimus models. Apparent oral clearance CL/F is a power function of age (reference 5.3 years) with exponential effects of the CTLA4 rs4553808 GA and AA genotypes (reference GG), CYP3A53/3 non-expresser status and concomitant Wuzhi capsule. Apparent volume V/F has no covariates. Exponential IIV on CL/F and V/F; proportional residual error.
- Article: https://doi.org/10.3389/fphar.2022.942129 (open access, PMC9706003)
Huang et al. (2022) fitted a population PK model to routine whole-blood tacrolimus concentrations from children with refractory nephrotic syndrome in Phoenix NLME (FOCE-ELS), then fed the retained covariates to six machine-learning regressions of the individual clearance. Only the population PK model is packaged here; the machine-learning models (Table 4) are regressions on the Bayesian clearance estimates and are not reported in a form that can be reproduced. The final model (Results, Eqs. 1-2) is
- V/F (L) = 192.03 x exp(eta_V)
- CL/F (L/h) = 10.54 x (AGE/5.3)^0.31 x exp(-0.34 x CTLA4 GA) x exp(-0.15 x CTLA4 AA) x exp(-0.25 x CYP3A5*3/*3) x exp(-0.34 x combWZ) x exp(eta_CL)
- Ka = 4.48 1/h (fixed)
where CTLA4 GA and CTLA4 AA are indicators of the rs4553808 genotype (reference GG), CYP3A5*3/*3 = 1 for a CYP3A5 non-expresser, and combWZ = 1 for concomitant Wuzhi capsule (a Schisandra sphenanthera extract that inhibits CYP3A and P-glycoprotein).
Population
139 Chinese children treated at Guangzhou Women and Children’s Medical Center between August 2013 and December 2018 (Table 1): age median 5.3 (range 1.1-15.6) years, weight median 19.7 (9.5-88) kg, serum albumin median 18.3 (7.6-46.8) g/L. Table 1 prints gender as 37 male / 102 female. All had steroid-resistant or steroid-dependent nephrotic syndrome and took oral tacrolimus (Prograf) with prednisone or prednisolone; 6 also took Wuzhi capsule. Starting doses were 500-3000 ug every 12 h, titrated to a trough of 5-10 ug/L. The 432 concentrations are mostly pre-dose troughs, with 35 peak samples at 0.5-3 h post-dose; median concentration 6.48 (2.0-41.2) ug/L. Genotypes (Table 2): CYP3A5 *1/*1 18, *1/*3 58, *3/*3 63; CTLA4 rs4553808 GG 2, GA 29, AA 108.
Source trace
| Element | Value | Source |
|---|---|---|
| Structure: 1-compartment, first-order absorption and elimination | – | Methods, Base model; Results |
lka |
4.48 1/h (fixed) | Methods, Base model |
lcl |
10.54 L/h | Table 3 (tvCL); Eq. 2 |
lvc |
192.03 L | Table 3 (tvV); Eq. 1 |
e_age_cl |
0.31, form (AGE/5.3)^theta
|
Table 3 (dCLdAGE); Eq. 2; Methods covariate form |
e_ctla4_ga_cl |
-0.34, form exp(theta * GA)
|
Table 3 (dCLdCTLA4 GA); Eq. 2 |
e_ctla4_aa_cl |
-0.15, form exp(theta * AA)
|
Table 3 (dCldCTLA4 AA); Eq. 2 |
e_cyp3a5_expr_cl |
-0.25, form exp(theta * (1 - CYP3A5_EXPR))
|
Table 3 (dCLdCYP3A5 *3/*3); Eq. 2 |
e_conmed_wuzhi_cl |
-0.34, form exp(theta * combWZ)
|
Table 3 (dCLdCombWZ); Eq. 2 |
Exponential IIV P = TV * exp(eta)
|
– | Methods, Base model |
etalvc |
1.13 (variance) | Table 3 (omega2 V, shrinkage 38.09%) |
etalcl |
0.13 (variance) | Table 3 (omega2 CL, shrinkage 30.02%) |
Residual error Yobs = Ypred * (1 + eps)
|
– | Methods; Results (proportional chosen) |
propSd |
0.2995 | Table 3 (sigma = 29.95%; bootstrap median 0.30) |
| Covariate coding | GA, AA, *3/*3, combWZ = 1 when present, else 0 | Text below Eq. 2 |
Typical CL/F by covariate group
Eq. 2 fixes the typical CL/F of every covariate combination. The
model’s typical-value cl must reproduce it exactly.
mod <- readModelDb("Huang_2022_tacrolimus")
mod_typ <- rxode2::zeroRe(mod)
#> ℹ parameter labels from comments will be replaced by 'label()'

grid <- tidyr::expand_grid(
  ctla4 = c("GG", "GA", "AA"),
  CYP3A5_EXPR = c(1, 0),
  CONMED_WUZHI = c(0, 1),
  AGE = c(2, 5.3, 12)
) |>
  mutate(
    SNP_CTLA4_RS4553808_GA = as.numeric(ctla4 == "GA"),
    SNP_CTLA4_RS4553808_AA = as.numeric(ctla4 == "AA"),
    id = row_number(), time = 1, amt = 0, evid = 0L, cmt = "central"
  )
cl_typ <- rxode2::rxSolve(
  mod_typ,
  events = grid,
  keep = c("ctla4", "CYP3A5_EXPR", "CONMED_WUZHI", "AGE")
) |>
  as.data.frame() |>
  mutate(
    cl_eq2 = 10.54 * (AGE / 5.3)^0.31 *
      exp(-0.34 * (ctla4 == "GA")) * exp(-0.15 * (ctla4 == "AA")) *
      exp(-0.25 * (1 - CYP3A5_EXPR)) * exp(-0.34 * CONMED_WUZHI)
  )
#> ℹ omega/sigma items treated as zero: 'etalvc', 'etalcl'
#> Warning: multi-subject simulation without without 'omega'

cl_typ |>
  filter(AGE == 5.3, CONMED_WUZHI == 0) |>
  mutate(cyp3a5 = ifelse(CYP3A5_EXPR == 1, "expresser", "non-expresser")) |>
  select(ctla4, cyp3a5, cl, cl_eq2) |>
  dplyr::rename(
    "CTLA4 rs4553808" = ctla4, "CYP3A5" = cyp3a5,
    "Model CL/F (L/h)" = cl, "Eq. 2 CL/F (L/h)" = cl_eq2
  ) |>
knitr::kable(digits = 3, caption = "Typical CL/F at 5.3 years without Wuzhi capsule.")| CTLA4 rs4553808 | CYP3A5 | Model CL/F (L/h) | Eq. 2 CL/F (L/h) |
|---|---|---|---|
| GG | expresser | 10.540 | 10.540 |
| GG | non-expresser | 8.209 | 8.209 |
| GA | expresser | 7.502 | 7.502 |
| GA | non-expresser | 5.843 | 5.843 |
| AA | expresser | 9.072 | 9.072 |
| AA | non-expresser | 7.065 | 7.065 |
# Same typical parameters on both sides; the difference is floating-point only.
stopifnot(nrow(cl_typ) == 36, max(abs(cl_typ$cl / cl_typ$cl_eq2 - 1)) < 1e-10)
The CTLA4 effect is not monotone in allele count: GA patients clear
tacrolimus 29% slower than the GG reference (exp(-0.34) =
0.71) and AA patients 14% slower (exp(-0.15) = 0.86). The
GG reference group holds only two patients, so the typical value 10.54
L/h describes a genotype that is rare in this cohort; the typical CL/F
of the most common combination (AA, CYP3A5*3/*3, 5.3 years, no Wuzhi
capsule) is 7.07 L/h, close to the 7.05 L/h of the covariate-free base
model reported in the Results.
age_curve <- tidyr::expand_grid(
  ctla4 = c("GG", "GA", "AA"),
  CYP3A5_EXPR = c(1, 0),
  AGE = seq(1, 16, by = 0.25)
) |>
  mutate(
    SNP_CTLA4_RS4553808_GA = as.numeric(ctla4 == "GA"),
    SNP_CTLA4_RS4553808_AA = as.numeric(ctla4 == "AA"),
    CONMED_WUZHI = 0,
    cyp3a5 = ifelse(CYP3A5_EXPR == 1, "CYP3A5 expresser", "CYP3A5 non-expresser"),
    id = row_number(), time = 1, amt = 0, evid = 0L, cmt = "central"
  )
rxode2::rxSolve(mod_typ, events = age_curve, keep = c("ctla4", "cyp3a5", "AGE")) |>
  as.data.frame() |>
  ggplot(aes(AGE, cl, colour = ctla4)) +
  geom_line() +
  facet_wrap(~cyp3a5) +
  labs(x = "Age (years)", y = "Typical CL/F (L/h)", colour = "CTLA4 rs4553808")
#> ℹ omega/sigma items treated as zero: 'etalvc', 'etalcl'
#> Warning: multi-subject simulation without without 'omega'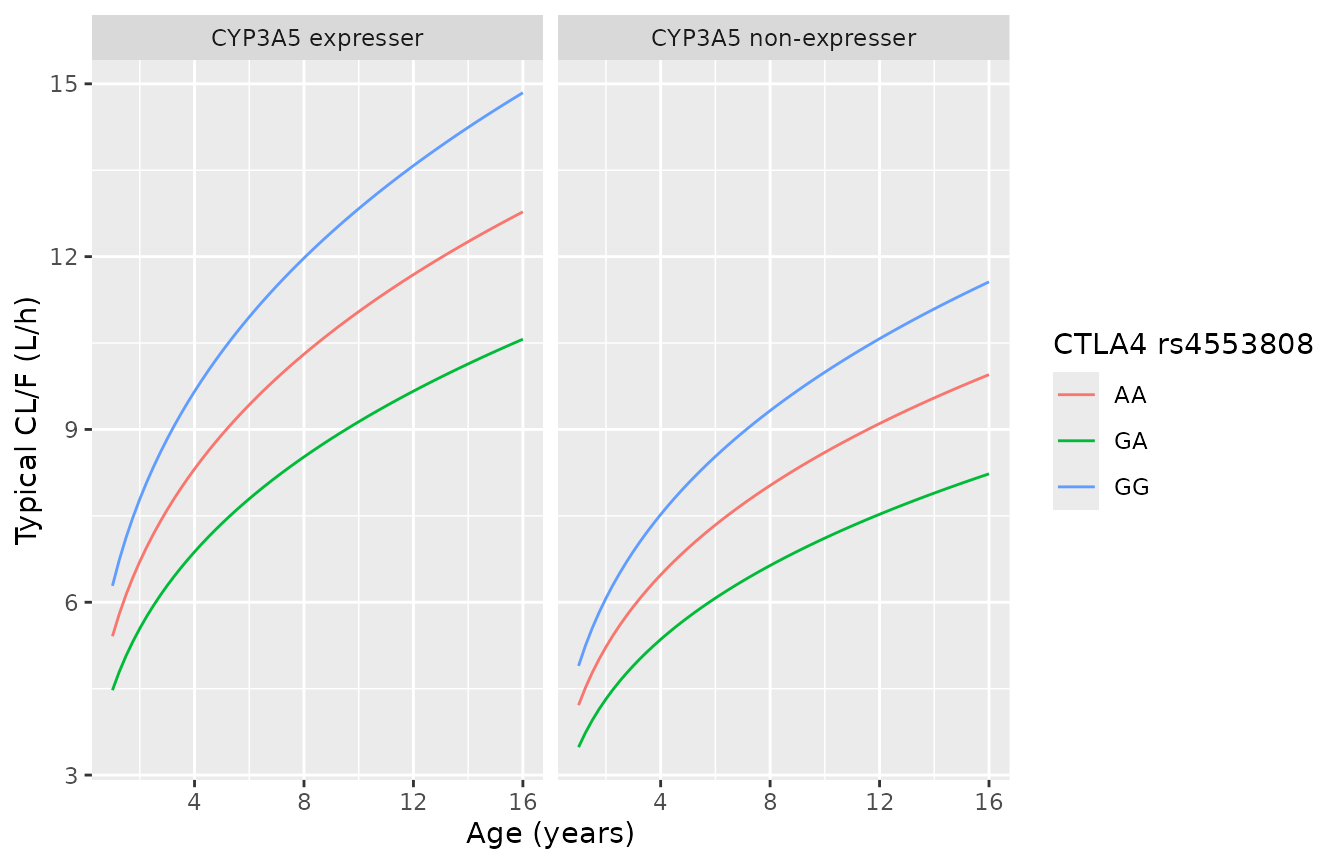
Typical CL/F against age for each CTLA4 genotype and CYP3A5 status, without Wuzhi capsule (Eq. 2).
Dose consistency with the observed troughs
The paper does not tabulate individual doses, so the observed concentrations cannot be compared with a simulation directly. As a structural check, the steady-state trough of the typical patient (5.3 years, CTLA4 AA, CYP3A5*3/*3, no Wuzhi capsule) on 1 mg every 12 h gives the twice-daily dose that patient would need to sit at the cohort’s median concentration of 6.48 ug/L. A mis-transcribed CL/F, V/F or unit would move that dose far outside the 500-3000 ug starting range the Methods report.
tau <- 12
ndose <- 42 # 21 days twice daily, > 25 typical half-lives
t_last <- (ndose - 1) * tau

typ_pt <- data.frame(
  AGE = 5.3, SNP_CTLA4_RS4553808_GA = 0, SNP_CTLA4_RS4553808_AA = 1,
  CYP3A5_EXPR = 0, CONMED_WUZHI = 0
)
ev_typ <- bind_rows(
  data.frame(id = 1L, time = seq(0, by = tau, length.out = ndose), amt = 1, evid = 1L, cmt = "depot"),
  data.frame(id = 1L, time = t_last + tau, amt = 0, evid = 0L, cmt = "central")
) |>
  cbind(typ_pt)
trough_1mg <- rxode2::rxSolve(mod_typ, events = ev_typ) |>
  as.data.frame() |>
  pull(Cc)
#> ℹ omega/sigma items treated as zero: 'etalvc', 'etalcl'
dose_needed <- 6.48 / trough_1mg

tibble(
  quantity = c("Steady-state trough on 1 mg q12h (ng/mL)", "Dose for a 6.48 ng/mL trough (mg q12h)"),
  value = c(trough_1mg, dose_needed)
) |>
  dplyr::rename("Quantity" = quantity, "Value" = value) |>
knitr::kable(digits = 2)| Quantity | Value |
|---|---|
| Steady-state trough on 1 mg q12h (ng/mL) | 9.46 |
| Dose for a 6.48 ng/mL trough (mg q12h) | 0.69 |
stopifnot(dose_needed >= 0.5, dose_needed <= 3)Virtual cohort and concentration-time profile
A cohort of 200 children is simulated with ages drawn log-normally around the 5.3-year median and truncated to the observed 1.1-15.6 years, genotypes drawn at the Table 2 frequencies, and Wuzhi capsule at the Table 1 rate (6/139). Each child takes 1 mg every 12 h for 21 days; the last dosing interval is sampled. The paper’s VPC (Figure 3) is plotted against time since the first dose on a mixed dosing history and is not replicated; the figure below shows the model-predicted spread over one steady-state interval at a fixed dose.
rxode2::rxSetSeed(20221115)
set.seed(20221115)
n_sub <- 200
cohort <- tibble(
  id = seq_len(n_sub),
  AGE = pmin(pmax(exp(rnorm(n_sub, log(5.3), 0.55)), 1.1), 15.6),
  ctla4 = sample(c("GG", "GA", "AA"), n_sub, replace = TRUE, prob = c(2, 29, 108)),
  cyp3a5 = sample(c("*1/*1", "*1/*3", "*3/*3"), n_sub, replace = TRUE, prob = c(18, 58, 63)),
  CONMED_WUZHI = rbinom(n_sub, 1, 6 / 139)
) |>
  mutate(
    SNP_CTLA4_RS4553808_GA = as.numeric(ctla4 == "GA"),
    SNP_CTLA4_RS4553808_AA = as.numeric(ctla4 == "AA"),
    CYP3A5_EXPR = as.numeric(cyp3a5 != "*3/*3"),
    treatment = ifelse(CYP3A5_EXPR == 1, "CYP3A5 expresser", "CYP3A5 non-expresser")
  )

t_obs <- t_last + c(0, 0.25, 0.5, 0.75, 1, 1.5, 2, 3, 4, 6, 8, 10, 12)
ev_cohort <- bind_rows(
  tidyr::expand_grid(id = cohort$id, time = seq(0, by = tau, length.out = ndose)) |>
    mutate(amt = 1, evid = 1L, cmt = "depot"),
  tidyr::expand_grid(id = cohort$id, time = t_obs) |>
    mutate(amt = 0, evid = 0L, cmt = "central")
) |>
  left_join(
    select(cohort, id, AGE, SNP_CTLA4_RS4553808_GA, SNP_CTLA4_RS4553808_AA, CYP3A5_EXPR, CONMED_WUZHI, treatment),
    by = "id"
  ) |>
  arrange(id, time, desc(evid))

sim <- rxode2::rxSolve(mod, events = ev_cohort, keep = "treatment", maxsteps = 1e6) |>
  as.data.frame() |>
  mutate(tad = time - t_last)
#> ℹ parameter labels from comments will be replaced by 'label()'
stopifnot(!anyNA(sim$Cc))
sim |>
  group_by(treatment, tad) |>
  summarise(
    q05 = quantile(Cc, 0.05), q50 = median(Cc), q95 = quantile(Cc, 0.95),
    .groups = "drop"
  ) |>
  ggplot(aes(tad, q50, colour = treatment, fill = treatment)) +
  geom_ribbon(aes(ymin = q05, ymax = q95), alpha = 0.2, colour = NA) +
  geom_line() +
  labs(x = "Time after dose (h)", y = "Tacrolimus (ng/mL)", colour = NULL, fill = NULL)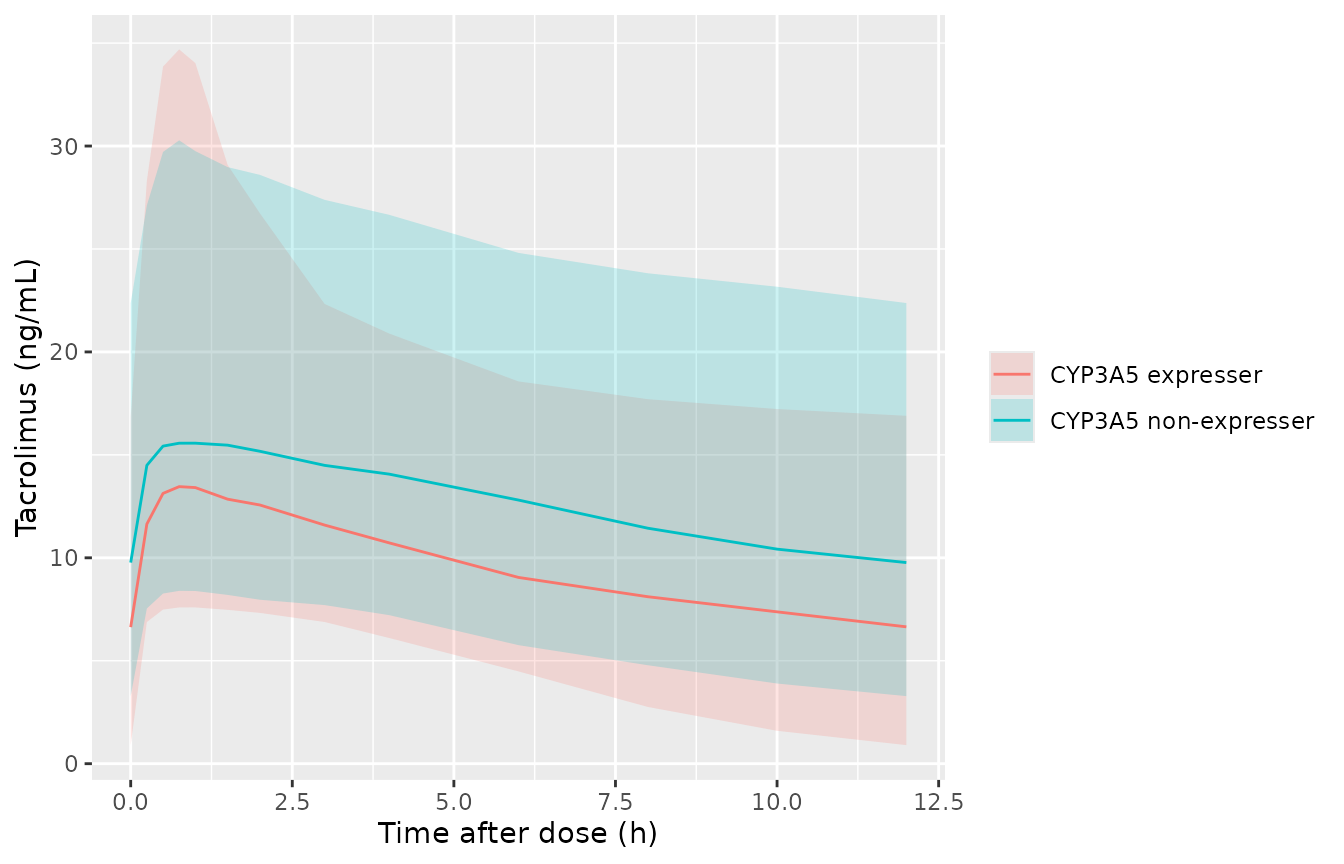
Simulated steady-state whole-blood tacrolimus over one 12 h interval on 1 mg q12h: median and 5th-95th percentiles of the individual predictions, by CYP3A5 status.
PKNCA validation
The paper reports no NCA. Typical-value subjects
(zeroRe()) of each CYP3A5 status (5.3 years, CTLA4 AA, no
Wuzhi capsule) receive 1 mg every 12 h; PKNCA computes Cmax, Cmin and
AUC over the last interval, and the AUC must equal the closed form
Dose / (CL/F).
nca_grp <- tibble(
  id = 1:2, CYP3A5_EXPR = c(1, 0),
  treatment = c("CYP3A5 expresser", "CYP3A5 non-expresser"),
  AGE = 5.3, SNP_CTLA4_RS4553808_GA = 0, SNP_CTLA4_RS4553808_AA = 1, CONMED_WUZHI = 0
)
ev_nca <- bind_rows(
  tidyr::expand_grid(id = nca_grp$id, time = seq(0, by = tau, length.out = ndose)) |>
    mutate(amt = 1, evid = 1L, cmt = "depot"),
  tidyr::expand_grid(id = nca_grp$id, time = t_last + c(0, 0.1, 0.25, 0.5, 0.75, 1, 1.5, 2, 3, 4, 6, 8, 10, 12)) |>
    mutate(amt = 0, evid = 0L, cmt = "central")
) |>
  left_join(nca_grp, by = "id") |>
  arrange(id, time, desc(evid))

sim_nca <- rxode2::rxSolve(mod_typ, events = ev_nca, keep = "treatment") |>
  as.data.frame()
#> ℹ omega/sigma items treated as zero: 'etalvc', 'etalcl'
#> Warning: multi-subject simulation without without 'omega'

conc <- sim_nca |>
  filter(!is.na(Cc), time >= t_last) |>
  select(id, time, Cc, treatment)
doses_nca <- ev_nca |>
  filter(evid == 1L, time == t_last) |>
  select(id, time, amt, treatment)

o_conc <- PKNCAconc(conc, Cc ~ time | treatment + id)
o_dose <- PKNCAdose(doses_nca, amt ~ time | treatment + id)
intervals <- data.frame(start = t_last, end = t_last + tau, auclast = TRUE, cmax = TRUE, cmin = TRUE, tmax = TRUE)
nca_res <- pk.nca(PKNCAdata(o_conc, o_dose, intervals = intervals))

cl_nca <- sim_nca |>
  filter(time == t_last) |>
  distinct(treatment, cl)
nca_wide <- as.data.frame(nca_res) |>
  select(treatment, PPTESTCD, PPORRES) |>
  tidyr::pivot_wider(names_from = PPTESTCD, values_from = PPORRES) |>
  left_join(cl_nca, by = "treatment") |>
  mutate(auc_closed = 1000 * 1 / cl)

nca_wide |>
  select(treatment, cmax, tmax, cmin, auclast, auc_closed) |>
  dplyr::rename(
    "Group" = treatment, "Cmax (ng/mL)" = cmax, "Tmax (h)" = tmax,
    "Cmin (ng/mL)" = cmin, "AUCtau (PKNCA, ng*h/mL)" = auclast,
    "Dose/(CL/F) (ng*h/mL)" = auc_closed
  ) |>
knitr::kable(digits = 2, caption = "Typical-value steady-state NCA on 1 mg q12h.")| Group | Cmax (ng/mL) | Tmax (h) | Cmin (ng/mL) | AUCtau (PKNCA, ng*h/mL) | Dose/(CL/F) (ng*h/mL) |
|---|---|---|---|---|---|
| CYP3A5 expresser | 11.56 | 0.75 | 6.90 | 110.17 | 110.23 |
| CYP3A5 non-expresser | 14.13 | 0.75 | 9.46 | 141.48 | 141.54 |
Assumptions and deviations
- IIV scale. Table 3 labels the random-effect rows “omega2 V (%)” and “omega2 CL (%)” and its footnote calls them variances; they are encoded as variances (1.13 and 0.13). The V/F variance is large (SD 1.06 on the log scale) and has 38% shrinkage, which the authors attribute to the trough-rich sampling. No covariance between the two random effects is reported, so none is included.
-
Residual error. Table 3 gives sigma = 29.95% and
the footnote calls it “square root of residual variability”; the
bootstrap median 0.30 confirms the SD-on-the-fraction scale, so
propSd = 0.2995. - CTLA4 reference group. Eq. 2 and the coding note make GG the reference genotype, although only 2 of 139 patients are GG. The non-monotone GA and AA coefficients are encoded as published.
-
CYP3A5 coding. The paper’s indicator is 1 for
CYP3A5*3/*3. The model uses the package’s
CYP3A5_EXPR(1 = expresser) and applies the published coefficient to1 - CYP3A5_EXPR, so the typical value 10.54 L/h refers to a CYP3A5 expresser. -
Age reference. The 5.3-year reference in Eq. 2 is
the cohort median (Table 1), as the Methods covariate form
(COV/COVmedian)^thetaprescribes. - Fixed ka. 4.48 1/h is taken from earlier paediatric tacrolimus models and was not estimated.
- Wuzhi capsule. Taken per record; the paper does not say whether it varied within a patient.
-
Dose units. The paper reports doses in ug and
concentrations in ug/L; the model takes doses in mg and returns
Ccin ng/mL (= ug/L). - Cohort assumptions. The age distribution of the virtual cohort is not reported beyond the median and range; a truncated log-normal with log-scale SD 0.55 is assumed. Genotypes are drawn independently at the Table 2 frequencies.
- Table 1 misprints. The HCT range is printed as 23.4-447.6 %; HCT was not retained, so this does not affect the model. Gender is printed as 37/102 (male/female) and is reported here as printed.