Model and source
- Citation: Cao Y, Balthasar JP, Jusko WJ. Second-generation minimal physiologically-based pharmacokinetic model for monoclonal antibodies. J Pharmacokinet Pharmacodyn. 2013 Oct;40(5):597-607.
- Article: https://doi.org/10.1007/s10928-013-9332-2
- Source data digitised from Subramanian GM et al. Clin Infect Dis. 2005;41(1):12-20 (PMID 15937757).
This is the PAmAb entry from the 12-fit Cao 2013 mAb
cohort. The structural model (4-compartment mPBPK: plasma + tight-tissue
interstitial fluid + leaky-tissue interstitial fluid + lymph) is shared
by all 12 mAbs in the paper; each mAb has its own values of
sigma1, sigma2, and CLp (Model A)
or CLi (Model B). This file uses Model A
(clearance from plasma) per the operator’s choice for the canonical
entries.
Population
Cao et al. fit the mPBPK model to PAmAb plasma concentration profiles digitised from Subramanian 2005, fully human monoclonal antibody against Bacillus anthracis protective antigen (phase 1 single-dose study in healthy volunteers). Doses: 1, 3, 10, 20, 40 mg/kg IV. Cao 2013 does not reproduce the underlying Subramanian 2005 demographics; consult the source publication for age, sex, and other baseline characteristics. Cao 2013 used a 70 kg reference body weight when assigning the human physiological constants (V_p = 2.6 L, ISF = 15.6 L, lymph flow = 2.9 L/day).
The packaged metadata
(readModelDb("Cao_2013_PAmAb")$population) records this
study context.
Source trace
| Equation / parameter | Value | Source location |
|---|---|---|
| 4-compartment mPBPK ODE system | – | Cao 2013 Eqs 1-4 (page 3, Model A) |
| Lumped tissue-volume splits (V_tight = 0.65 * ISF * Kp; V_leaky = 0.35 * ISF * Kp) | – | Cao 2013 Eq 6 |
| Lymph-flow splits (L1 = 0.33 * L; L2 = 0.67 * L) | – | Cao 2013 Eq 7 |
sigma1 (vascular reflection coefficient, tight
tissues) |
0.950 | Cao 2013 Table 2, PAmAb Model A (CV fixed (not estimated)) |
sigma2 (vascular reflection coefficient, leaky
tissues) |
0.779 | Cao 2013 Table 2, PAmAb Model A (CV 5.24%) |
CLp (plasma clearance) |
0.00867 L/hr = 0.20808 L/day | Cao 2013 Table 2, PAmAb Model A (CV 2.29%) |
sigmaL (lymphatic capillary reflection
coefficient) |
0.2 (fixed) | Cao 2013 Methods (assumed) |
Kp (available ISF fraction for native IgG1) |
0.8 | Cao 2013 Methods, refs 22-23 |
Vplasma for 70 kg adult |
2.6 L | Cao 2013 Table 2 footnote |
ISF total interstitial fluid for 70 kg adult |
15.6 L | Cao 2013 Methods (refs 24-25) |
| Total lymph flow for 70 kg adult | 2.9 L/day | Cao 2013 Methods (refs 24-25) |
Vlymph (assumed equal to plasma volume) |
2.6 L | Cao 2013 Methods, ref 21 |
Virtual cohort
The packaged model has no IIV and no residual error – it is a typical-value structural mPBPK model fit by Cao 2013 to digitised mean profiles in ADAPT 5. Simulation reproduces the paper’s typical-value fits.
obs_times <- sort(unique(c(seq(0, 1, by = 0.05),
                            seq(1, 14, by = 0.5),
                            seq(14, 100, by = 2))))

make_dose_panel <- function(dose_mg_per_kg, weight_kg = 70, id) {
  amt <- dose_mg_per_kg * weight_kg
  rxode2::et(amt = amt, cmt = "plasma", id = id) |>
    rxode2::et(time = obs_times, id = id)
}

events <- dplyr::bind_rows(
  as.data.frame(make_dose_panel(1,  id = 1L)) |> dplyr::mutate(dose_mg_per_kg = 1),
  as.data.frame(make_dose_panel(10,  id = 2L)) |> dplyr::mutate(dose_mg_per_kg = 10),
  as.data.frame(make_dose_panel(40,  id = 3L)) |> dplyr::mutate(dose_mg_per_kg = 40)
)
stopifnot(!anyDuplicated(unique(events[, c("id", "time", "evid")])))
Simulation
mod <- readModelDb("Cao_2013_PAmAb")
sim <- rxode2::rxSolve(rxode2::rxode2(mod), events = events,
keep = "dose_mg_per_kg") |>
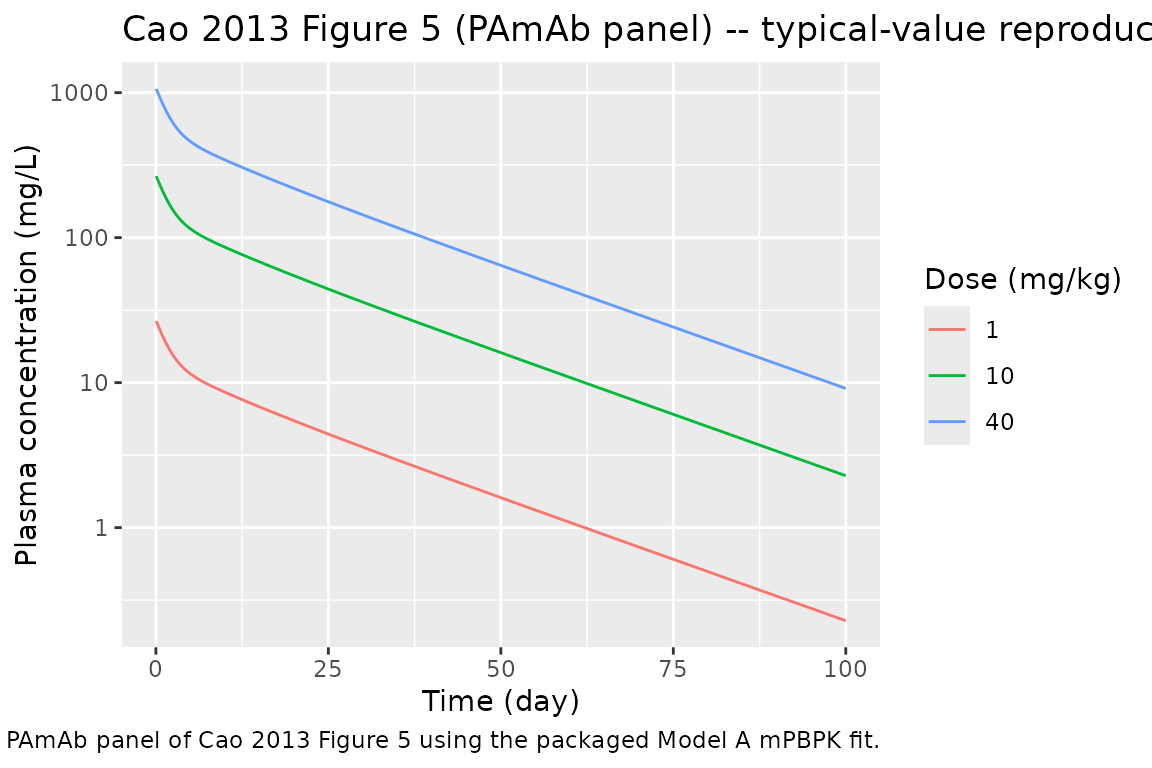
as.data.frame()Replicate Figure 5 (PAmAb panel)
sim |>
  dplyr::filter(time > 0) |>
  ggplot2::ggplot(ggplot2::aes(time, Cc,
                                colour = factor(dose_mg_per_kg))) +
  ggplot2::geom_line() +
  ggplot2::scale_y_log10() +
  ggplot2::labs(
    x = "Time (day)", y = "Plasma concentration (mg/L)",
    colour = "Dose (mg/kg)",
    title = "Cao 2013 Figure 5 (PAmAb panel) -- typical-value reproduction",
    caption = "Replicates the PAmAb panel of Cao 2013 Figure 5 using the packaged Model A mPBPK fit."
  )
PKNCA validation
Run NCA on the simulated plasma profile to compute Cmax, t_max, AUC_inf, and terminal half-life. The packaged model has no IIV, so a single trajectory per dose group represents the “typical” patient.
sim_nca <- sim |>
  dplyr::filter(!is.na(Cc)) |>
  dplyr::transmute(id = id, time = time, conc = Cc,
                   dose_mg_per_kg = dose_mg_per_kg)

dose_df <- events |>
  dplyr::filter(evid == 1) |>
  dplyr::transmute(id = id, time = time, amt = amt,
                   dose_mg_per_kg = dose_mg_per_kg)

conc_obj <- PKNCA::PKNCAconc(sim_nca, conc ~ time | dose_mg_per_kg + id)
dose_obj <- PKNCA::PKNCAdose(dose_df, amt ~ time | dose_mg_per_kg + id)

intervals <- data.frame(
  start      = 0,
  end        = Inf,
  cmax       = TRUE,
  tmax       = TRUE,
  aucinf.obs = TRUE,
  half.life  = TRUE
)

nca <- PKNCA::pk.nca(PKNCA::PKNCAdata(conc_obj, dose_obj, intervals = intervals))
nca_summary <- summary(nca)
knitr::kable(nca_summary, caption = "Simulated NCA parameters by dose group (Cao 2013 PAmAb Model A typical-value fit).")| start | end | dose_mg_per_kg | N | cmax | tmax | half.life | aucinf.obs |
|---|---|---|---|---|---|---|---|
| 0 | Inf | 1 | 1 | 26.9 | 0.000 | 17.6 | 336 |
| 0 | Inf | 10 | 1 | 269 | 0.000 | 17.6 | 3360 |
| 0 | Inf | 40 | 1 | 1080 | 0.000 | 17.6 | 13500 |
The terminal half-life predicted by the typical-value mPBPK fit corresponds to PAmAb’s reported half-life of approximately 2-3 weeks in the underlying Subramanian 2005 study; Cmax and AUC scale linearly with dose because the model is purely linear (no TMDD, no concentration-dependent clearance).
Assumptions and deviations
-
No IIV, no residual error. Cao 2013 fit the mPBPK
model in ADAPT 5 to digitised mean profiles using a typical-value
variance model
V_i = (intercept + slope * Y_hat)^2(Eq 9). Cao 2013 does not report the values ofinterceptandslope. The packaged model is a structural typical-value fit; downstream users wanting between-subject variability must add their own IIV. -
Compartment names deviate from the nlmixr2lib canonical
set (
plasma,tight,leaky,lymphinstead ofcentral,peripheral1,peripheral2,effect). The deviation is necessary because the four mPBPK compartments are mechanistically distinct (plasma vs. tight-tissue ISF vs. leaky-tissue ISF vs. lymph) and forcing them into the canonical PK-style names would obscure the physiology.checkModelConventions()raises this as four warnings (one per compartment) and no errors. - Kp = 0.8 is hard-coded for native IgG1. Siltuximab is a chimeric IgG1; native-IgG1 Kp is appropriate. Cao 2013 also uses Kp = 0.4 for native IgG4 elsewhere in the cohort, but the value is not estimated and is not modified subject-to-subject.
- 70 kg reference body weight. Cao 2013 used a fixed 70 kg adult plasma volume, ISF volume, and lymph flow (Vplasma = 2.6 L, ISF = 15.6 L, L = 2.9 L/day). For paediatric or markedly under- or over-weight subjects, the user must rescale these constants.
- Model A (clearance from plasma) used by default. Cao 2013 also reports Model B (clearance from interstitial fluid; CLi = 0.0224 L/hr for PAmAb); Model A is used here for consistency across the 12 nlmixr2lib entries from this paper. Cao 2013 reports a slightly lower objective-function value for Model B in 7 of 10 human mAbs but notes that Model A is more reasonable on the latent constraint sigma1 > sigma2.- Drug-specific note. sigma1 was fixed at 0.950 in Cao 2013 (CV reported as ‘Not applicable’ in Table 2 footnote c).