Meropenem, cefiderocol and tobramycin humanized plasma and ELF exposures in mice (Fratoni 2025)
Source:vignettes/articles/Fratoni_2025_humanized_exposures_mouse.Rmd
Fratoni_2025_humanized_exposures_mouse.RmdModel and source
Fratoni et al. (2025) developed human-simulated regimens (HSRs) of meropenem, cefiderocol and tobramycin in the standardized COMBINE neutropenic murine pneumonia model, separately for plasma and for pulmonary epithelial lining fluid (ELF). For each drug and each matrix they fitted a one-compartment model with first-order subcutaneous absorption and first-order elimination (WinNonlin, nonlinear least squares, naive-pooled), and used it to design the regimens and to compute the murine fCmax, fAUC0-24 and %fT > MIC. The six fits are independent, so the package carries six models:
| Model | Drug | Matrix | Parameters |
|---|---|---|---|
Fratoni_2025_meropenem_plasma_mouse |
meropenem | plasma | Table 2 |
Fratoni_2025_cefiderocol_plasma_mouse |
cefiderocol | plasma | Table 2 |
Fratoni_2025_tobramycin_plasma_mouse |
tobramycin | plasma | Table 2 |
Fratoni_2025_meropenem_elf_mouse |
meropenem | ELF | Table 3 |
Fratoni_2025_cefiderocol_elf_mouse |
cefiderocol | ELF | Table 3 |
Fratoni_2025_tobramycin_elf_mouse |
tobramycin | ELF | Table 3 |
- Citation: Fratoni AJ, Padgett AM, Roenfanz HF, Duffy EM, Nicolau DP. Development and confirmation of humanized plasma and epithelial lining fluid exposures of meropenem, cefiderocol and tobramycin in a standardized neutropenic murine pneumonia model. J Antimicrob Chemother. 2025;80(2):478-484. doi:10.1093/jac/dkae432. PMID: 39657022. PMCID: PMC11787888. Parameter estimates: Table 2. Model structure and fitting method: Materials and methods, ‘Human-simulated exposure pharmacokinetic studies’, and Results (‘one-compartment pharmacokinetic models with first order elimination’). Murine meropenem protein binding 8%: Materials and methods (cited to DeRyke CA et al. Antimicrob Agents Chemother. 2007;51:1481-6). Dosing regimens: Table 4.
- Article: https://doi.org/10.1093/jac/dkae432 (open access, PMC11787888)
The plasma models predict the TOTAL plasma concentration
Cc and carry the murine unbound fraction fu,
so the free concentration is Cu = fu * Cc. The ELF models
predict Celf directly; the paper treats ELF concentrations
as unbound because bronchoalveolar lavage fluid contains no albumin.
Population
Female specific pathogen-free CD-1 mice, 6-8 weeks old (Charles River), were made neutropenic with intraperitoneal cyclophosphamide (150 mg/kg on day -4 and 100 mg/kg on day -1) and given a predictable degree of renal impairment with uranyl nitrate (5 mg/kg IP on day -3). They were infected intranasally with 50 uL of Klebsiella pneumoniae CDC 851 following the COMBINE protocol. Drug was given as dorsal subcutaneous injections of 0.1 mL (Table 4). Groups of six mice were sampled per time point (two retro-orbital bleeds and one terminal cardiac puncture per mouse, with bronchoalveolar lavage at the terminal time point); ELF concentrations were derived from lavage by urea correction. Across the three drugs, 10 of 108 plasma and 7 of 78 lavage samples were excluded as interquartile-range outliers. The number of mice per drug is not reported.
The same information is available programmatically, e.g.
readModelDb("Fratoni_2025_tobramycin_plasma_mouse")()$population.
Source trace
Every ini() value carries an in-file comment naming its
source. The table collects them.
| Model | Parameter | Value | Source location |
|---|---|---|---|
| meropenem plasma | lka |
log(1.34) 1/h | Table 2, Ka |
| meropenem plasma | lkel |
log(27.13) 1/h | Table 2, Kel |
| meropenem plasma | lvc |
log(0.04) L/kg | Table 2, V plasma |
| meropenem plasma | fu |
0.92 | Materials and methods: murine binding 8% (DeRyke 2007) |
| cefiderocol plasma | lka |
log(21.71) 1/h | Table 2, Ka |
| cefiderocol plasma | lkel |
log(0.74) 1/h | Table 2, Kel |
| cefiderocol plasma | lvc |
log(0.19) L/kg | Table 2, V plasma |
| cefiderocol plasma | fu |
0.684 | Materials and methods: murine binding 31.6% (Monogue 2017) |
| tobramycin plasma | lka |
log(23.68) 1/h | Table 2, Ka |
| tobramycin plasma | lkel |
log(0.31) 1/h | Table 2, Kel |
| tobramycin plasma | lvc |
log(0.37) L/kg | Table 2, V plasma |
| tobramycin plasma | fu |
0.776 | Results, ex vivo protein binding: mean 22.4% bound |
| meropenem ELF | lka |
log(7.00) 1/h | Table 3, Ka-ELF |
| meropenem ELF | lkeff_elf |
log(2.50) 1/h | Table 3, Kel-ELF |
| meropenem ELF | lv_elf |
log(1.60) L/kg | Table 3, V ELF |
| cefiderocol ELF | lka |
log(1.94) 1/h | Table 3, Ka-ELF |
| cefiderocol ELF | lkeff_elf |
log(0.72) 1/h | Table 3, Kel-ELF |
| cefiderocol ELF | lv_elf |
log(0.33) L/kg | Table 3, V ELF |
| tobramycin ELF | lka |
log(1.74) 1/h | Table 3, Ka-ELF |
| tobramycin ELF | lkeff_elf |
log(0.35) 1/h | Table 3, Kel-ELF |
| tobramycin ELF | lv_elf |
log(0.79) L/kg | Table 3, V ELF |
| all | propSd |
0 (held at zero) | not reported (least-squares fit) |
| plasma |
d/dt(depot) = -ka*depot;
d/dt(central) = ka*depot - kel*central;
Cc = central/vc
|
n/a | Results: ‘one-compartment pharmacokinetic models with first order elimination’; Table 2 footnote |
| ELF |
d/dt(depot) = -ka*depot;
d/dt(elf) = ka*depot - keff_elf*elf;
Celf = elf/v_elf
|
n/a | Results; Table 3 footnote (‘absorption rate constant into ELF compartment’) |
| plasma | Cu = fu * Cc |
n/a | Materials and methods: total plasma concentrations corrected to free |
Regimens (Table 4)
The models carry no between-animal variability, so each regimen is simulated for one typical mouse. Each model is paired with the regimen designed for its own matrix, which is how the paper reports Figures 1-3 and Table 5. The meropenem and cefiderocol regimens repeat every 8 h and are simulated for three cycles (24 h); the tobramycin regimens cover 24 h.
regimens <- tibble::tribble(
  ~drug,         ~matrix,  ~dose_times,                              ~dose_amts,
  "meropenem",   "plasma", c(0, 1.25, 3.5, 6),                       c(65, 65, 45, 45),
  "meropenem",   "ELF",    c(0, 1.25, 3.5, 4.75, 6),                 c(20, 50, 30, 20, 15),
  "cefiderocol", "plasma", c(0, 1, 2, 4, 6),                         c(5, 7.5, 10, 3.5, 1),
  "cefiderocol", "ELF",    c(0, 1, 2, 4, 6),                         c(3.75, 5, 6.25, 1.75, 1),
  "tobramycin",  "plasma", c(0, 3, 6, 9),                            c(9, 4, 2, 0.5),
  "tobramycin",  "ELF",    c(0, 1.5, 3, 4.5, 6.5, 9, 12.5, 16),      c(4.8, 3.6, 2.4, 2.4, 2.7, 2.4, 1.2, 1.2)
) |>
  mutate(
    model = sprintf(
      "Fratoni_2025_%s_%s_mouse", drug,
      ifelse(matrix == "plasma", "plasma", "elf")
    ),
    treatment = paste(drug, matrix),
    # meropenem and cefiderocol regimens repeat every 8 h; tobramycin is a
    # once-daily 24 h schedule
    n_cycles = ifelse(drug == "tobramycin", 1L, 3L),
    tau = ifelse(drug == "tobramycin", 24, 8)
  )

make_events <- function(dose_times, dose_amts, n_cycles, tau, obs_cmt) {
  doses <- tibble(
    time = as.vector(outer(dose_times, (seq_len(n_cycles) - 1) * tau, "+")),
    amt = rep(dose_amts, n_cycles),
    evid = 1L,
    cmt = "depot"
  )
  obs <- tibble(
    time = seq(0, n_cycles * tau, by = 0.01),
    amt = 0,
    evid = 0L,
    cmt = obs_cmt
  )
  bind_rows(doses, obs) |>
    arrange(time, desc(evid)) |>
    mutate(id = 1L)
}
Simulation
sim <- bind_rows(lapply(seq_len(nrow(regimens)), function(i) {
  r <- regimens[i, ]
  mod <- readModelDb(r$model)
  ui <- rxode2::rxode(mod)
  is_plasma <- r$matrix == "plasma"
  ev <- make_events(
    r$dose_times[[1]], r$dose_amts[[1]], r$n_cycles, r$tau,
    obs_cmt = if (is_plasma) "central" else "elf"
  )
  s <- as.data.frame(rxode2::rxSolve(ui, events = ev))
  # Free concentration: fu * total in plasma; ELF is treated as unbound
  fconc <- if (is_plasma) s$Cu else s$Celf
  tibble(
    drug = r$drug, matrix = r$matrix, treatment = r$treatment,
    tau = r$tau, n_cycles = r$n_cycles,
    id = 1L, time = s$time, fconc = fconc
  )
}))

stopifnot(
  !anyNA(sim$fconc),
  all(sim$fconc >= -1e-6 * max(sim$fconc))
)
Replicate published figures
# Replicates the 'Murine Simulated' curves of Figures 1 (meropenem),
# 2 (cefiderocol) and 3 (tobramycin): free plasma and ELF concentrations over
# the first dosing interval (8 h for the beta-lactams, 24 h for tobramycin).
sim |>
  filter(time <= tau, fconc > 0) |>
  mutate(drug = factor(drug, c("meropenem", "cefiderocol", "tobramycin"))) |>
  ggplot(aes(time, fconc)) +
  geom_line(linetype = "dashed") +
  facet_wrap(drug ~ matrix, scales = "free", ncol = 2) +
  scale_y_log10() +
  labs(
    x = "Time (h)", y = "Free concentration (mg/L)",
    caption = "Replicates the murine simulated curves of Figures 1-3 of Fratoni 2025."
  )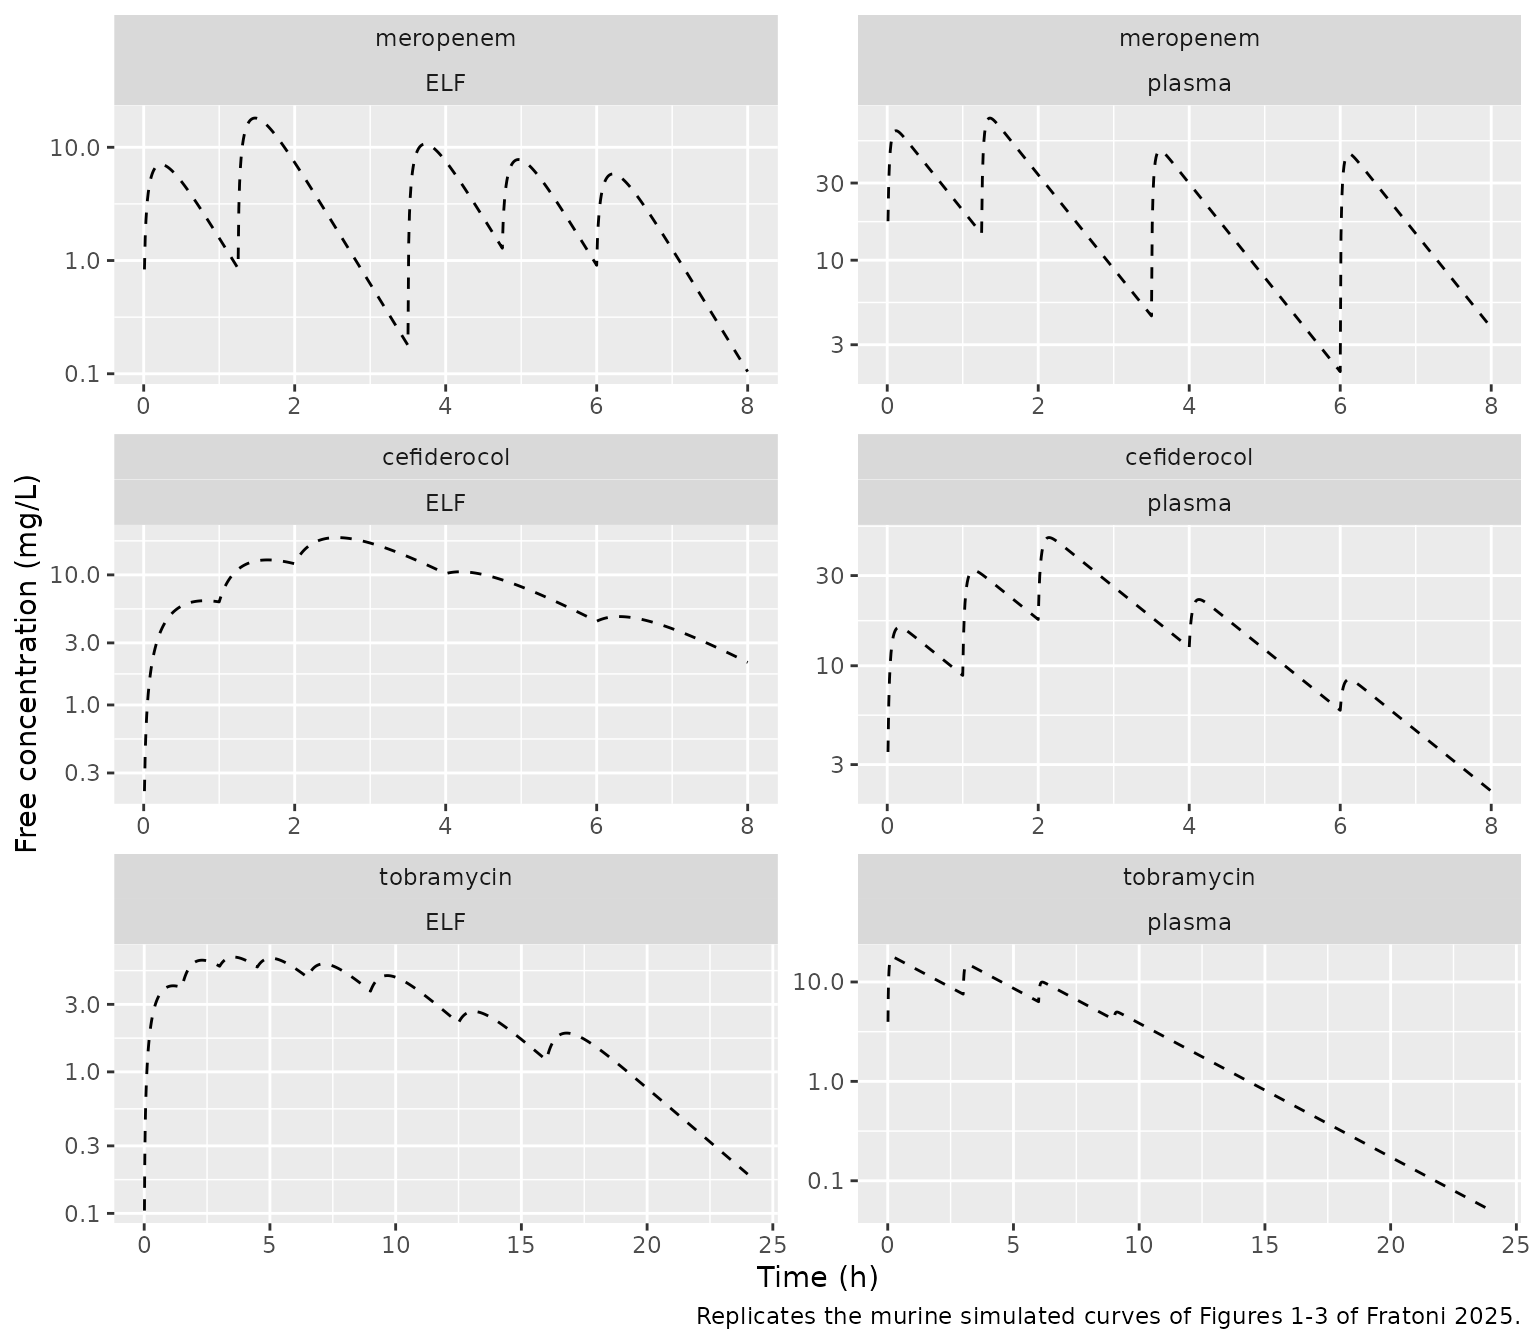
Against the paper’s figures: the meropenem plasma curve peaks near 65-80 mg/L after the 0 h and 1.25 h injections and falls to about 2-5 mg/L before the 6 h dose; the meropenem ELF curve peaks near 7 mg/L after the first injection and near 18 mg/L after the 1.25 h injection; tobramycin plasma reaches about 18 mg/L free at 0.2 h; tobramycin ELF holds near 5-7 mg/L over 2-8 h. These are read by eye from Figures 1-3 and match the curves above.
Table 5: %fT > MIC
mics <- 2^(0:7)

# %fT > MIC over the third 8 h dosing interval (16-24 h), where all four
# beta-lactam models are at steady state. A fine 0.01 h grid makes the
# fraction-of-grid estimate accurate to well under one percentage point.
ft_sim <- sim |>
  filter(drug != "tobramycin", time >= 16, time < 24) |>
  group_by(drug, matrix) |>
  reframe(mic = mics, ft = sapply(mics, function(m) 100 * mean(fconc > m)))

ft_paper <- tibble::tribble(
  ~drug,         ~matrix,  ~ft,
  "meropenem",   "plasma", c(100, 100, 94, 75, 55, 29, 5, 0),
  "meropenem",   "ELF",    c(78, 62, 43, 14, 3, 0, 0, 0),
  "cefiderocol", "plasma", c(100, 100, 91, 76, 50, 16, 0, 0),
  "cefiderocol", "ELF",    c(100, 100, 85, 50, 14, 0, 0, 0)
) |>
  unnest(ft) |>
  group_by(drug, matrix) |>
  mutate(mic = mics) |>
  ungroup()

ft_cmp <- ft_sim |>
  rename(ft_sim = ft) |>
  left_join(rename(ft_paper, ft_paper = ft), by = c("drug", "matrix", "mic")) |>
  mutate(diff = ft_sim - ft_paper)

ft_cmp |>
  mutate(
    cell = sprintf("%.0f (%.0f)", ft_sim, ft_paper),
    mic = paste0("MIC ", mic)
  ) |>
  select(drug, matrix, mic, cell) |>
  pivot_wider(names_from = mic, values_from = cell) |>
  rename(Drug = drug, Matrix = matrix) |>
knitr::kable(caption = "Simulated %fT > MIC (published mouse value from Table 5 in parentheses); MIC in mg/L.")| Drug | Matrix | MIC 1 | MIC 2 | MIC 4 | MIC 8 | MIC 16 | MIC 32 | MIC 64 | MIC 128 |
|---|---|---|---|---|---|---|---|---|---|
| cefiderocol | ELF | 100 (100) | 100 (100) | 85 (85) | 50 (50) | 14 (14) | 0 (0) | 0 (0) | 0 (0) |
| cefiderocol | plasma | 100 (100) | 100 (100) | 90 (91) | 72 (76) | 44 (50) | 10 (16) | 0 (0) | 0 (0) |
| meropenem | ELF | 78 (78) | 62 (62) | 42 (43) | 13 (14) | 3 (3) | 0 (0) | 0 (0) | 0 (0) |
| meropenem | plasma | 100 (100) | 100 (100) | 93 (94) | 75 (75) | 55 (55) | 28 (29) | 4 (5) | 0 (0) |
stopifnot(
  # Three of the four regimens reproduce Table 5 to within rounding.
  max(abs(ft_cmp$diff[!(ft_cmp$drug == "cefiderocol" & ft_cmp$matrix == "plasma")])) <= 3,
  # Cefiderocol plasma runs 1-6 points low (see Assumptions and deviations);
  # a mis-transcribed volume, rate constant or unbound fraction moves the
  # middle MICs by 10 points or more.
  max(abs(ft_cmp$diff)) <= 8
)
PKNCA validation
The paper reports fCmax and fAUC0-24 for tobramycin, the aminoglycoside whose targets are concentration- and AUC-driven: 17.7 mg/L and 103 mg.h/L in plasma, 6.6 mg/L and 76 mg.h/L in ELF (Results). PKNCA computes Cmax and AUC0-24 for the tobramycin profiles, and Cmax and the steady-state AUC over 16-24 h for the beta-lactam profiles, which have no published NCA targets.
conc_df <- sim |>
  filter(!is.na(fconc)) |>
  mutate(fconc = pmax(fconc, 0)) |>
  select(id, time, fconc, treatment)

dose_df <- bind_rows(lapply(seq_len(nrow(regimens)), function(i) {
  r <- regimens[i, ]
  tibble(
    id = 1L,
    time = as.vector(outer(r$dose_times[[1]], (seq_len(r$n_cycles) - 1) * r$tau, "+")),
    amt = rep(r$dose_amts[[1]], r$n_cycles),
    treatment = r$treatment
  )
}))

conc_obj <- PKNCA::PKNCAconc(conc_df, fconc ~ time | treatment + id)
dose_obj <- PKNCA::PKNCAdose(dose_df, amt ~ time | treatment + id)

intervals <- bind_rows(
  tibble(
    treatment = c("tobramycin plasma", "tobramycin ELF"),
    start = 0, end = 24
  ),
  tibble(
    treatment = c("meropenem plasma", "meropenem ELF", "cefiderocol plasma", "cefiderocol ELF"),
    start = 16, end = 24
  )
) |>
  mutate(cmax = TRUE, auclast = TRUE)

nca_res <- PKNCA::pk.nca(PKNCA::PKNCAdata(conc_obj, dose_obj, intervals = as.data.frame(intervals)))

as.data.frame(nca_res) |>
  filter(PPTESTCD %in% c("cmax", "auclast")) |>
  select(treatment, start, end, PPTESTCD, PPORRES) |>
  pivot_wider(names_from = PPTESTCD, values_from = PPORRES) |>
  rename(
    Treatment = treatment, Start = start, End = end,
    "fCmax (mg/L)" = cmax, "fAUC (mg.h/L)" = auclast
  ) |>
knitr::kable(digits = 2, caption = "PKNCA on the simulated free plasma and ELF profiles.")| Treatment | Start | End | fAUC (mg.h/L) | fCmax (mg/L) |
|---|---|---|---|---|
| meropenem plasma | 16 | 24 | 186.45 | 76.28 |
| meropenem ELF | 16 | 24 | 33.74 | 18.12 |
| cefiderocol plasma | 16 | 24 | 131.33 | 48.11 |
| cefiderocol ELF | 16 | 24 | 74.70 | 19.72 |
| tobramycin plasma | 0 | 24 | 104.70 | 17.82 |
| tobramycin ELF | 0 | 24 | 74.32 | 6.48 |
Comparison against published NCA
published <- tibble::tribble(
  ~treatment,          ~cmax, ~auclast,
  "tobramycin plasma", 17.7,  103,
  "tobramycin ELF",    6.6,   76
)

tob_res <- as.data.frame(nca_res) |>
  filter(grepl("^tobramycin", treatment), PPTESTCD %in% c("cmax", "auclast"))

cmp <- nlmixr2lib::ncaComparisonTable(
  simulated = tob_res,
  reference = published,
  by = "treatment",
  units = c(cmax = "mg/L", auclast = "mg*h/L"),
  tolerance_pct = 20
)
knitr::kable(
  cmp,
  caption = "Tobramycin free exposures over 0-24 h: simulated vs. Fratoni 2025 (Results). * differs by >20%."
)| NCA parameter | treatment | Reference | Simulated | % diff |
|---|---|---|---|---|
| Cmax (mg/L) | tobramycin plasma | 17.7 | 17.8 | +0.7% |
| Cmax (mg/L) | tobramycin ELF | 6.6 | 6.48 | -1.8% |
| AUClast (mg*h/L) | tobramycin plasma | 103 | 105 | +1.6% |
| AUClast (mg*h/L) | tobramycin ELF | 76 | 74.3 | -2.2% |
sim_tob <- tob_res |>
  select(treatment, PPTESTCD, PPORRES) |>
  pivot_wider(names_from = PPTESTCD, values_from = PPORRES) |>
  left_join(published, by = "treatment", suffix = c("_sim", "_pub"))
stopifnot(
  # Measured differences are 1-3%; the 10% bound still fails on any
  # mis-transcribed volume, rate constant, dose or unbound fraction.
  all(abs(sim_tob$cmax_sim / sim_tob$cmax_pub - 1) < 0.10),
  all(abs(sim_tob$auclast_sim / sim_tob$auclast_pub - 1) < 0.10)
)
Assumptions and deviations
-
Free vs. total plasma. The paper does not say
explicitly whether the plasma models were fitted to total or free
concentrations. The tobramycin numbers settle it: with the Table 2
parameters, the 9 mg/kg first injection gives a total Cmax of about 23
mg/L, and 0.776 times that is the reported fCmax of 17.7 mg/L. The
plasma models therefore predict TOTAL concentrations (
Cc), andCu = fu * Ccgives the free exposures the paper reports and plots. - The unbound fractions come from the paper’s own text: meropenem 8% and cefiderocol 31.6% murine binding (cited by the authors to DeRyke 2007 and Monogue 2017), and tobramycin 22.4% measured in this study. They are carried as fixed parameters because they are not part of the least-squares fit.
-
Separate plasma and ELF fits. Table 3 defines the
ELF parameters as the absorption rate constant “into ELF compartment”
and the elimination rate constant “from ELF compartment”, so each ELF
model is its own one-compartment model driven by the subcutaneous dose
with no link to plasma. The packaged ELF models follow that structure:
the depot drains straight into
elf. Use the plasma model to simulate plasma and the ELF model to simulate ELF; their doses go into separate model instances. - Apparent volumes. Subcutaneous bioavailability was not estimated, so every volume is V/F.
- Meropenem plasma flip-flop. The meropenem plasma fit has Ka = 1.34 1/h and Kel = 27.13 1/h with V/F = 0.04 L/kg. A one-compartment first-order absorption model cannot distinguish this from Ka = 27.13, Kel = 1.34 and V/F = 0.81 L/kg (the same curve); the published assignment is kept.
- No variability. The fit is naive-pooled least squares. No between-animal variability or residual error model is reported, so the models carry no etas and a proportional residual SD held at zero.
- Cefiderocol plasma %fT > MIC. The simulated values run 1-6 percentage points below Table 5 (44% against 50% at an MIC of 16 mg/L, 10% against 16% at 32 mg/L). Rounding of the two-figure Table 2 values moves these by no more than 2 points, and the gap is not closed by any single plausible change; the paper’s own Figure 2 shows a free peak of roughly 50 mg/L against about 48 mg/L here. The parameters are kept as printed. The other three regimens reproduce Table 5 to within 3 points.
- Averaging interval for Table 5. The paper reports “average exposures” without naming the interval. The third 8 h interval (16-24 h) is used here; the first interval differs by at most 4 points.
- Human comparator curves (the red lines of Figures 1-3) come from the human regimens the authors targeted and are not part of these murine models.
- No correction notice for the paper was found in a EuropePMC search on 2026-11-02.