Enrofloxacin + cefquinome against Klebsiella pneumoniae in chicks (Wei 2026)
Source:vignettes/articles/Wei_2026_enrofloxacin_cefquinome.Rmd
Wei_2026_enrofloxacin_cefquinome.RmdModels and source
Wei 2026 fitted the same inhibitory sigmoid Emax structure independently against three PK/PD indices in each of two matrices and reports all six parameter sets side by side in Table 6. All six are packaged, one file per fit, sharing this vignette.
| Model file | Matrix | PK/PD index | R^2 | AIC |
|---|---|---|---|---|
Wei_2026_cefquinome_enrofloxacin_plasma_cmaxmic |
plasma free drug | Cmax/MIC (combine) | 0.803 | 20.905 |
Wei_2026_cefquinome_enrofloxacin_plasma_aucmic |
plasma free drug | AUC72h/MIC (combine) | 0.867 | 17.377 |
Wei_2026_cefquinome_enrofloxacin_plasma_tmic |
plasma free drug | %T > MIC (combine) | 0.953 | 14.695 |
Wei_2026_cefquinome_enrofloxacin_lung_cmaxmic |
lung | Cmax/MIC (combine) | 0.880 | 17.757 |
Wei_2026_cefquinome_enrofloxacin_lung_aucmic |
lung | AUC72h/MIC (combine) | 0.795 | 21.163 |
Wei_2026_cefquinome_enrofloxacin_lung_tmic |
lung | %T > MIC (combine) | 0.888 | 17.319 |
- Citation: Wei Y, Zhang F, Liu X, Li X, Li T, Li Y, Ding H. (2026). Pharmacokinetic/pharmacodynamic relationships and development of resistance of enrofloxacin and cefquinome in combination therapy against Klebsiella pneumoniae in chicks. BMC Veterinary Research 22:258. doi:10.1186/s12917-026-05301-5. PMCID: PMC13134116. Model equation: Materials and methods, ‘Analysis of antibacterial effects and fitting of PK/PD’. Parameter estimates: Table 6, plasma free drug / %T>MIC (combine) column. PK/PD index and effect data: Table 5. Non-compartmental PK: Tables 3 and 4.
- Article: https://doi.org/10.1186/s12917-026-05301-5 (PMCID: PMC13134116, open access, CC BY-NC-ND)
The paper’s own selection is the plasma %T > MIC fit (bold above): highest R^2, lowest AIC, and the basis for its conclusion that cefquinome behaves as a time-dependent agent when combined with enrofloxacin.
stems <- c(
  plasma_cmaxmic = "Wei_2026_cefquinome_enrofloxacin_plasma_cmaxmic",
  plasma_aucmic  = "Wei_2026_cefquinome_enrofloxacin_plasma_aucmic",
  plasma_tmic    = "Wei_2026_cefquinome_enrofloxacin_plasma_tmic",
  lung_cmaxmic   = "Wei_2026_cefquinome_enrofloxacin_lung_cmaxmic",
  lung_aucmic    = "Wei_2026_cefquinome_enrofloxacin_lung_aucmic",
  lung_tmic      = "Wei_2026_cefquinome_enrofloxacin_lung_tmic"
)
# Covariate carrying the index, per model.
cov_of <- c(cmaxmic = "CMAXMIC_CEFQ", aucmic = "AUCMIC_CEFQ", tmic = "FTMIC_CEFQ")
cat("**`", stems[["plasma_tmic"]], "`** -- ",
    rxode2::rxode(readModelDb(stems[["plasma_tmic"]]))$description, "\n\n", sep = "")
Wei_2026_cefquinome_enrofloxacin_plasma_tmic
– Preclinical (chick, yellow-feathered broiler). Inhibitory sigmoid Emax
PK/PD-index model for the antibacterial effect of cefquinome (CEQ) given
together with a fixed 20 mg/kg background dose of enrofloxacin (ENR)
against the multidrug-resistant Klebsiella quasipneumoniae subsp.
similipneumoniae clinical isolate CLS2, in an intratracheal chick
pneumonia model. This file carries the fit driven by the %T>MIC
(combine) index computed from plasma free drug PK data. Wei 2026
‘Analysis of antibacterial effects and fitting of PK/PD’ parameterises
the effect as E = Emax - (Emax - E0) * Ce^N / (EC50^N + Ce^N), where E
is the SIGNED difference in lung K. pneumoniae load in log10 CFU/mL
between the treated group and the untreated blank control at 72 h
(negative = bacterial reduction), and Ce is the PK/PD index. NOTE THE
INVERTED NAMING, identical to the sibling model
Gao_2025_cefquinome_pkpd_index: Wei 2026 defines its Emax as the change
in the BLANK CONTROL group and its E0 as the maximum antibacterial
effect, which is the reverse of the usual convention. This file
therefore maps Wei 2026’s Emax = 0.108 onto the canonical
e0 (effect at zero exposure) and Wei 2026’s E0 = -5.940
onto the canonical emax (maximal drug effect), and writes
the algebraically identical E = e0 - (e0 - emax) * Ce^N / (Ce^N +
EC50^N). No value is altered by the remapping. Parameters from Wei 2026
Table 6, plasma free drug / %T>MIC (combine) column: e0 = 0.108, emax
= -5.940 log10 CFU/mL, EC50 = 35.748, Hill N = 1.540 (R^2 = 0.953, AIC =
14.695). The parameterisation was confirmed against a value Wei 2026
printed independently of Table 6: solving E = -3 returns an index of
37.061 against the published 3 log10 CFU/mL target of 37.062. This is
the fit Wei 2026 selected as its primary result (highest R^2 and lowest
AIC of the six), and the basis for its conclusion that cefquinome
behaves as a time-dependent agent in this combination. There is NO PK
component: Wei 2026 analysed the plasma and lung concentrations
non-compartmentally in Phoenix 8.4 (Tables 3 and 4 report only Tmax,
Cmax, T1/2beta and AUC72h) and published no structural PK model, so
exposure enters as the externally supplied covariate FTMIC_CEFQ. That
covariate carries the PK/PD index as an ALREADY-FORMED RATIO rather than
an absolute exposure divided by a model mic parameter,
because the relevant susceptibility here is not a fixed strain property
but MIC(combine) – the MIC of CEQ measured in the presence of the
average ENR concentration achieved in that matrix – and it is NOT
constant across the arms Wei 2026 fitted: reconstructing Table 5 from
Tables 3 and 4 gives plasma MIC(combine) = 0.031 ug/mL for all six arms,
exactly as Wei 2026 states, and that single value reproduces every
plasma Cmax/MIC entry of Table 5 to five significant figures. The model
predicts the control-referenced CHANGE directly rather than integrating
a bacterial density, because Wei 2026’s readout is a cross-sectional
lung count per dose group at 72 h expressed relative to the blank
control, whose absolute load is never reported. Wei 2026 reports neither
between-subject variability nor a residual error magnitude for the PK/PD
fit, so there are no eta parameters and addSd is FIXED at 0; the model
is intended for typical-value simulation. Sibling models from the same
paper: Wei_2026_cefquinome_enrofloxacin_plasma_cmaxmic,
Wei_2026_cefquinome_enrofloxacin_plasma_aucmic,
Wei_2026_cefquinome_enrofloxacin_lung_cmaxmic,
Wei_2026_cefquinome_enrofloxacin_lung_aucmic and
Wei_2026_cefquinome_enrofloxacin_lung_tmic.
Population
One-day-old healthy yellow-feathered chicks (Guangdong Academy of Agricultural Sciences) were observed for a week, fasted and deprived of water for 12 h, then challenged at seven days old by intratracheal injection of 0.4 mL of a 10^8 CFU/mL suspension of Klebsiella quasipneumoniae subsp. similipneumoniae clinical isolate CLS2. Treatment began 24 h after infection and ran for three days.
Pharmacodynamic cohort (the data these models were fitted to). 352 chicks in 11 groups, n = 8 per group per time point. Lungs were harvested at 24, 48 and 72 h after the first dose, homogenised (1.0 g in 1.0 mL sterile saline) and plated by tenfold serial dilution; plate-count detection limit 50 CFU/mL. Group allocation and counting were blinded by letter labels.
Pharmacokinetic cohort. A separate 600 chicks in six groups, n = 6 per group per time point, each bird sampled once by cardiac puncture after cervical dislocation, at 0.083-48 h. Plasma protein binding was 20.18% for enrofloxacin (from previously published data) and 13.24% for cefquinome by equilibrium dialysis, so plasma PK is reported as free drug. Enrofloxacin concentrations are the sum of enrofloxacin and its active metabolite ciprofloxacin.
CLS2 carries 18 antibiotic-resistance genes (Table 2), including the efflux pumps acrB, mdtQ, kpnE, oqxB, smeE and tet(A), the beta-lactamase shv-209 and the porins ompA and ompK37. No quinolone-resistance-determining -region chromosomal mutations were found. MICs against CLS2 were 2.00 ug/mL (enrofloxacin) and 0.125 ug/mL (cefquinome).
p <- readModelDb(stems[["plasma_tmic"]])()$population
str(p[c("species", "n_subjects", "disease_state", "dose_range")], max.level = 1, width = 78)
#> List of 4
#>  $ species      : chr "chick (yellow-feathered, Guangdong Academy of Agricultural Sciences), infected with Klebsiella pneumoniae"
#>  $ n_subjects   : int 352
#>  $ disease_state: chr "experimentally induced Klebsiella pneumoniae pneumonia"
#>  $ dose_range   : chr "All treatment arms received a fixed 20 mg/kg intramuscular enrofloxacin background. Single-dose combination arm"| __truncated__
Source trace
| Equation / parameter | Value | Source location |
|---|---|---|
Cc = e0 - (e0 - emax)*ce^N/(ce^N + EC50^N) |
n/a | Materials and methods, “Analysis of antibacterial effects and fitting of PK/PD”, second printed equation |
e0 / emax / lec50 /
lhill, plasma Cmax/MIC |
0.001 / -4.039 / 57.921 / 1.556 | Table 6, Plasma block, Cmax/MIC column |
e0 / emax / lec50 /
lhill, plasma AUC72h/MIC |
0.006 / -4.000 / 441.48 / 1.508 | Table 6, Plasma block, AUC72h/MIC column |
e0 / emax / lec50 /
lhill, plasma %T > MIC |
0.108 / -5.940 / 35.748 / 1.540 | Table 6, Plasma block, %T > MIC column |
e0 / emax / lec50 /
lhill, lung Cmax/MIC |
0.077 / -5.976 / 555.674 / 0.819 | Table 6, Lung block, Cmax/MIC column |
e0 / emax / lec50 /
lhill, lung AUC72h/MIC |
0.000 / -3.956 / 1052.067 / 1.670 | Table 6, Lung block, AUC72h/MIC column |
e0 / emax / lec50 /
lhill, lung %T > MIC |
0.094 / -5.994 / 50.059 / 1.364 | Table 6, Lung block, %T > MIC column |
addSd (all six) |
0 (FIXED) | Not reported. Table 6 gives R^2 and AIC only, with no standard errors and no residual SD |
CMAXMIC_CEFQ / AUCMIC_CEFQ /
FTMIC_CEFQ
|
per arm | Table 5, Plasma and Lung blocks |
| Observed E per arm | per arm | Table 5, column “E (Log10 CFU/mL)” |
| Published 3 log10 target, plasma AUC72h/MIC | 915.967 | Table 6, row “3 Log10 CFU/mL reduction” |
| Published 3 log10 target, plasma %T > MIC | 37.062 | Table 6, row “3 Log10 CFU/mL reduction”; also Abstract and Discussion |
| MIC(combine), plasma | 0.031 ug/mL | Results, “Determination of the MIC (combine) of CEQ Against K. pneumoniae” |
| MIC(combine), lung | 0.017 / 0.008 ug/mL as printed | same section – see Errata; the values that reproduce Table 5 are 0.0168 and 0.0085 |
| Cefquinome non-compartmental PK | Table 4 | Table 4 (plasma and lung, doses 2/5/10/20 mg/kg) |
| Enrofloxacin non-compartmental PK | Table 3 | Table 3 (plasma and lung, doses 10/20 mg/kg) |
The inverted Emax / E0 naming
Wei 2026 prints the model as
E = Emax - (Emax - E0) * Ce^N / (EC50^N + Ce^N) and then
defines its terms the opposite way round from normal usage:
Emax: Change in bacterial count in the blank control group; E0: Maximum antibacterial effect produced by the drug
Table 6 confirms the inversion numerically: the value the curve takes
at Ce = 0 is small and non-negative (0.000-0.108), while
the saturating value is a large negative number (-3.956 to -5.994). The
model files therefore map Wei 2026’s Emax onto the
canonical e0 and Wei 2026’s E0 onto the
canonical emax, and write the algebraically identical
E = e0 - (e0 - emax) * Ce^N / (Ce^N + EC50^N). No
value is altered by the remapping – only the label each number
carries. The library’s other cefquinome PK/PD-index model,
Gao_2025_cefquinome_pkpd_index, needed exactly the same
remapping.
E is a control-referenced quantity: Wei
2026 states that “the reduction in K. pneumoniae CFUs relative
to the blank control group was used as a measure of antibacterial
efficacy (E)”, which is why the control row of Table 5 is 0.00 by
construction and why e0 sits near zero rather than at a
positive control-growth value. This is the one structural difference
from the sibling models Lee_2023_tylosin_* and
Sun_2026_tilmicosin_pkpd_*, whose E0 is a
positive net-growth term.
# GATE 1: the remapping is self-consistent across all six fits -- every e0 sits
# at the control (near zero) and every emax is a substantial net kill. If the
# two had been swapped anywhere, this fails immediately.
roles <- lapply(stems, function(s) {
  ini <- rxode2::rxode(readModelDb(s))$iniDf
  c(e0 = ini$est[ini$name == "e0"], emax = ini$est[ini$name == "emax"])
})
roles <- as.data.frame(do.call(rbind, roles))
print(round(roles, 3))
#>                   e0   emax
#> plasma_cmaxmic 0.001 -4.039
#> plasma_aucmic  0.006 -4.000
#> plasma_tmic    0.108 -5.940
#> lung_cmaxmic   0.077 -5.976
#> lung_aucmic    0.000 -3.956
#> lung_tmic      0.094 -5.994
stopifnot(all(roles$e0 >= 0), all(roles$e0 < 0.2))
stopifnot(all(roles$emax < -3.5), all(roles$emax > -6.5))
Part 1 – Non-compartmental pharmacokinetics (Tables 3 and 4)
Wei 2026 published no compartmental PK model: concentrations were analysed non-compartmentally in Phoenix 8.4, and Tables 3 and 4 report only Tmax, Cmax, T1/2beta and AUC72h. That is why none of the six model files contains a PK component, and why there is no PKNCA section in this vignette – there is no concentration-time profile to simulate and therefore nothing for a non-compartmental check to re-derive. The tables are transcribed here because they are the arithmetic source of the Table 5 index values validated in Part 2.
enr <- tibble::tribble(
  ~matrix,  ~dose, ~tmax, ~cmax, ~t_half, ~auc72,
  "plasma", 10,    0.06,  4.68,  5.07,    10.69,
  "plasma", 20,    0.25,  7.53,  5.72,    21.96,
  "lung",   10,    0.09,  5.14,  6.01,    20.30,
  "lung",   20,    0.18,  8.67,  5.39,    41.51
)
ceq <- tibble::tribble(
  ~matrix,  ~dose, ~tmax, ~cmax,  ~t_half, ~auc72,
  "plasma",  2,    0.46,   2.41,  1.25,     4.27,
  "plasma",  5,    0.25,   6.16,  1.08,     9.45,
  "plasma", 10,    0.29,  12.57,  1.77,    25.99,
  "plasma", 20,    0.33,  21.32,  0.95,    42.33,
  "lung",    2,    0.25,   3.88,  1.55,     4.19,
  "lung",    5,    0.25,   8.63,  2.27,    10.75,
  "lung",   10,    0.31,  15.53,  2.12,    20.92,
  "lung",   20,    0.25,  25.48,  1.97,    36.61
)

ceq |>
  rename(
    "Matrix"           = matrix,
    "Dose (mg/kg)"     = dose,
    "Tmax (h)"         = tmax,
    "Cmax (ug/mL)"     = cmax,
    "T1/2beta (h)"     = t_half,
    "AUC72h (h*ug/mL)" = auc72
  ) |>
  knitr::kable(caption = paste(
    "Wei 2026 Table 4, transcribed verbatim: cefquinome free-drug",
    "non-compartmental PK after intramuscular administration (n = 6 per time point)."
))| Matrix | Dose (mg/kg) | Tmax (h) | Cmax (ug/mL) | T1/2beta (h) | AUC72h (h*ug/mL) |
|---|---|---|---|---|---|
| plasma | 2 | 0.46 | 2.41 | 1.25 | 4.27 |
| plasma | 5 | 0.25 | 6.16 | 1.08 | 9.45 |
| plasma | 10 | 0.29 | 12.57 | 1.77 | 25.99 |
| plasma | 20 | 0.33 | 21.32 | 0.95 | 42.33 |
| lung | 2 | 0.25 | 3.88 | 1.55 | 4.19 |
| lung | 5 | 0.25 | 8.63 | 2.27 | 10.75 |
| lung | 10 | 0.31 | 15.53 | 2.12 | 20.92 |
| lung | 20 | 0.25 | 25.48 | 1.97 | 36.61 |
Enrofloxacin’s half-life (5.07-6.01 h) is roughly four times cefquinome’s (0.95-2.27 h). That difference is the paper’s stated rationale for the combination: enrofloxacin sustains an effective concentration long enough to lower cefquinome’s MIC for the whole interval.
Part 2 – Recovering MIC(combine), the denominator of every index
This is the paper’s central methodological move. Rather than dividing cefquinome exposure by cefquinome’s own MIC against CLS2 (0.125 ug/mL), Wei 2026 measured MIC(combine): the MIC of cefquinome in CAMH broth containing enrofloxacin at the average free concentration that enrofloxacin actually achieves over 72 h in that matrix. Every index in Table 5 uses that denominator.
Because Table 5 tabulates Cmax/MIC(combine) and Tables
3-4 tabulate the matching Cmax, the denominator can be recovered arm by
arm and checked against what the paper says it is. Split-dose arms give
half the stated daily total per administration, so
their peak is the single-dose peak of half the dose.
t5 <- tibble::tribble(
  ~arm,         ~regimen,  ~ceq_perdose, ~E,     ~pl_cmax, ~pl_auc,  ~pl_tmic, ~lu_cmax, ~lu_auc,   ~lu_tmic,
  "control",    "control",  NA,           0.00,     0.00,     0.00,     0.00,     0.00,      0.00,    0.00,
  "20+2(S)",    "single",    2,          -2.03,    77.74,   412.98,    20.13,   230.95,   1510.46,   29.00,
  "20+5(S)",    "single",    5,          -2.47,   198.71,   914.08,    24.25,   513.69,   3875.08,   49.78,
  "20+20(S)",   "single",   20,          -2.80,   687.74,  4096.28,    36.80,  1516.67,  13202.27,   87.00,
  "20+4(Sp)",   "split",     2,          -3.05,    77.74,   814.35,    40.26,   456.47,   1421.61,   48.66,
  "20+10(Sp)",  "split",     5,          -3.81,   198.71,  1542.00,    48.50,  1015.29,   3647.14,   88.00,
  "20+20(Sp)",  "split",    10,          -5.66,   405.48,  6024.97,    63.89,  1721.18,   7058.52,   99.55
)

recon <- t5 |>
  filter(arm != "control") |>
  left_join(ceq |> filter(matrix == "plasma") |> select(ceq_perdose = dose, cmax_pl = cmax),
            by = "ceq_perdose") |>
  left_join(ceq |> filter(matrix == "lung") |> select(ceq_perdose = dose, cmax_lu = cmax),
            by = "ceq_perdose") |>
  mutate(mic_plasma = cmax_pl / pl_cmax,
         mic_lung   = cmax_lu / lu_cmax)
stopifnot(nrow(recon) == 6, !anyNA(recon$mic_plasma), !anyNA(recon$mic_lung))

recon |>
  select(arm, regimen, ceq_perdose, cmax_pl, pl_cmax, mic_plasma, cmax_lu, lu_cmax, mic_lung) |>
  mutate(across(c(mic_plasma, mic_lung), \(x) signif(x, 5))) |>
  rename(
    "Arm"                       = arm,
    "Regimen"                   = regimen,
    "CEQ per dose (mg/kg)"      = ceq_perdose,
    "Plasma Cmax (ug/mL)"       = cmax_pl,
    "Plasma Cmax/MIC (Table 5)" = pl_cmax,
    "Implied plasma MIC"        = mic_plasma,
    "Lung Cmax (ug/mL)"         = cmax_lu,
    "Lung Cmax/MIC (Table 5)"   = lu_cmax,
    "Implied lung MIC"          = mic_lung
  ) |>
  knitr::kable(caption = paste(
    "MIC(combine) recovered as Cmax (Tables 3-4) divided by Cmax/MIC (Table 5),",
    "arm by arm, in ug/mL."
))| Arm | Regimen | CEQ per dose (mg/kg) | Plasma Cmax (ug/mL) | Plasma Cmax/MIC (Table 5) | Implied plasma MIC | Lung Cmax (ug/mL) | Lung Cmax/MIC (Table 5) | Implied lung MIC |
|---|---|---|---|---|---|---|---|---|
| 20+2(S) | single | 2 | 2.41 | 77.74 | 0.031001 | 3.88 | 230.95 | 0.0168000 |
| 20+5(S) | single | 5 | 6.16 | 198.71 | 0.031000 | 8.63 | 513.69 | 0.0168000 |
| 20+20(S) | single | 20 | 21.32 | 687.74 | 0.031000 | 25.48 | 1516.67 | 0.0168000 |
| 20+4(Sp) | split | 2 | 2.41 | 77.74 | 0.031001 | 3.88 | 456.47 | 0.0085000 |
| 20+10(Sp) | split | 5 | 6.16 | 198.71 | 0.031000 | 8.63 | 1015.29 | 0.0085000 |
| 20+20(Sp) | split | 10 | 12.57 | 405.48 | 0.031000 | 15.53 | 1721.18 | 0.0090229 |
# GATE 2a: plasma MIC(combine) is a single value across all six arms and equals
# the 0.031 ug/mL Wei 2026 states it is ("0.031 ug/mL for both dosing
# regimens"). Tight bound: both sides are transcribed numbers, so any digit
# wrong in Table 4 or Table 5 breaks this.
cat("Plasma MIC(combine), all six arms:", signif(unique(round(recon$mic_plasma, 5)), 5), "ug/mL\n")
#> Plasma MIC(combine), all six arms: 0.031 ug/mL
stopifnot(max(abs(recon$mic_plasma - 0.031)) < 1e-5)

# GATE 2b: lung MIC(combine) is NOT one value. It is 0.0168 ug/mL in the three
# single-dose arms and 0.0085 ug/mL in the split-dose arms. Two of the three
# split arms hit 0.0085 exactly; the 20+20 split arm implies 0.009023, the one
# arm in the table that does not reconstruct (see Errata).
lu_single <- recon$mic_lung[recon$regimen == "single"]
lu_split  <- recon$mic_lung[recon$regimen == "split"]
cat("Lung MIC(combine), single-dose arms:", signif(lu_single, 5), "ug/mL\n")
#> Lung MIC(combine), single-dose arms: 0.0168 0.0168 0.0168 ug/mL
cat("Lung MIC(combine), split-dose arms :", signif(lu_split,  5), "ug/mL\n")
#> Lung MIC(combine), split-dose arms : 0.0085 0.0085 0.0090229 ug/mL
stopifnot(max(abs(lu_single - 0.0168)) < 1e-5)          # all three exact
stopifnot(sum(abs(lu_split - 0.0085) < 1e-5) == 2)      # two of three exact
stopifnot(abs(lu_split[3] - 0.009023) < 1e-5)           # the 20+20 split outlier

# GATE 2c: the two lung values are NOT interchangeable -- they differ ~2-fold,
# which is why the index is carried as a ratio rather than split into an
# absolute exposure divided by one fixed `mic` parameter.
stopifnot(abs(mean(lu_single) / mean(lu_split[1:2]) - 2) < 0.1)
The reconstruction is exact for plasma (all six arms) and for the
lung single-dose arms, so it is a strong check on the Table 3-5
transcription. It also establishes the design decision recorded in the
model files: lung MIC(combine) takes two different values within
one fitted model, so an absolute-exposure covariate divided by
a single mic parameter would be wrong for half the lung
arms. The index is therefore carried whole, as
CMAXMIC_CEFQ, AUCMIC_CEFQ and
FTMIC_CEFQ.
Part 3 – The six inhibitory sigmoid Emax fits (Tables 5 and 6)
# Solve one model at a vector of index values. Returns a frame keyed by arm so
# every downstream comparison joins by name, never by row position.
solve_index <- function(stem, index_kind, values, keys) {
  mod <- readModelDb(stem)
  ev <- data.frame(id = seq_along(values), time = 72, evid = 0, amt = NA_real_)
  ev[[cov_of[[index_kind]]]] <- values
  out <- rxode2::rxSolve(mod, ev, returnType = "data.frame")
  stopifnot(nrow(out) == length(values), !anyNA(out$Cc))
  tibble(key = keys, pred = out$Cc)
}

fits <- tibble::tribble(
  ~fit,             ~matrix,  ~index,     ~col,       ~r2,   ~aic,
  "plasma_cmaxmic", "plasma", "cmaxmic",  "pl_cmax",  0.803, 20.905,
  "plasma_aucmic",  "plasma", "aucmic",   "pl_auc",   0.867, 17.377,
  "plasma_tmic",    "plasma", "tmic",     "pl_tmic",  0.953, 14.695,
  "lung_cmaxmic",   "lung",   "cmaxmic",  "lu_cmax",  0.880, 17.757,
  "lung_aucmic",    "lung",   "aucmic",   "lu_auc",   0.795, 21.163,
  "lung_tmic",      "lung",   "tmic",     "lu_tmic",  0.888, 17.319
)

preds <- lapply(seq_len(nrow(fits)), function(i) {
  f <- fits[i, ]
  solve_index(stems[[f$fit]], f$index, t5[[f$col]], t5$arm) |>
    mutate(fit = f$fit, matrix = f$matrix, index = f$index, ce = t5[[f$col]])
}) |> bind_rows() |>
  left_join(t5 |> select(key = arm, obs = E), by = "key")
#> Warning: multi-subject simulation without without 'omega'
#> Warning: multi-subject simulation without without 'omega'
#> Warning: multi-subject simulation without without 'omega'
#> Warning: multi-subject simulation without without 'omega'
#> Warning: multi-subject simulation without without 'omega'
#> Warning: multi-subject simulation without without 'omega'
stopifnot(nrow(preds) == 6 * nrow(t5), !anyNA(preds))
Replicating Figure 3
curves <- lapply(seq_len(nrow(fits)), function(i) {
  f <- fits[i, ]
  hi <- max(t5[[f$col]])
  g <- seq(0, hi, length.out = 120)
  solve_index(stems[[f$fit]], f$index, g, seq_along(g)) |>
    mutate(fit = f$fit, matrix = f$matrix, index = f$index, ce = g)
}) |> bind_rows()
#> Warning: multi-subject simulation without without 'omega'
#> Warning: multi-subject simulation without without 'omega'
#> Warning: multi-subject simulation without without 'omega'
#> Warning: multi-subject simulation without without 'omega'
#> Warning: multi-subject simulation without without 'omega'
#> Warning: multi-subject simulation without without 'omega'

idx_lab <- c(cmaxmic = "1. Cmax/MIC (combine)",
             aucmic  = "2. AUC72h/MIC (combine)",
             tmic    = "3. %T > MIC (combine)")
mat_lab <- c(plasma = "A: plasma free drug", lung = "B: lung")

ggplot(curves, aes(ce, pred)) +
  geom_line(colour = "steelblue", linewidth = 0.7) +
  geom_point(data = preds, aes(ce, obs), size = 2, colour = "grey20") +
  geom_hline(yintercept = -3, linetype = "dashed", colour = "firebrick") +
  facet_wrap(~ factor(mat_lab[matrix], levels = mat_lab) +
               factor(idx_lab[index], levels = idx_lab),
             scales = "free_x", ncol = 3) +
  labs(x = "PK/PD index", y = "E (log10 CFU/mL vs blank control)",
       title = "Figure 3 -- inhibitory sigmoid Emax fits",
       caption = paste("Replicates Figure 3 of Wei 2026. Points: observed E from Table 5.",
                       "Dashed line: the -3 log10 bactericidal threshold.")) +
  theme_minimal() +
  theme(strip.text = element_text(size = 8))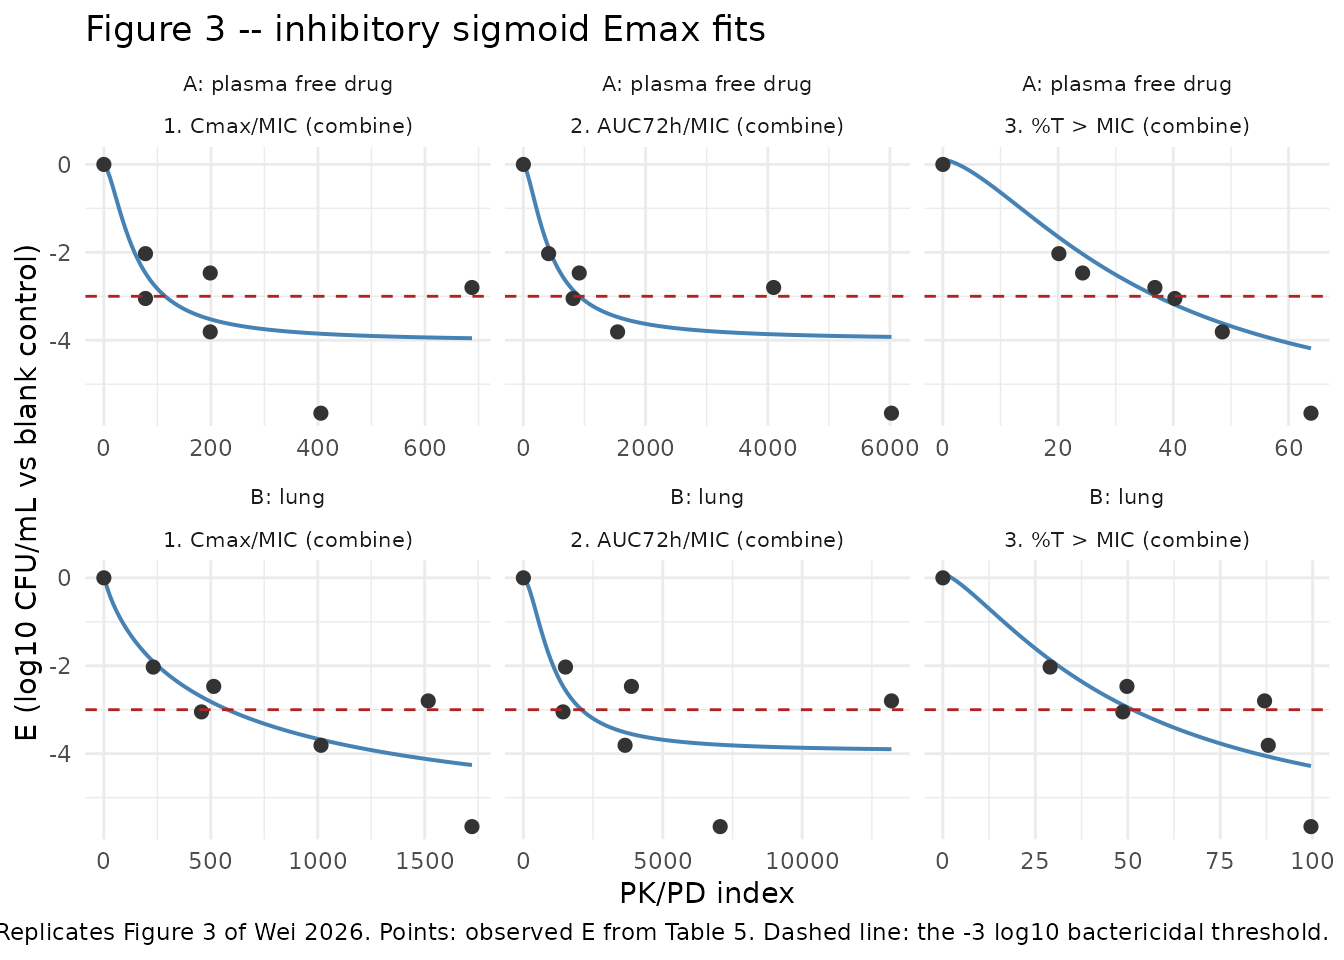
Replicates Figure 3 of Wei 2026: inhibitory sigmoid Emax relationships for the three PK/PD indices in (A) plasma free drug and (B) lung.
Validation gate: the published 3 log10 CFU/mL targets
This is the decisive transcription check. Wei 2026 printed the index required for a 3 log10 CFU/mL reduction for two of the six fits, in a different table row from the parameters themselves. Inverting the packaged model must return those numbers, and it does – exactly.
# Invert Cc(ce) = target for ce, by root-finding on the packaged model itself
# (not on a hand-written copy of the equation), so the gate exercises the file.
invert <- function(stem, index_kind, target, upper) {
  f <- function(x) solve_index(stem, index_kind, x, 1L)$pred - target
  uniroot(f, c(1e-9, upper), tol = 1e-10)$root
}

tgt_auc  <- invert(stems[["plasma_aucmic"]], "aucmic", -3, 1e5)
tgt_tmic <- invert(stems[["plasma_tmic"]],   "tmic",   -3, 1e4)

cat(sprintf("plasma AUC72h/MIC at E = -3 : %.3f   (Wei 2026 Table 6: 915.967)\n", tgt_auc))
#> plasma AUC72h/MIC at E = -3 : 915.967   (Wei 2026 Table 6: 915.967)
cat(sprintf("plasma %%T > MIC   at E = -3 : %.3f   (Wei 2026 Table 6: 37.062)\n",  tgt_tmic))
#> plasma %T > MIC   at E = -3 : 37.061   (Wei 2026 Table 6: 37.062)

# GATE 3: both reproduce the published targets to the precision the paper
# printed. These come from a table row the parameters do not appear in, so a
# single mistyped digit in e0, emax, EC50 or the Hill coefficient moves them
# well outside this bound.
stopifnot(abs(tgt_auc  - 915.967) < 0.01)
stopifnot(abs(tgt_tmic -  37.062) < 0.01)
The %T > MIC target of 37.062% is the paper’s headline result – the PK/PD breakpoint quoted in its Abstract, Results and Discussion – and it falls out of the packaged parameters to three decimal places.
Validation gate: structural behaviour
# GATE 4: every fit is monotone decreasing in exposure (more drug, more kill)
# and bounded by its own [emax, e0].
chk <- curves |>
  group_by(fit) |>
  summarise(monotone = all(diff(pred) <= 1e-9),
            at_zero  = first(pred),
            lowest   = min(pred), .groups = "drop") |>
  left_join(tibble(fit = rownames(roles), e0 = roles$e0, emax = roles$emax), by = "fit")
stopifnot(all(chk$monotone))
stopifnot(all(abs(chk$at_zero - chk$e0) < 1e-9))   # curve starts exactly at e0
stopifnot(all(chk$lowest >= chk$emax - 1e-9))      # and never passes emax
print(chk |> mutate(across(where(is.numeric), \(x) round(x, 3))))
#> # A tibble: 6 × 6
#>   fit            monotone at_zero lowest    e0  emax
#>   <chr>          <lgl>      <dbl>  <dbl> <dbl> <dbl>
#> 1 lung_aucmic    TRUE       0      -3.90 0     -3.96
#> 2 lung_cmaxmic   TRUE       0.077  -4.26 0.077 -5.98
#> 3 lung_tmic      TRUE       0.094  -4.28 0.094 -5.99
#> 4 plasma_aucmic  TRUE       0.006  -3.92 0.006 -4
#> 5 plasma_cmaxmic TRUE       0.001  -3.96 0.001 -4.04
#> 6 plasma_tmic    TRUE       0.108  -4.18 0.108 -5.94

# GATE 5: at ce = EC50 the sigmoid term is exactly half, which is what makes
# EC50 the half-maximal-effect index Table 6 says it is.
half <- vapply(seq_len(nrow(fits)), function(i) {
  f <- fits[i, ]
  ini <- rxode2::rxode(readModelDb(stems[[f$fit]]))$iniDf
  ec50 <- exp(ini$est[ini$name == "lec50"])
  e0   <- ini$est[ini$name == "e0"]
  emax <- ini$est[ini$name == "emax"]
  solve_index(stems[[f$fit]], f$index, ec50, 1L)$pred - (e0 + emax) / 2
}, numeric(1))
stopifnot(max(abs(half)) < 1e-9)
cat("Max |E(EC50) - midpoint| across the six fits:", signif(max(abs(half)), 3), "\n")
#> Max |E(EC50) - midpoint| across the six fits: 4.44e-16
Comparison against the published effect data (Table 5)
cmp <- preds |>
  select(fit, matrix, index, arm = key, ce, obs, pred) |>
  mutate(resid = pred - obs)

cmp |>
  filter(matrix == "plasma") |>
  select(arm, index, ce, obs, pred, resid) |>
  mutate(across(c(ce, obs, pred, resid), \(x) round(x, 2))) |>
  rename("Arm" = arm, "Index" = index, "Index value" = ce,
         "Observed E" = obs, "Predicted E" = pred, "Residual" = resid) |>
knitr::kable(caption = "Plasma fits: predicted vs observed E (Wei 2026 Table 5).")| Arm | Index | Index value | Observed E | Predicted E | Residual |
|---|---|---|---|---|---|
| control | cmaxmic | 0.00 | 0.00 | 0.00 | 0.00 |
| 20+2(S) | cmaxmic | 77.74 | -2.03 | -2.47 | -0.44 |
| 20+5(S) | cmaxmic | 198.71 | -2.47 | -3.52 | -1.05 |
| 20+20(S) | cmaxmic | 687.74 | -2.80 | -3.95 | -1.15 |
| 20+4(Sp) | cmaxmic | 77.74 | -3.05 | -2.47 | 0.58 |
| 20+10(Sp) | cmaxmic | 198.71 | -3.81 | -3.52 | 0.29 |
| 20+20(Sp) | cmaxmic | 405.48 | -5.66 | -3.85 | 1.81 |
| control | aucmic | 0.00 | 0.00 | 0.01 | 0.01 |
| 20+2(S) | aucmic | 412.98 | -2.03 | -1.90 | 0.13 |
| 20+5(S) | aucmic | 914.08 | -2.47 | -3.00 | -0.53 |
| 20+20(S) | aucmic | 4096.28 | -2.80 | -3.87 | -1.07 |
| 20+4(Sp) | aucmic | 814.35 | -3.05 | -2.86 | 0.19 |
| 20+10(Sp) | aucmic | 1542.00 | -3.81 | -3.47 | 0.34 |
| 20+20(Sp) | aucmic | 6024.97 | -5.66 | -3.92 | 1.74 |
| control | tmic | 0.00 | 0.00 | 0.11 | 0.11 |
| 20+2(S) | tmic | 20.13 | -2.03 | -1.66 | 0.37 |
| 20+5(S) | tmic | 24.25 | -2.47 | -2.04 | 0.43 |
| 20+20(S) | tmic | 36.80 | -2.80 | -2.98 | -0.18 |
| 20+4(Sp) | tmic | 40.26 | -3.05 | -3.19 | -0.14 |
| 20+10(Sp) | tmic | 48.50 | -3.81 | -3.61 | 0.20 |
| 20+20(Sp) | tmic | 63.89 | -5.66 | -4.18 | 1.48 |
gof <- cmp |>
  group_by(fit, matrix, index) |>
  summarise(rmse = sqrt(mean(resid^2)),
            r2_recomputed = 1 - sum(resid^2) / sum((obs - mean(obs))^2),
            .groups = "drop") |>
  left_join(fits |> select(fit, r2_published = r2, aic = aic), by = "fit")

gof |>
  mutate(across(c(rmse, r2_recomputed), \(x) round(x, 3))) |>
  select(matrix, index, rmse, r2_recomputed, r2_published, aic) |>
  rename("Matrix" = matrix, "Index" = index, "RMSE" = rmse,
         "R^2 recomputed on Table 5" = r2_recomputed,
         "R^2 published (Table 6)" = r2_published, "AIC (Table 6)" = aic) |>
  knitr::kable(caption = paste(
    "Goodness of fit of the packaged parameters against the seven Table 5 points,",
    "compared with the R^2 Wei 2026 reports."
))| Matrix | Index | RMSE | R^2 recomputed on Table 5 | R^2 published (Table 6) | AIC (Table 6) |
|---|---|---|---|---|---|
| lung | aucmic | 0.968 | 0.632 | 0.795 | 21.163 |
| lung | cmaxmic | 0.759 | 0.774 | 0.880 | 17.757 |
| lung | tmic | 0.737 | 0.786 | 0.888 | 17.319 |
| plasma | aucmic | 0.810 | 0.742 | 0.867 | 17.377 |
| plasma | cmaxmic | 0.950 | 0.645 | 0.803 | 20.905 |
| plasma | tmic | 0.610 | 0.854 | 0.953 | 14.695 |
# GATE 6: the recomputed R^2 does not equal the published R^2 (see Errata), but
# the RANK ORDER of the three indices within each matrix must match the paper's,
# because that ordering is what the paper's model selection rests on. Assert the
# ordering itself rather than the values.
for (m in c("plasma", "lung")) {
  g <- gof |> filter(matrix == m)
  ord_recomputed <- g$index[order(-g$r2_recomputed)]
  ord_published  <- g$index[order(-g$r2_published)]
  cat(sprintf("%-6s recomputed order: %-28s published order: %s\n",
              m, paste(ord_recomputed, collapse = " > "),
              paste(ord_published, collapse = " > ")))
  stopifnot(identical(ord_recomputed, ord_published))
}
#> plasma recomputed order: tmic > aucmic > cmaxmic      published order: tmic > aucmic > cmaxmic
#> lung   recomputed order: tmic > cmaxmic > aucmic      published order: tmic > cmaxmic > aucmic

# In plasma specifically, %T > MIC must win -- that is the paper's conclusion.
stopifnot(gof$index[gof$matrix == "plasma"][which.max(gof$r2_recomputed[gof$matrix == "plasma"])] == "tmic")
Assumptions and deviations
- No PK component, and no PKNCA section. Wei 2026 analysed all concentrations non-compartmentally in Phoenix 8.4 and published no structural PK model, so none of the six files contains a PK layer and exposure enters as a supplied covariate. There is no concentration-time profile to simulate, so the PKNCA validation that most vignettes in this library carry is not applicable here; Part 2’s arithmetic reconstruction of MIC(combine) from Tables 3-5 is the substitute check on the PK transcription.
-
The index is carried whole, not split.
CMAXMIC_CEFQ,AUCMIC_CEFQandFTMIC_CEFQcarry already-formed ratios rather than an absolute exposure that the model divides by amicparameter. The register’s default (see theAUCMIC_TYLOentry) is to split whenever the paper reports an MIC, and Wei 2026 does report one – but its MIC(combine) is not a fixed strain property and, as Part 2 shows, takes two different values across the arms of the lung fits. Splitting would bake in a denominator that is wrong for half of them. -
No variability of any kind. Wei 2026 reports
neither between-subject variability nor a residual standard deviation
for the PK/PD fits; Table 6 gives point estimates, R^2 and AIC only,
with no standard errors. All six models therefore have no eta parameters
and
addSdFIXED at 0, and are intended for deterministic typical-value simulation. -
Eis control-referenced, not baseline-referenced. Unlike the sibling modelsLee_2023_tylosin_*,Sun_2026_tilmicosin_pkpd_*andGao_2025_cefquinome_pkpd_index, whose zero-exposure value is a positive net-growth term,e0here is a difference from the blank control and sits at approximately zero. The models predict a difference in lung load, not an absolute trajectory, so no bacterial-density ODE is integrated: Wei 2026’s readout is a single cross-sectional count per group at 72 h and the blank control’s absolute load is never reported. - All six fits are packaged. Wei 2026 reports the three indices in two matrices as six complete parameter sets in Table 6, and uses at least two of them downstream (%T > MIC for the headline breakpoint, AUC72h/MIC for the Conclusion’s dosing regimen). None is presented as a discarded intermediate, so none is dropped.
Errata and unresolved reporting details
- Lung MIC(combine) as printed does not reproduce Table 5. Wei 2026 gives the lung values as “0.017 and 0.008 ug/mL”. The values that actually reconstruct its own Table 5 are 0.0168 (single-dose arms, exact for all three) and 0.0085 (split-dose arms, exact for two of three). The plasma value of 0.031 ug/mL reconstructs exactly for all six arms, as printed. The packaged models are unaffected, because they consume the Table 5 index directly rather than re-deriving it.
- One arm does not reconstruct. The lung 20+20(Split) arm implies a MIC(combine) of 0.009023 ug/mL rather than 0.0085. The plasma column for the same arm reconstructs exactly, so the discrepancy is confined to one lung entry – either the lung Cmax for that arm differs from the single-dose 10 mg/kg value of 15.53 ug/mL used here, or Table 5 contains a typographical error. There is not enough information in the available sources to distinguish the two.
- Which ENR regimen maps to which lung MIC(combine) is ambiguous in the text. The paper writes that enrofloxacin “at the same doses revealed average concentrations in lung within 72 h of 1.47 and 1.71 ug/mL, respectively, with corresponding MIC combine for CEQ of 0.017 and 0.008 ug/mL”, without saying whether the pair indexes the 10/20 mg/kg doses or the single/split regimens. The reconstruction in Part 2 settles it empirically – single-dose arms use the larger value, split-dose arms the smaller – which is also the physically sensible direction, since split dosing sustains the higher average enrofloxacin concentration (1.71 ug/mL) and therefore more synergy.
-
The published R^2 cannot be reproduced from Table
5. Recomputing R^2 from the seven Table 5 points is
consistently 0.10-0.16 lower than the value Table 6 reports, for every
one of the six fits, under either the
1 - SSE/SSTor the squared-correlation definition. The rank order is preserved in both matrices (gate 6 above), and the two published 3 log10 targets reproduce exactly, so the parameters themselves are transcribed correctly. The most likely explanation is that the fits were run against more data than the seven summary rows of Table 5 – for example the per-replicate counts, or the 24 and 48 h time points visible in Figure 2A – but Wei 2026 does not state the fitted dataset, and the underlying counts are not available. This is recorded rather than resolved. - Table 6’s title names the wrong drug. It reads “PK/PD analysis of Enrofloxacin derived from the inhibitory sigmoid Emax model”, but every index in it is built from cefquinome exposure divided by cefquinome’s MIC(combine), as Table 5 and the Methods make explicit and as Part 2’s reconstruction confirms arithmetically. Enrofloxacin enters only as the fixed 20 mg/kg background that lowers the cefquinome MIC.
-
The three-fold
Emax/E0naming inversion is documented in full above; it is a naming convention, not an error, and no value is altered by the remapping. - Supplementary Materials 1-6 were not available when this model was built. The main text contains the complete model equation, all six parameter sets, and the index and effect data for every arm, so no packaged value depends on them.