Cefepime-taniborbactam during CRRT (Fouad 2025)
Source:vignettes/articles/Fouad_2025_cefepime_taniborbactam_crrt.Rmd
Fouad_2025_cefepime_taniborbactam_crrt.RmdModel and source
- Citation: Fouad A, McGrath C, Buyukyanbolu E, Kuti JL. Ex vivo assessment and simulation to guide cefepime-taniborbactam dosing recommendations for patients receiving continuous renal replacement therapy. Antimicrob Agents Chemother. 2025;69(6):e00061-25. doi:10.1128/aac.00061-25. CRRT clearance regression from the Results (‘Impact of CRRT variables on CLTM’); population PK parameters, non-renal clearance, dispersion and protein binding from the supplement (‘Monte Carlo Simulations and Dose Recommendations’).
- Description (cefepime): Two-compartment population PK simulation model for cefepime (given as cefepime-taniborbactam) in adults, with and without continuous renal replacement therapy (CRRT) (Fouad 2025). Without CRRT, clearance is the sponsor population PK clearance, a power function of creatinine clearance with end-stage renal disease and complicated urinary tract infection shifts. On CRRT the renal clearance is replaced by the transmembrane clearance measured in an ex vivo CRRT circuit, a linear function of the effluent flow rate (CLTM = 0.41 + 0.86 x effluent, L/h), added to a non-renal clearance of 0.87 L/h. Unbound concentration uses a fixed 17.3% protein binding.
- Description (taniborbactam): Two-compartment population PK simulation model for taniborbactam (given as cefepime-taniborbactam) in adults, with and without continuous renal replacement therapy (CRRT) (Fouad 2025). Without CRRT, clearance is the sponsor population PK clearance, a power function of creatinine clearance with an end-stage renal disease shift. On CRRT the renal clearance is replaced by the transmembrane clearance measured in an ex vivo CRRT circuit, a linear function of the effluent flow rate (CLTM = 0.38 + 0.79 x effluent, L/h), added to a non-renal clearance of 0.77 L/h. Unbound concentration uses a fixed 12.2% protein binding.
- Article: https://doi.org/10.1128/aac.00061-25
Fouad et al. measured the transmembrane clearance (CLTM)
of cefepime and taniborbactam in an ex vivo continuous renal replacement
therapy (CRRT) circuit and regressed it on the effluent flow rate. They
then replaced the renal clearance of the sponsor’s two-compartment
population PK model with CLTM plus a fixed non-renal
clearance, and ran Monte Carlo simulations to choose CRRT doses. The two
drugs were regressed and simulated independently, so the library carries
one model per drug (Fouad_2025_cefepime,
Fouad_2025_taniborbactam). Each model holds both clearance
models of the paper and switches between them on
RRT_CRRT_STATUS:
-
RRT_CRRT_STATUS = 0– the non-CRRT control population: clearance is the sponsor population PK clearance, a power function of creatinine clearance (CRCL), with an end-stage renal disease shift for both drugs and a complicated urinary tract infection (cUTI/AP) shift for cefepime. -
RRT_CRRT_STATUS = 1– CRRT patients, with clearance equal to the non-renal clearance plus CLTM at the prescribed effluent flow (RRT_CRRT_EFFLUENT_FLOW, mL/h).
The paper’s Table 1 (sieving and saturation coefficients), Figure 1 (filter adsorption) and Tables S1-S2 (degradation and adsorption) describe the ex vivo experiments and are not model outputs.
Population
No patient was studied in this paper. The ex vivo experiments circulated one litre of heparinized bovine blood through a Prismaflex circuit at a blood flow of 200 mL/min, in CVVH and CVVHD modes, with ST150 (AN69) and HF1400 (PAES) hemofilters and effluent flows of 2, 3 and 4 L/h, each in duplicate (Methods and supplement, ‘Ex vivo CRRT’). The base population PK model was fitted to 607 adults (544 for cefepime) from six phase 1 trials and one phase 3 trial (sponsor report, data on file); its demographics are not reported in the paper. The control simulations used creatinine clearances of 60, 90 and 120 mL/min, each with a 15% CV, and the CRRT simulations used effluent flows of 2-5 L/h with no residual renal function (supplement, ‘Monte Carlo Simulations and Dose Recommendations’).
The same information is available programmatically via
readModelDb("Fouad_2025_cefepime")()$population.
Source trace
The per-parameter origin is recorded as an in-file comment next to
each ini() entry in
inst/modeldb/specificDrugs/Fouad_2025_cefepime.R and
inst/modeldb/specificDrugs/Fouad_2025_taniborbactam.R.
“Supplement” below is the ‘Monte Carlo Simulations and Dose
Recommendations’ section of the supplemental methods.
| Parameter | Cefepime | Taniborbactam | Source location |
|---|---|---|---|
lcl (non-CRRT CL at reference CLcr, L/h) |
4.75 | 4.81 | Supplement CL equations |
CRCL reference (mL/min) |
77 | 82 | Supplement CL equations |
e_crcl_cl (exponent on CLcr/reference) |
0.696 | 0.733 | Supplement CL equations |
e_esrd_cl (ESRD shift on CL) |
-0.613 | -0.689 | Supplement CL equations, (1-0.613)^ESRD,
(1-0.689)^ESRD
|
e_cuti_cl (cUTI/AP shift on CL) |
0.281 | – | Supplement cefepime CL equation, (1+0.281)^cUTI/AP
|
lvc (Vc, L) |
8.49 | 12.2 | Supplement parameter lists |
lq (Q, L/h) |
5.94 | 3.49 | Supplement parameter lists |
lvp (Vp, L) |
6.26 | 6.2 | Supplement parameter lists |
lcl_nonren (non-renal CL, L/h) |
0.87 | 0.77 | Supplement, ‘non-renal clearance (CL_NR) … were 0.87 and 0.77 L/h’ |
lcl_crrt (CLTM intercept, L/h) |
0.41 | 0.38 | Results, ‘Impact of CRRT variables on CLTM’ |
e_effl_cl_crrt (CLTM slope, L/h per
L/h) |
0.86 | 0.79 | Results, ‘Impact of CRRT variables on CLTM’; Table 2 |
etalvc (variance) |
0.254 (CV 53.8%) | – | Supplement, ‘CVs of 53.8% for Vc’ |
etalvp (variance) |
0.00391 (CV 6.26%) | 0.0862 (CV 30%) | Supplement, ‘6.26% for Vp’; ‘variability around Vp for taniborbactam … 30%’ |
etalq (variance) |
0.0862 (CV 30%) | 0.0862 (CV 30%) | Supplement, ‘30% was assumed for Q for both drugs’ |
etalcl_nonren (variance) |
0.0862 (CV 30%) | 0.0862 (CV 30%) | Supplement, ‘A 30% CV was added to the CL_NR values’ |
fu (unbound fraction) |
0.827 | 0.878 | Supplement, protein binding fixed at 17.3% and 12.2% |
propSd |
0 (fixed) | 0 (fixed) | not reported (simulation study) |
| Non-CRRT CL equation | – | – | Supplement CL equations |
| CRRT CL = CL_NR + CL_TM | – | – | Supplement, ‘Total cefepime and taniborbactam clearance was the sum of the CL_NR and the CL_TM’ |
| Two-compartment ODEs | – | – | Supplement parameter lists (Vc, Q, Vp) |
Deterministic checks
Non-CRRT clearance against creatinine clearance
The supplement prints the typical clearance at the three simulated
creatinine clearances. The model reproduces them; the only difference is
the rounding of the printed values. The printed cefepime values include
the cUTI/AP factor (x 1.281), so DIS_CUTI = 1 here.
mod_fep <- readModelDb("Fouad_2025_cefepime")
mod_tan <- readModelDb("Fouad_2025_taniborbactam")

typical_cl <- function(mod, cov) {
  ev <- cov |>
    mutate(id = row_number(), time = 0, evid = 0, amt = 0, cmt = "central")
  rxode2::rxSolve(rxode2::zeroRe(mod), ev, returnType = "data.frame")$cl
}

crcl_grid <- data.frame(
  CRCL = c(60, 90, 120),
  RENALIMP_ESRD = 0,
  DIS_CUTI = 1,
  RRT_CRRT_STATUS = 0,
  RRT_CRRT_EFFLUENT_FLOW = 0
)
cl_check <- bind_rows(
  data.frame(drug = "Cefepime", CRCL = crcl_grid$CRCL,
             model = typical_cl(mod_fep, crcl_grid),
             published = c(5.1, 6.78, 8.29)),
  data.frame(drug = "Taniborbactam", CRCL = crcl_grid$CRCL,
             model = typical_cl(mod_tan, crcl_grid),
             published = c(3.83, 5.15, 6.35))
)
#> ℹ parameter labels from comments will be replaced by 'label()'
#> ℹ omega/sigma items treated as zero: 'etalvc', 'etalvp', 'etalq', 'etalcl_nonren'
#> Warning: multi-subject simulation without without 'omega'
#> ℹ parameter labels from comments will be replaced by 'label()'
#> ℹ omega/sigma items treated as zero: 'etalvp', 'etalq', 'etalcl_nonren'
#> Warning: multi-subject simulation without without 'omega'
# Same parameters on both sides: the difference is the printed rounding.
stopifnot(all(abs(cl_check$model / cl_check$published - 1) < 0.005))

cl_check |>
  mutate(model = signif(model, 4)) |>
  rename(
    "Drug" = drug,
    "CLcr (mL/min)" = CRCL,
    "Model CL (L/h)" = model,
    "Published CL (L/h)" = published
  ) |>
knitr::kable(caption = "Typical non-CRRT clearance vs the values printed in the supplement.")| Drug | CLcr (mL/min) | Model CL (L/h) | Published CL (L/h) |
|---|---|---|---|
| Cefepime | 60 | 5.115 | 5.10 |
| Cefepime | 90 | 6.783 | 6.78 |
| Cefepime | 120 | 8.286 | 8.29 |
| Taniborbactam | 60 | 3.826 | 3.83 |
| Taniborbactam | 90 | 5.150 | 5.15 |
| Taniborbactam | 120 | 6.359 | 6.35 |
Transmembrane clearance against effluent flow
er_grid <- data.frame(
  CRCL = 90,
  RENALIMP_ESRD = 0,
  DIS_CUTI = 0,
  RRT_CRRT_STATUS = 1,
  RRT_CRRT_EFFLUENT_FLOW = seq(1000, 5000, by = 250)
)
bind_rows(
  data.frame(drug = "Cefepime", effluent = er_grid$RRT_CRRT_EFFLUENT_FLOW / 1000,
             cl = typical_cl(mod_fep, er_grid)),
  data.frame(drug = "Taniborbactam", effluent = er_grid$RRT_CRRT_EFFLUENT_FLOW / 1000,
             cl = typical_cl(mod_tan, er_grid))
) |>
  ggplot(aes(effluent, cl, colour = drug)) +
  geom_line() +
  labs(x = "Effluent flow rate (L/h)", y = "Total clearance on CRRT (L/h)", colour = NULL) +
  theme_bw()
#> ℹ parameter labels from comments will be replaced by 'label()'
#> ℹ omega/sigma items treated as zero: 'etalvc', 'etalvp', 'etalq', 'etalcl_nonren'
#> Warning: multi-subject simulation without without 'omega'
#> ℹ parameter labels from comments will be replaced by 'label()'
#> ℹ omega/sigma items treated as zero: 'etalvp', 'etalq', 'etalcl_nonren'
#> Warning: multi-subject simulation without without 'omega'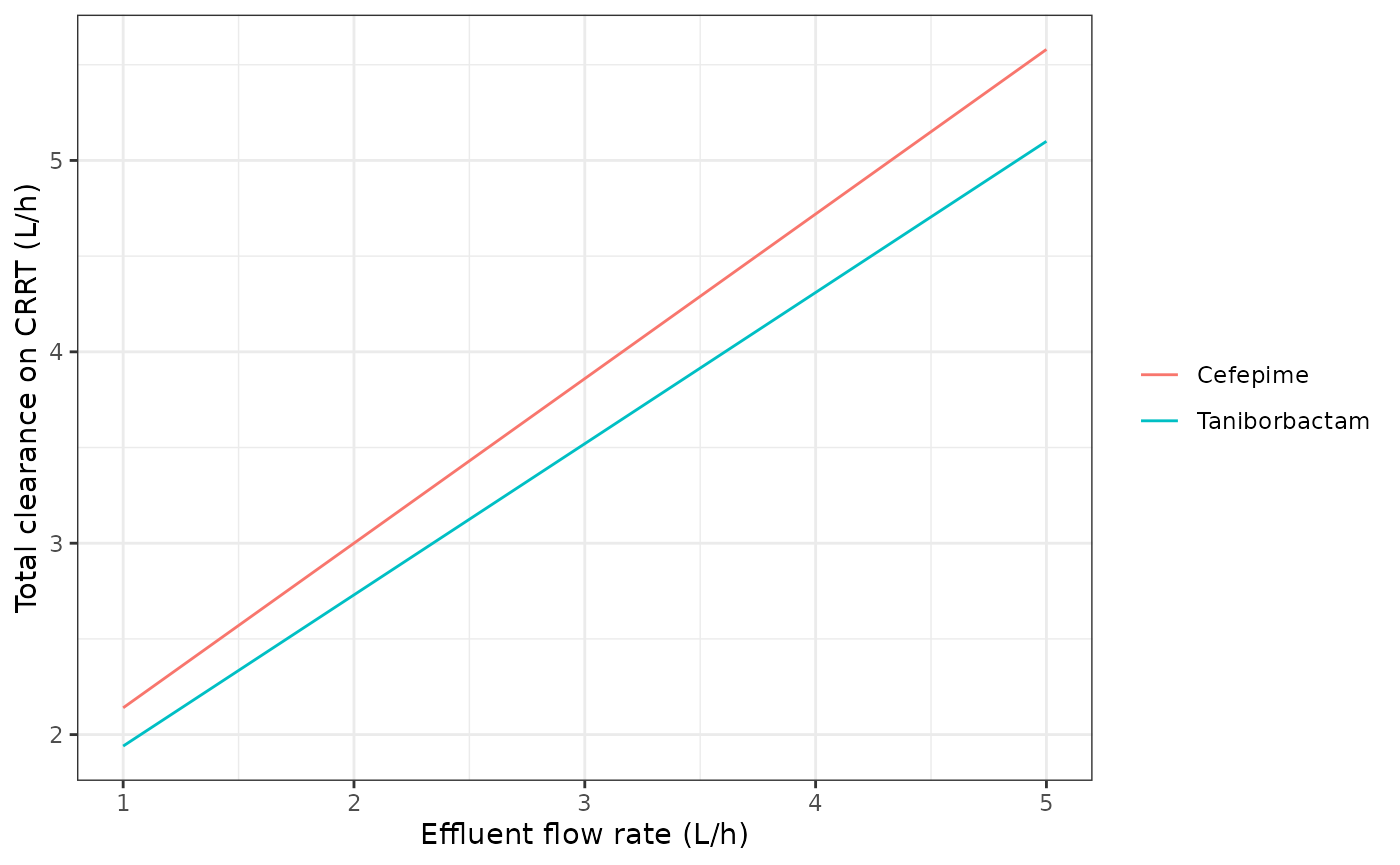
Typical CRRT clearance (non-renal + transmembrane) against effluent flow rate for both drugs; the CL_TM regression was fitted on 2-4 L/h and extrapolated to 5 L/h in the paper’s simulations.
Virtual cohort
The paper simulated 1,000 patients per scenario with the Pmetrics simulator. The cohorts below use 100 per CRRT scenario and 60 per creatinine-clearance group (180 in total) for the non-CRRT control. Each scenario is a 4-h infusion at the stated interval; the cefepime and taniborbactam doses are paired (2 g with 0.5 g, 1 g with 0.25 g), and the scenarios are those of Tables 3 and 4. Creatinine clearance in the control is drawn from a normal distribution with a 15% CV around 60, 90 or 120 mL/min. Exposure is evaluated over 48-72 h, where both drugs are at steady state.
rxode2::rxSetSeed(20250331)
set.seed(20250331)

n_per <- 100L
n_ctrl <- 60L

scenarios <- tibble::tribble(
  ~scenario,            ~crrt, ~effluent, ~full_dose, ~tau,
  "Non-CRRT, full q8h", 0,     0,         TRUE,       8,
  "2 L/h, full q8h",    1,     2,         TRUE,       8,
  "2 L/h, half q8h",    1,     2,         FALSE,      8,
  "3 L/h, full q8h",    1,     3,         TRUE,       8,
  "3 L/h, half q8h",    1,     3,         FALSE,      8,
  "3 L/h, full q12h",   1,     3,         TRUE,       12,
  "3 L/h, half q12h",   1,     3,         FALSE,      12,
  "4 L/h, full q8h",    1,     4,         TRUE,       8,
  "4 L/h, half q8h",    1,     4,         FALSE,      8,
  "4 L/h, full q12h",   1,     4,         TRUE,       12,
  "4 L/h, half q12h",   1,     4,         FALSE,      12,
  "5 L/h, full q8h",    1,     5,         TRUE,       8,
  "5 L/h, half q8h",    1,     5,         FALSE,      8
) |>
  mutate(scenario = factor(scenario, levels = scenario))

subjects <- bind_rows(
  scenarios |>
    filter(crrt == 0) |>
    slice(rep(1, 3 * n_ctrl)) |>
    mutate(crcl_mean = rep(c(60, 90, 120), each = n_ctrl)),
  scenarios |>
    filter(crrt == 1) |>
    slice(rep(seq_len(n()), each = n_per)) |>
    mutate(crcl_mean = 90)
) |>
  mutate(
    id = row_number(),
    CRCL = ifelse(crrt == 0, rnorm(n(), crcl_mean, 0.15 * crcl_mean), crcl_mean),
    RENALIMP_ESRD = 0,
    # The cefepime control simulations applied the cUTI/AP factor (supplement)
    DIS_CUTI = 1,
    RRT_CRRT_STATUS = crrt,
    RRT_CRRT_EFFLUENT_FLOW = effluent * 1000
  )

covs <- c("scenario", "CRCL", "RENALIMP_ESRD", "DIS_CUTI", "RRT_CRRT_STATUS",
          "RRT_CRRT_EFFLUENT_FLOW")

dose_rows <- subjects |>
  group_by(id) |>
  reframe(time = seq(0, 72 - tau, by = tau), across(all_of(c(covs, "full_dose")))) |>
  mutate(evid = 1, cmt = "central")

obs_rows <- subjects |>
  group_by(id) |>
  reframe(time = c(0, seq(48, 72, by = 0.1)), across(all_of(covs))) |>
  mutate(evid = 0, amt = 0, rate = 0, cmt = "central")

build_events <- function(full_mg) {
  dose_rows |>
    mutate(amt = ifelse(full_dose, full_mg, full_mg / 2), rate = amt / 4) |>
    select(-full_dose) |>
    bind_rows(obs_rows) |>
    arrange(id, time, desc(evid)) |>
    as.data.frame()
}
events_fep <- build_events(2000)
events_tan <- build_events(500)
stopifnot(!anyDuplicated(events_fep[events_fep$evid == 1, c("id", "time")]))
Simulation
sim <- bind_rows(
  rxode2::rxSolve(mod_fep, events_fep, keep = "scenario", returnType = "data.frame") |>
    mutate(drug = "Cefepime"),
  rxode2::rxSolve(mod_tan, events_tan, keep = "scenario", returnType = "data.frame") |>
    mutate(drug = "Taniborbactam")
)
#> ℹ parameter labels from comments will be replaced by 'label()'
#> ℹ parameter labels from comments will be replaced by 'label()'
sim |>
  filter(
    scenario %in% c("Non-CRRT, full q8h", "2 L/h, half q8h", "4 L/h, full q8h"),
    time >= 48
  ) |>
  group_by(drug, scenario, time) |>
  summarise(
    p05 = quantile(Cc, 0.05), p50 = median(Cc), p95 = quantile(Cc, 0.95),
    .groups = "drop"
  ) |>
  ggplot(aes(time, p50, colour = scenario, fill = scenario)) +
  geom_ribbon(aes(ymin = p05, ymax = p95), alpha = 0.15, colour = NA) +
  geom_line() +
  facet_wrap(~drug, scales = "free_y") +
  labs(x = "Time (h)", y = "Total plasma concentration (mg/L)", colour = NULL, fill = NULL) +
  theme_bw() +
  theme(legend.position = "bottom")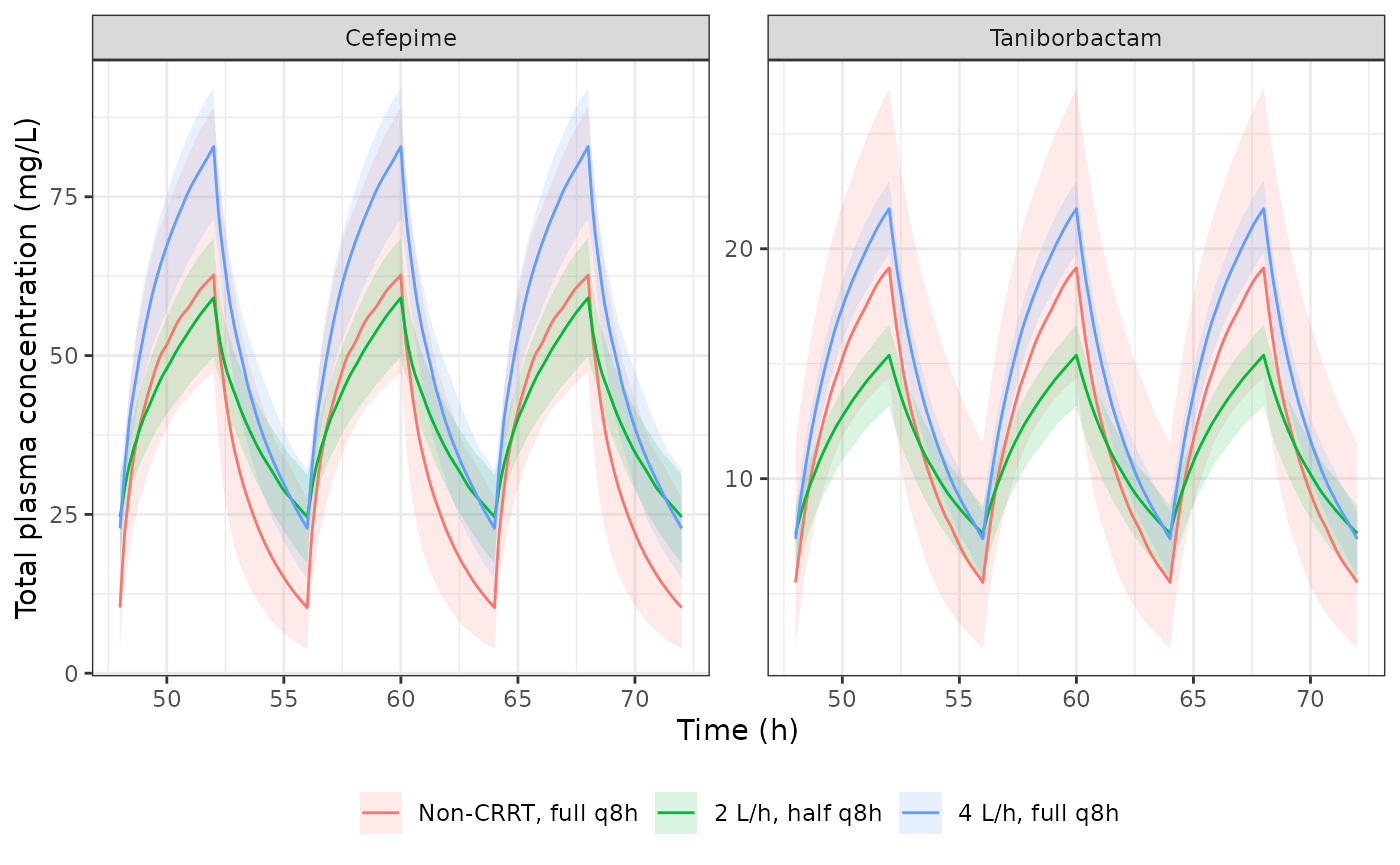
Median and 5th-95th percentile total plasma concentrations at steady state (48-72 h) for the non-CRRT control and the regimens the paper recommends: half dose q8h below 3.5 L/h and full dose q8h at 3.5-5 L/h (full = cefepime 2 g + taniborbactam 0.5 g).
PKNCA: total-drug AUC over 24 h at steady state
# A 0.25-h subsample of the simulation grid keeps PKNCA fast; the linear
# trapezoidal AUC moves by well under 1% against the full grid.
conc_df <- sim |>
  filter(!is.na(Cc), abs(time * 4 - round(time * 4)) < 1e-8) |>
  select(id, time, Cc, drug, scenario)
dose_df <- bind_rows(
  events_fep |> filter(evid == 1) |> mutate(drug = "Cefepime"),
  events_tan |> filter(evid == 1) |> mutate(drug = "Taniborbactam")
) |>
  select(id, time, amt, drug, scenario)

intervals <- data.frame(start = 48, end = 72, aucint.last = TRUE, cmin = TRUE)

conc_obj <- PKNCA::PKNCAconc(conc_df, Cc ~ time | drug + scenario / id)
dose_obj <- PKNCA::PKNCAdose(dose_df, amt ~ time | drug + scenario + id)
nca_res <- PKNCA::pk.nca(PKNCA::PKNCAdata(conc_obj, dose_obj, intervals = intervals))

nca_ind <- as.data.frame(nca_res) |>
  filter(PPTESTCD %in% c("aucint.last", "cmin")) |>
  select(drug, scenario, id, PPTESTCD, PPORRES) |>
  pivot_wider(names_from = PPTESTCD, values_from = PPORRES)
Tables 3 and 4 report the mean, SD and 25th/75th percentiles of the
total-drug AUC24h, not the median that
ncaComparisonTable() would compute from individual results,
so the simulated results are first aggregated to the per-scenario
mean.
published_auc <- tibble::tribble(
  ~scenario,            ~Cefepime, ~Taniborbactam,
  "Non-CRRT, full q8h", 949,       268,
  "2 L/h, full q8h",    1994,      525,
  "2 L/h, half q8h",    997,       263,
  "3 L/h, full q8h",    1558,      410,
  "3 L/h, half q8h",    779,       205,
  "3 L/h, full q12h",   1041,      278,
  "3 L/h, half q12h",   521,       139,
  "4 L/h, full q8h",    1267,      341,
  "4 L/h, half q8h",    633,       170,
  "4 L/h, full q12h",   846,       227,
  "4 L/h, half q12h",   423,       113,
  "5 L/h, full q8h",    1075,      289,
  "5 L/h, half q8h",    537,       145
) |>
  pivot_longer(-scenario, names_to = "drug", values_to = "aucint.last") |>
  mutate(group = paste(drug, scenario, sep = ": ")) |>
  select(group, aucint.last)

sim_mean <- nca_ind |>
  group_by(drug, scenario) |>
  summarise(aucint.last = mean(aucint.last), .groups = "drop") |>
  mutate(group = paste(drug, scenario, sep = ": ")) |>
  select(group, aucint.last)

cmp <- nlmixr2lib::ncaComparisonTable(
  simulated = sim_mean,
  reference = published_auc,
  by = "group",
  units = c(aucint.last = "mg*h/L"),
  tolerance_pct = 20
)
#> Warning: ncaParamLabel(): unknown PKNCA code(s) returned as-is: 'aucint.last'
knitr::kable(
  cmp,
  caption = "Mean total-drug AUC24h at steady state: simulated vs Tables 3 (cefepime) and 4 (taniborbactam). Full dose = cefepime 2 g / taniborbactam 0.5 g; half = 1 g / 0.25 g. * differs by more than 20%."
)| NCA parameter | group | Reference | Simulated | % diff |
|---|---|---|---|---|
| aucint.last (mg*h/L) | Cefepime: Non-CRRT, full q8h | 949 | 932 | -1.8% |
| aucint.last (mg*h/L) | Taniborbactam: Non-CRRT, full q8h | 268 | 309 | +15.2% |
| aucint.last (mg*h/L) | Cefepime: 2 L/h, full q8h | 1990 | 1980 | -0.5% |
| aucint.last (mg*h/L) | Taniborbactam: 2 L/h, full q8h | 525 | 547 | +4.1% |
| aucint.last (mg*h/L) | Cefepime: 2 L/h, half q8h | 997 | 995 | -0.2% |
| aucint.last (mg*h/L) | Taniborbactam: 2 L/h, half q8h | 263 | 271 | +3.0% |
| aucint.last (mg*h/L) | Cefepime: 3 L/h, full q8h | 1560 | 1550 | -0.5% |
| aucint.last (mg*h/L) | Taniborbactam: 3 L/h, full q8h | 410 | 425 | +3.7% |
| aucint.last (mg*h/L) | Cefepime: 3 L/h, half q8h | 779 | 773 | -0.7% |
| aucint.last (mg*h/L) | Taniborbactam: 3 L/h, half q8h | 205 | 213 | +3.7% |
| aucint.last (mg*h/L) | Cefepime: 3 L/h, full q12h | 1040 | 1030 | -1.1% |
| aucint.last (mg*h/L) | Taniborbactam: 3 L/h, full q12h | 278 | 281 | +1.1% |
| aucint.last (mg*h/L) | Cefepime: 3 L/h, half q12h | 521 | 514 | -1.4% |
| aucint.last (mg*h/L) | Taniborbactam: 3 L/h, half q12h | 139 | 142 | +2.4% |
| aucint.last (mg*h/L) | Cefepime: 4 L/h, full q8h | 1270 | 1260 | -0.4% |
| aucint.last (mg*h/L) | Taniborbactam: 4 L/h, full q8h | 341 | 346 | +1.4% |
| aucint.last (mg*h/L) | Cefepime: 4 L/h, half q8h | 633 | 630 | -0.4% |
| aucint.last (mg*h/L) | Taniborbactam: 4 L/h, half q8h | 170 | 173 | +1.6% |
| aucint.last (mg*h/L) | Cefepime: 4 L/h, full q12h | 846 | 849 | +0.3% |
| aucint.last (mg*h/L) | Taniborbactam: 4 L/h, full q12h | 227 | 231 | +2.0% |
| aucint.last (mg*h/L) | Cefepime: 4 L/h, half q12h | 423 | 421 | -0.5% |
| aucint.last (mg*h/L) | Taniborbactam: 4 L/h, half q12h | 113 | 115 | +1.8% |
| aucint.last (mg*h/L) | Cefepime: 5 L/h, full q8h | 1080 | 1070 | -0.8% |
| aucint.last (mg*h/L) | Taniborbactam: 5 L/h, full q8h | 289 | 289 | +0.0% |
| aucint.last (mg*h/L) | Cefepime: 5 L/h, half q8h | 537 | 535 | -0.3% |
| aucint.last (mg*h/L) | Taniborbactam: 5 L/h, half q8h | 145 | 146 | +0.7% |
pct <- merge(sim_mean, published_auc, by = "group", suffixes = c("_sim", "_pub")) |>
  mutate(
    drug = sub(":.*", "", group),
    pct_diff = 100 * (aucint.last_sim / aucint.last_pub - 1)
  )
pct_fep <- pct$pct_diff[pct$drug == "Cefepime"]
pct_tan <- pct$pct_diff[pct$drug == "Taniborbactam"]
stopifnot(
  length(pct_fep) == 13, length(pct_tan) == 13,
  # A mis-transcribed clearance, slope or dose shifts every scenario of a drug
  # by tens of percent.
  abs(median(pct_fep)) < 5,
  quantile(abs(pct_fep), 0.9) < 10,
  # Taniborbactam runs a few percent high on CRRT and about 15% high in the
  # control; see 'Taniborbactam non-renal clearance' below.
  abs(median(pct_tan)) < 10,
  quantile(abs(pct_tan), 0.9) < 20
)
Cefepime reproduces Table 3 closely in every scenario. Taniborbactam runs a few percent above Table 4 on CRRT and about 15% above it in the non-CRRT control; both are examined below.
The cefepime trough concentration (Table 3, ‘Cmin’) is also reproduced. The largest relative gap, at 4 L/h 2 g q12h, is against a value printed as the integer 7 mg/L:
published_cmin <- tibble::tribble(
  ~scenario,            ~published,
  "Non-CRRT, full q8h", 12.80,
  "2 L/h, full q8h",    48,
  "2 L/h, half q8h",    24,
  "3 L/h, full q8h",    32,
  "3 L/h, half q8h",    16,
  "3 L/h, full q12h",   12,
  "3 L/h, half q12h",   6,
  "4 L/h, full q8h",    22,
  "4 L/h, half q8h",    11,
  "4 L/h, full q12h",   7,
  "4 L/h, half q12h",   4,
  "5 L/h, full q8h",    16,
  "5 L/h, half q8h",    8
)
cmin_cmp <- nca_ind |>
  filter(drug == "Cefepime") |>
  group_by(scenario) |>
  summarise(simulated = mean(cmin), .groups = "drop") |>
  mutate(scenario = as.character(scenario)) |>
  left_join(published_cmin, by = "scenario") |>
  mutate(pct_diff = 100 * (simulated / published - 1))
stopifnot(abs(median(cmin_cmp$pct_diff)) < 10)

cmin_cmp |>
  rename(
    "Scenario" = scenario,
    "Simulated mean Cmin (mg/L)" = simulated,
    "Table 3 mean Cmin (mg/L)" = published,
    "Difference (%)" = pct_diff
  ) |>
knitr::kable(digits = 1, caption = "Cefepime mean steady-state trough: simulated vs Table 3.")| Scenario | Simulated mean Cmin (mg/L) | Table 3 mean Cmin (mg/L) | Difference (%) |
|---|---|---|---|
| Non-CRRT, full q8h | 12.9 | 12.8 | 0.8 |
| 2 L/h, full q8h | 49.3 | 48.0 | 2.8 |
| 2 L/h, half q8h | 24.5 | 24.0 | 1.9 |
| 3 L/h, full q8h | 32.7 | 32.0 | 2.2 |
| 3 L/h, half q8h | 15.8 | 16.0 | -1.5 |
| 3 L/h, full q12h | 12.5 | 12.0 | 3.9 |
| 3 L/h, half q12h | 6.1 | 6.0 | 1.0 |
| 4 L/h, full q8h | 22.9 | 22.0 | 4.3 |
| 4 L/h, half q8h | 10.6 | 11.0 | -3.6 |
| 4 L/h, full q12h | 8.2 | 7.0 | 17.8 |
| 4 L/h, half q12h | 4.0 | 4.0 | -0.5 |
| 5 L/h, full q8h | 16.6 | 16.0 | 3.5 |
| 5 L/h, half q8h | 8.1 | 8.0 | 0.9 |
Probability of target attainment
The targets are 43.7% fT>MIC for cefepime and
fAUC24h/MIC >= 4 for taniborbactam, evaluated on the
unbound concentration Cu over the steady-state 48-72 h
window.
mics <- c(4, 8, 16, 32)

sim_win <- sim |>
  filter(time >= 48, time <= 72) |>
  arrange(drug, id, time)

fauc_ind <- sim_win |>
  group_by(drug, scenario, id) |>
  summarise(
    fauc = sum(diff(time) * (head(Cu, -1) + tail(Cu, -1)) / 2),
    .groups = "drop"
  )

# On the uniform grid, the share of grid intervals whose left end is above the
# MIC approximates fT>MIC.
ft_ind <- sim_win |>
  filter(time < 72) |>
  select(drug, scenario, id, Cu) |>
  tidyr::expand_grid(mic = mics) |>
  group_by(drug, scenario, id, mic) |>
  summarise(ft_above = mean(Cu > mic), .groups = "drop")

pta <- ft_ind |>
  left_join(fauc_ind, by = c("drug", "scenario", "id")) |>
  mutate(attained = ifelse(drug == "Cefepime", ft_above >= 0.437, fauc / mic >= 4)) |>
  group_by(drug, scenario, mic) |>
  summarise(pta = mean(attained), .groups = "drop")

# Tables 3 and 4: every regimen attains the target in all patients at MIC 4
# and 8 mg/L.
stopifnot(all(pta$pta[pta$mic <= 8] > 0.9))
The discriminating MIC is 32 mg/L for both drugs (16 mg/L for the cefepime 1 g q12h arm at 4 L/h):
published_pta32 <- tibble::tribble(
  ~scenario,            ~Cefepime, ~Taniborbactam,
  "Non-CRRT, full q8h", 0.73,      1,
  "2 L/h, full q8h",    1,         1,
  "2 L/h, half q8h",    0.9,       1,
  "3 L/h, full q8h",    1,         1,
  "3 L/h, half q8h",    0.2,       1,
  "3 L/h, full q12h",   0.9,       1,
  "3 L/h, half q12h",   0.0,       0.4,
  "4 L/h, full q8h",    1,         1,
  "4 L/h, half q8h",    0.0,       0.9,
  "4 L/h, full q12h",   0.2,       1,
  "4 L/h, half q12h",   0.0,       0.0,
  "5 L/h, full q8h",    1,         1,
  "5 L/h, half q8h",    0.0,       0.5
) |>
  pivot_longer(-scenario, names_to = "drug", values_to = "published")

pta |>
  filter(mic == 32) |>
  mutate(scenario = as.character(scenario)) |>
  left_join(published_pta32, by = c("drug", "scenario")) |>
  select(drug, scenario, simulated = pta, published) |>
  rename(
    "Drug" = drug,
    "Scenario" = scenario,
    "Simulated PTA, MIC 32" = simulated,
    "Published PTA, MIC 32" = published
  ) |>
knitr::kable(digits = 2, caption = "PTA at MIC 32 mg/L: simulated vs Tables 3 and 4.")| Drug | Scenario | Simulated PTA, MIC 32 | Published PTA, MIC 32 |
|---|---|---|---|
| Cefepime | Non-CRRT, full q8h | 0.65 | 0.73 |
| Cefepime | 2 L/h, full q8h | 1.00 | 1.00 |
| Cefepime | 2 L/h, half q8h | 0.92 | 0.90 |
| Cefepime | 3 L/h, full q8h | 1.00 | 1.00 |
| Cefepime | 3 L/h, half q8h | 0.07 | 0.20 |
| Cefepime | 3 L/h, full q12h | 0.90 | 0.90 |
| Cefepime | 3 L/h, half q12h | 0.00 | 0.00 |
| Cefepime | 4 L/h, full q8h | 1.00 | 1.00 |
| Cefepime | 4 L/h, half q8h | 0.00 | 0.00 |
| Cefepime | 4 L/h, full q12h | 0.13 | 0.20 |
| Cefepime | 4 L/h, half q12h | 0.00 | 0.00 |
| Cefepime | 5 L/h, full q8h | 1.00 | 1.00 |
| Cefepime | 5 L/h, half q8h | 0.00 | 0.00 |
| Taniborbactam | Non-CRRT, full q8h | 1.00 | 1.00 |
| Taniborbactam | 2 L/h, full q8h | 1.00 | 1.00 |
| Taniborbactam | 2 L/h, half q8h | 1.00 | 1.00 |
| Taniborbactam | 3 L/h, full q8h | 1.00 | 1.00 |
| Taniborbactam | 3 L/h, half q8h | 1.00 | 1.00 |
| Taniborbactam | 3 L/h, full q12h | 1.00 | 1.00 |
| Taniborbactam | 3 L/h, half q12h | 0.38 | 0.40 |
| Taniborbactam | 4 L/h, full q8h | 1.00 | 1.00 |
| Taniborbactam | 4 L/h, half q8h | 1.00 | 0.90 |
| Taniborbactam | 4 L/h, full q12h | 1.00 | 1.00 |
| Taniborbactam | 4 L/h, half q12h | 0.00 | 0.00 |
| Taniborbactam | 5 L/h, full q8h | 1.00 | 1.00 |
| Taniborbactam | 5 L/h, half q8h | 0.54 | 0.50 |
The PTA at 32 mg/L sits on a steep edge of the exposure distribution, so the simulated and published values are expected to agree in direction rather than to the decimal. Every arm of either drug with a published PTA of 0 or 1 is matched. The intermediate values (0.2-0.9) depend on the dispersion of the Pmetrics simulation; the largest gaps are cefepime 3 L/h 1 g q8h (0.07 against 0.2) and taniborbactam 4 L/h 0.25 g q8h (1.0 against 0.9).
Sensitivity analyses: filter- and mode-specific CLTM
Supplement Tables S3 and S4 repeat the simulations with the full
multiple linear regression of Table 2. The full and the effluent-only
regressions share the effluent slope (0.86 and 0.79), so the full
regression only changes the CLTM intercept:
0.07 + 0.25 x HF1400 + 0.66 x CVVHD for cefepime and
0.10 + 0.17 x HF1400 + 0.56 x CVVHD for taniborbactam
(ST150 = 0, CVVH = 0). Overriding lcl_crrt with that
intercept reproduces the full-dose rows of Tables S3 and S4 from the
typical clearance (steady-state AUC24h = daily dose /
CL).
sens <- tidyr::expand_grid(
  effluent = c(3, 4, 5),
  mode = c("CVVH", "CVVHD"),
  filter = c("ST150", "HF1400")
) |>
  mutate(
    hf = as.numeric(filter == "HF1400"),
    cvvhd = as.numeric(mode == "CVVHD"),
    published_fep = c(
      1703, 1601, 1447, 1357, # Table S3, 3 L/h, 2 g q8h
      1368, 1301, 1197, 1135, # 4 L/h
      1142, 1092, 1018, 975 # 5 L/h
    ),
    published_tan = c(
      445, 432, 388, 369, # Table S4, 3 L/h, 0.5 g q8h
      360, 352, 322, 309, # 4 L/h
      304, 296, 274, 265 # 5 L/h
    )
  )

sens_auc <- function(mod, intercept, daily_mg) {
  ev <- sens |>
    transmute(
      id = row_number(), time = 0, evid = 0, amt = 0, cmt = "central",
      CRCL = 90, RENALIMP_ESRD = 0, DIS_CUTI = 0, RRT_CRRT_STATUS = 1,
      RRT_CRRT_EFFLUENT_FLOW = effluent * 1000
    )
  # rxSolve matches a params data frame to subjects by row order, so it is
  # built in the same id order as the event table.
  params <- data.frame(lcl_crrt = log(intercept))
  cl <- rxode2::rxSolve(rxode2::zeroRe(mod), ev, params = params,
                        returnType = "data.frame")$cl
  daily_mg / cl
}

sens <- sens |>
  mutate(
    model_fep = sens_auc(mod_fep, 0.07 + 0.25 * hf + 0.66 * cvvhd, 6000),
    model_tan = sens_auc(mod_tan, 0.10 + 0.17 * hf + 0.56 * cvvhd, 1500),
    pct_fep = 100 * (model_fep / published_fep - 1),
    pct_tan = 100 * (model_tan / published_tan - 1)
  )
#> ℹ parameter labels from comments will be replaced by 'label()'
#> ℹ omega/sigma items treated as zero: 'etalvc', 'etalvp', 'etalq', 'etalcl_nonren'
#> ℹ parameter labels from comments will be replaced by 'label()'
#> ℹ omega/sigma items treated as zero: 'etalvp', 'etalq', 'etalcl_nonren'
#> Warning: There were 2 warnings in `mutate()`.
#> The first warning was:
#> ℹ In argument: `model_fep = sens_auc(mod_fep, 0.07 + 0.25 * hf + 0.66 * cvvhd,
#>   6000)`.
#> Caused by warning:
#> ! multi-subject simulation without without 'omega'
#> ℹ Run `dplyr::last_dplyr_warnings()` to see the 1 remaining warning.
# Cefepime: typical-value steady state against the simulated mean; the
# variability on CL_NR shifts the mean by well under 1%.
stopifnot(all(abs(sens$pct_fep) < 2))

sens |>
  select(effluent, mode, filter, model_fep, published_fep, model_tan, published_tan) |>
  rename(
    "Effluent (L/h)" = effluent,
    "Mode" = mode,
    "Filter" = filter,
    "Cefepime model" = model_fep,
    "Cefepime Table S3" = published_fep,
    "Taniborbactam model" = model_tan,
    "Taniborbactam Table S4" = published_tan
  ) |>
knitr::kable(digits = 0, caption = "Steady-state total AUC24h (mg*h/L), full dose q8h, with the filter- and mode-specific CL_TM.")| Effluent (L/h) | Mode | Filter | Cefepime model | Cefepime Table S3 | Taniborbactam model | Taniborbactam Table S4 |
|---|---|---|---|---|---|---|
| 3 | CVVH | ST150 | 1705 | 1703 | 463 | 445 |
| 3 | CVVH | HF1400 | 1592 | 1601 | 440 | 432 |
| 3 | CVVHD | ST150 | 1435 | 1447 | 395 | 388 |
| 3 | CVVHD | HF1400 | 1354 | 1357 | 378 | 369 |
| 4 | CVVH | ST150 | 1370 | 1368 | 372 | 360 |
| 4 | CVVH | HF1400 | 1296 | 1301 | 357 | 352 |
| 4 | CVVHD | ST150 | 1190 | 1197 | 327 | 322 |
| 4 | CVVHD | HF1400 | 1134 | 1135 | 315 | 309 |
| 5 | CVVH | ST150 | 1145 | 1142 | 311 | 304 |
| 5 | CVVH | HF1400 | 1093 | 1092 | 301 | 296 |
| 5 | CVVHD | ST150 | 1017 | 1018 | 279 | 274 |
| 5 | CVVHD | HF1400 | 976 | 975 | 270 | 265 |
Taniborbactam non-renal clearance
Cefepime reproduces Tables 3 and S3 to within about 1% at the printed non-renal clearance of 0.87 L/h, but taniborbactam with its printed 0.77 L/h runs 1.5-5% above Tables 4 and S4, with the largest gap at the lowest effluent flow (where the non-renal clearance is the largest share of the total). Evaluating the typical steady-state AUC with the cefepime value, 0.87 L/h, removes the gap across all 18 CRRT rows:
tan_rows <- bind_rows(
  sens |>
    transmute(
      row = paste("S4:", effluent, "L/h", mode, filter),
      effluent, intercept = 0.10 + 0.17 * hf + 0.56 * cvvhd,
      daily = 1500, published = published_tan
    ),
  tibble::tribble(
    ~row,                 ~effluent, ~daily, ~published,
    "4: 2 L/h, 0.5 g q8h",  2,       1500,   525,
    "4: 3 L/h, 0.5 g q8h",  3,       1500,   410,
    "4: 3 L/h, 0.5 g q12h", 3,       1000,   278,
    "4: 4 L/h, 0.5 g q8h",  4,       1500,   341,
    "4: 4 L/h, 0.5 g q12h", 4,       1000,   227,
    "4: 5 L/h, 0.5 g q8h",  5,       1500,   289
  ) |>
    mutate(intercept = 0.38)
)
tan_ev <- tan_rows |>
  transmute(
    id = row_number(), time = 0, evid = 0, amt = 0, cmt = "central",
    CRCL = 90, RENALIMP_ESRD = 0, RRT_CRRT_STATUS = 1,
    RRT_CRRT_EFFLUENT_FLOW = effluent * 1000
  )
cl_with <- function(cl_nr) {
  params <- data.frame(lcl_crrt = log(tan_rows$intercept), lcl_nonren = log(cl_nr))
  rxode2::rxSolve(rxode2::zeroRe(mod_tan), tan_ev, params = params,
                  returnType = "data.frame")$cl
}
tan_rows <- tan_rows |>
  mutate(
    pct_077 = 100 * (daily / cl_with(0.77) / published - 1),
    pct_087 = 100 * (daily / cl_with(0.87) / published - 1)
  )
#> ℹ parameter labels from comments will be replaced by 'label()'
#> ℹ omega/sigma items treated as zero: 'etalvp', 'etalq', 'etalcl_nonren'
#> ℹ parameter labels from comments will be replaced by 'label()'
#> ℹ omega/sigma items treated as zero: 'etalvp', 'etalq', 'etalcl_nonren'
#> Warning: There were 2 warnings in `mutate()`.
#> The first warning was:
#> ℹ In argument: `pct_077 = 100 * (daily/cl_with(0.77)/published - 1)`.
#> Caused by warning:
#> ! multi-subject simulation without without 'omega'
#> ℹ Run `dplyr::last_dplyr_warnings()` to see the 1 remaining warning.
stopifnot(
  nrow(tan_rows) == 18,
  median(tan_rows$pct_077) > 2,
  abs(median(tan_rows$pct_087)) < 1
)

tan_rows |>
  select(row, published, pct_077, pct_087) |>
  rename(
    "Table row" = row,
    "Published AUC24h" = published,
    "Difference with CL_NR 0.77 (%)" = pct_077,
    "Difference with CL_NR 0.87 (%)" = pct_087
  ) |>
knitr::kable(digits = 1, caption = "Taniborbactam typical steady-state AUC24h against Tables 4 and S4 under the printed (0.77 L/h) and the cefepime (0.87 L/h) non-renal clearance.")| Table row | Published AUC24h | Difference with CL_NR 0.77 (%) | Difference with CL_NR 0.87 (%) |
|---|---|---|---|
| S4: 3 L/h CVVH ST150 | 445 | 4.0 | 0.9 |
| S4: 3 L/h CVVH HF1400 | 432 | 1.8 | -1.1 |
| S4: 3 L/h CVVHD ST150 | 388 | 1.7 | -0.9 |
| S4: 3 L/h CVVHD HF1400 | 369 | 2.4 | -0.1 |
| S4: 4 L/h CVVH ST150 | 360 | 3.4 | 0.9 |
| S4: 4 L/h CVVH HF1400 | 352 | 1.5 | -0.9 |
| S4: 4 L/h CVVHD ST150 | 322 | 1.5 | -0.7 |
| S4: 4 L/h CVVHD HF1400 | 309 | 2.0 | -0.1 |
| S4: 5 L/h CVVH ST150 | 304 | 2.4 | 0.3 |
| S4: 5 L/h CVVH HF1400 | 296 | 1.6 | -0.4 |
| S4: 5 L/h CVVHD ST150 | 274 | 1.8 | -0.1 |
| S4: 5 L/h CVVHD HF1400 | 265 | 2.0 | 0.2 |
| 4: 2 L/h, 0.5 g q8h | 525 | 4.7 | 1.0 |
| 4: 3 L/h, 0.5 g q8h | 410 | 3.9 | 1.1 |
| 4: 3 L/h, 0.5 g q12h | 278 | 2.2 | -0.6 |
| 4: 4 L/h, 0.5 g q8h | 341 | 2.1 | -0.3 |
| 4: 4 L/h, 0.5 g q12h | 227 | 2.2 | -0.1 |
| 4: 5 L/h, 0.5 g q8h | 289 | 1.8 | -0.2 |
The model keeps the printed 0.77 L/h. The match at 0.87 suggests that the published taniborbactam CRRT simulations may have used the cefepime non-renal clearance, but the paper does not say so, and the dosing conclusions do not change (the difference is 1.5-5% of AUC).
Assumptions and deviations
- Source of the population PK model. The base model is the sponsor’s population PK analysis (data on file), printed in the supplement as typical values plus the dispersion used in the simulations. No published version of that model is cited. The model here is the simulation model of this paper: typical values, the stated CVs and the CLTM regressions.
-
Variability. The Pmetrics simulator draws from the
stated means and CVs; the variability is carried here as log-normal with
omega^2 = log(CV^2 + 1). Cefepime: Vc 53.8%, Vp 6.26%, Q 30%.
Taniborbactam: Vp 30%, Q 30%. Both drugs: 30% on the non-renal clearance
in the CRRT arm only. The paper states no variability for taniborbactam
Vc or for the non-CRRT clearance beyond the 15% CV on creatinine
clearance (a covariate distribution, applied in the virtual cohort
above, not an
eta). - Cefepime Vp CV of 6.26%. The supplement gives the cefepime Vp CV as 6.26%, the same digits as the Vp typical value (6.26 L). It is encoded as printed. It has no effect on AUC and a negligible effect on the PTA.
- ESRD and cUTI/AP shifts. Both are part of the printed sponsor clearance equations and are encoded in the non-CRRT arm. The paper’s control simulations used ESRD = 0 and applied the cefepime cUTI/AP factor (the printed 5.1, 6.78 and 8.29 L/h include x 1.281). Neither applies in the CRRT arm.
- Taniborbactam non-CRRT control. The simulated control AUC24h is about 15% above Table 4 (268 mgh/L). The printed typical clearances (3.83, 5.15 and 6.35 L/h for a 1,500 mg daily dose) by themselves imply a steady-state mean near 306 mgh/L, so the gap is in the source, not in the encoding; no parameter was changed.
- Taniborbactam non-renal clearance. See the section above: the printed 0.77 L/h is kept although 0.87 L/h reproduces Tables 4 and S4 more closely.
- Spread of the taniborbactam CRRT AUC. Table 4 reports CVs of 10-17% for the CRRT scenarios. The stated dispersion (30% CV on a non-renal clearance of 0.77 L/h within a total of 2.7-5.1 L/h) implies an AUC CV of only about 4-9%, so the published spread must include variability that the paper does not state. The mean is unaffected.
-
CLTM regression. The effluent-only
regression is encoded because the paper used it for all dosing
simulations. The full regression of Table 2 (with filter and mode terms)
was used only for the sensitivity analyses of Tables S3 and S4; it
differs only in the intercept, which the section above supplies through
lcl_crrt. - Residual renal function and drug adsorption. The CRRT arm assumes no residual renal function (Discussion limitation) and no adsorption to the filter (adsorption < 20%, judged negligible by the authors).
-
No residual error. The source is a simulation
study, so
propSdis fixed to 0. - Cohort size. 100 subjects per CRRT scenario and 180 in the control, rather than the paper’s 1,000.