Pyrazinamide and ethambutol in HIV-associated critical illness (Rao 2021)
Source:vignettes/articles/Rao_2021_antituberculosis_critical_illness.Rmd
Rao_2021_antituberculosis_critical_illness.RmdModel and source
Rao 2021 fitted four separate population PK models, one per first-line anti-tuberculosis drug, to steady-state serum concentrations from Ugandan adults living with HIV who were hospitalised with sepsis. Two of the four are packaged here:
-
Rao_2021_pyrazinamide: One-compartment population pharmacokinetic model with first-order absorption, an absorption lag time and linear elimination for oral pyrazinamide in Ugandan adults living with HIV and hospitalised with sepsis (with or without tuberculous meningitis) who were starting first-line anti-tuberculosis therapy (Rao 2021). No covariates were retained; the additive residual-error magnitude is not reported and is carried as fixed(0). -
Rao_2021_ethambutol: One-compartment population pharmacokinetic model with first-order absorption, an absorption lag time and linear elimination for oral ethambutol in Ugandan adults living with HIV and hospitalised with sepsis (with or without tuberculous meningitis) who were starting first-line anti-tuberculosis therapy (Rao 2021). No covariates were retained; the additive residual-error magnitude is not reported and is carried as fixed(0). - Citation: Rao PS, Moore CC, Mbonde AA, Nuwagira E, Orikiriza P, Nyehangane D, Al-Shaer MH, Peloquin CA, Gratz J, Pholwat S, Arinaitwe R, Boum Y, Mwanga-Amumpaire J, Houpt ER, Kagan L, Heysell SK, Muzoora C. Population Pharmacokinetics and Significant Under-Dosing of Anti-Tuberculosis Medications in People with HIV and Critical Illness. Antibiotics (Basel). 2021;10(6):739. doi:10.3390/antibiotics10060739
- Article (open access): https://doi.org/10.3390/antibiotics10060739
The rifampin and isoniazid models from the same paper are not packaged. The section Rifampin and isoniazid explains why.
Population
Rao 2021 (Methods 4.1, Results, Table 1) enrolled 81 consecutive people living with HIV at Mbarara Regional Referral Hospital, Uganda. Each met the sepsis definition (two or more SIRS criteria plus suspected infection), with or without suspected tuberculous meningitis, and was starting first-line therapy for presumed drug-susceptible tuberculosis. Of the 81, 36.3% were women. The median (IQR) age was 36 (30-43.5) years, weight 52.5 (45.3-58) kg and mid-upper arm circumference 22 (20.4-24) cm. The median CD4 count was 169 cells/mm3, 76% were on antiretroviral therapy and 33% had concurrent meningitis. By the two-week PK visit 18 had died and 14 had been lost to follow-up, withdrawn or had incomplete sampling, which left 49 patients in the PK analysis (26 with microbiologically confirmed TB and 23 with clinical TB; Table 2). Table 1 describes the 81 enrolled, not the 49 analysed.
Drugs were given once daily as weight-based fixed-dose combinations. The median (IQR) dose was 25.4 (23-28) mg/kg for pyrazinamide and 18.4 (16.5-19.6) mg/kg for ethambutol. Serum was sampled at 1, 2, 4 and 6 h post-dose after two weeks of treatment, and each model was fitted to 173 concentrations (Results 2.3, 2.4).
The same information is available programmatically:
str(readModelDb("Rao_2021_pyrazinamide")()$population, give.attr = FALSE)
#> List of 13
#>  $ species         : chr "human"
#>  $ n_subjects      : int 49
#>  $ n_studies       : int 1
#>  $ age_range       : chr "adults over 18 years (enrolled cohort of 81: median 36 years, IQR 30-43.5)"
#>  $ age_median      : chr "36 years (enrolled cohort of 81)"
#>  $ weight_range    : chr "enrolled cohort of 81: IQR 45.3-58 kg"
#>  $ weight_median   : chr "52.5 kg (enrolled cohort of 81)"
#>  $ sex_female_pct  : num 36.3
#>  $ hiv_positive_pct: num 100
#>  $ disease_state   : chr "People living with HIV hospitalised with sepsis (two or more SIRS criteria plus suspected infection), with or w"| __truncated__
#>  $ dose_range      : chr "Weight-based fixed-dose combination rifampin/isoniazid/pyrazinamide/ethambutol once daily; pyrazinamide median "| __truncated__
#>  $ regions         : chr "Uganda (Mbarara Regional Referral Hospital)."
#>  $ notes           : chr "81 enrolled; 49 completed PK testing (18 died, 13 lost to follow-up or withdrew, 1 incomplete). Sparse serum sa"| __truncated__
Source trace
Both packaged models are one-compartment models with first-order absorption, an absorption lag time, linear elimination and an additive residual error (Results 2.3 and 2.4). Neither retains a covariate. All parameters are apparent oral values.
| Equation / parameter | Pyrazinamide | Ethambutol | Source location |
|---|---|---|---|
lka (ka, 1/h) |
log(0.08) | log(0.15) | Table 3, ‘Estimate (%CV)’ |
lvc (V/F, L) |
log(1.5) | log(75.17) | Table 3 |
lcl (CL/F, L/h) |
log(2.6) | log(51.6) | Table 3 |
ltlag (Tlag, h) |
log(0.2) | log(0.4) | Table 3 |
etalka (variance) |
0.1 | 0.6 | Table 3, ‘IIV (Shrinkage)’; pyrazinamide printed ‘0.1-0.11’ |
etalvc (variance) |
0.9 | 0.4 | Table 3 |
etalcl (variance) |
0.4 | 0.3 | Table 3 |
etaltlag (variance) |
1.3 | 0.6 | Table 3 |
addSd (mg/L) |
fixed(0) | fixed(0) | Additive error named in Results 2.3 / 2.4; magnitude not reported |
d/dt(depot), d/dt(central),
alag(depot)
|
– | – | Results 2.3 / 2.4: ‘one-compartment distribution model with a lag-time for oral absorption’ |
exponential IIV, exp(theta + eta)
|
– | – | Methods 4.4: ‘Interindividual variability was included using exponential function’ |
Rifampin and isoniazid
Table 3 of Rao 2021 also lists final estimates for rifampin (one-compartment, lag, additive error) and isoniazid (two-compartment, lag, proportional error). Neither can be packaged faithfully from the published text:
- Rifampin. Results 2.1 states that ‘weight was a significant covariate for clearance’, but the weight coefficient is not reported. The printed clearance, 0.1 L/h, is therefore the intercept of an unstated covariate equation, not a typical value. Read on its own, it gives a steady-state AUC0-24 of 6000 mgh/L for 600 mg, where the paper’s observed median is 21.7 mgh/L. The Methods say only that covariates enter ‘using an exponential function in multiplicative fashion’, and the centring is not given.
- Isoniazid. Results 2.2 retains a mid-upper arm circumference (MUAC) effect on the central volume, which is printed as 2.9 L, but the coefficient is not reported. Separately, the printed clearance of 9.2 L/h cannot reproduce the paper’s own Table 4 simulation. AUC0-24 after a fully absorbed dose is dose / CL whatever the volume, so it would be about 32.6 mgh/L at 300 mg, against the Table 4 median of 10.2 mgh/L.
The paper has no supplement, and its data are available only on request from the corresponding author. These are gaps in what was reported, not missing files. Both models can be added if the coefficients become available.
Virtual cohort and simulation
Table 4 of Rao 2021 summarises Cmax and AUC0-24 simulated from the final models at five dose levels per drug. Solving the typical-value models (below) shows that those simulations are single-dose profiles. A single pyrazinamide dose reproduces the Table 4 medians to within about 7%. Steady state overshoots them by more than 20%, because pyrazinamide absorption is slow (ka = 0.08 1/h) and accumulates.
Neither model has covariates, so the virtual cohort is 100 subjects
per dose level. Each gets one oral dose into depot with
observations on central every 0.25 h to 24 h.
doses <- list(
  pyrazinamide = c(1000, 1500, 2000, 2500, 3000),
  ethambutol = c(800, 1200, 1600, 2000, 2400)
)
n_per_arm <- 100L
obs_times <- seq(0, 24, by = 0.25)

make_arm <- function(drug, dose, id_offset) {
  ids <- id_offset + seq_len(n_per_arm)
  dose_rows <- tibble(
    id = ids, time = 0, amt = dose, evid = 1L, cmt = "depot"
  )
  obs_rows <- tidyr::expand_grid(id = ids, time = obs_times) |>
    mutate(amt = 0, evid = 0L, cmt = "central")
  bind_rows(dose_rows, obs_rows) |>
    mutate(drug = drug, treatment = paste(dose, "mg")) |>
    arrange(id, time, desc(evid))
}

events <- list()
for (drug in names(doses)) {
  arms <- lapply(seq_along(doses[[drug]]), function(i) {
    make_arm(drug, doses[[drug]][i], id_offset = (i - 1L) * n_per_arm)
  })
  events[[drug]] <- bind_rows(arms)
  stopifnot(!anyDuplicated(unique(events[[drug]][, c("id", "time", "evid")])))
}
rxode2::rxSetSeed(20210618)
mods <- list(
  pyrazinamide = readModelDb("Rao_2021_pyrazinamide"),
  ethambutol = readModelDb("Rao_2021_ethambutol")
)
sim <- bind_rows(lapply(names(mods), function(drug) {
  as.data.frame(rxode2::rxSolve(
    mods[[drug]],
    events = events[[drug]],
    keep = c("drug", "treatment")
  ))
}))
#> ℹ parameter labels from comments will be replaced by 'label()'
#> ℹ parameter labels from comments will be replaced by 'label()'
Typical-value replication of Table 4
The Table 4 medians summarise individual profiles, which the paper simulated from the 49 patients’ own parameter estimates. The typical-value solve is the deterministic anchor for those medians.
published_t4 <- tibble::tribble(
  ~drug, ~dose, ~cmax, ~auc24, ~cmax_target, ~auc_target, ~pct_cmax, ~pct_auc,
  "pyrazinamide", 1000, 25.7, 303.8, 20, 363, 69.4, 42.9,
  "pyrazinamide", 1500, 38.0, 466.0, 20, 363, 89.8, 71.4,
  "pyrazinamide", 2000, 50.4, 624.7, 20, 363, 91.8, 85.1,
  "pyrazinamide", 2500, 63.1, 778.5, 20, 363, 96.0, 89.6,
  "pyrazinamide", 3000, 75.8, 933.0, 20, 363, 98.0, 91.7,
  "ethambutol", 800, 1.6, 13.0, 2, NA, 32.6, NA,
  "ethambutol", 1200, 2.4, 19.5, 2, NA, 63.2, NA,
  "ethambutol", 1600, 3.2, 26.0, 2, NA, 89.8, NA,
  "ethambutol", 2000, 3.9, 32.5, 2, NA, 93.8, NA,
  "ethambutol", 2400, 4.7, 39.0, 2, NA, 93.8, NA
)

trap_auc <- function(time, conc) {
  sum(diff(time) * (head(conc, -1) + tail(conc, -1)) / 2)
}

typical_profile <- function(drug, dose, steady_state = FALSE) {
  ev <- if (steady_state) {
    rxode2::et(amt = dose, cmt = "depot", ii = 24, addl = 29) |>
      rxode2::et(seq(696, 720, by = 0.05), cmt = "central")
  } else {
    rxode2::et(amt = dose, cmt = "depot") |>
      rxode2::et(seq(0, 24, by = 0.05), cmt = "central")
  }
  s <- as.data.frame(rxode2::rxSolve(rxode2::zeroRe(mods[[drug]]), events = ev))
  tibble(cmax = max(s$Cc), auc24 = trap_auc(s$time, s$Cc))
}

typical <- published_t4 |>
  rowwise() |>
  mutate(
    sd = list(typical_profile(drug, dose)),
    ss = list(typical_profile(drug, dose, steady_state = TRUE))
  ) |>
  ungroup() |>
  mutate(
    cmax_sd = sapply(sd, `[[`, "cmax"),
    auc_sd = sapply(sd, `[[`, "auc24"),
    cmax_ss = sapply(ss, `[[`, "cmax"),
    auc_ss = sapply(ss, `[[`, "auc24"),
    pct_cmax_sd = 100 * (cmax_sd - cmax) / cmax,
    pct_auc_sd = 100 * (auc_sd - auc24) / auc24,
    pct_auc_ss = 100 * (auc_ss - auc24) / auc24
  )
#> ℹ parameter labels from comments will be replaced by 'label()'
#> ℹ omega/sigma items treated as zero: 'etalka', 'etalvc', 'etalcl', 'etaltlag'
#> ℹ parameter labels from comments will be replaced by 'label()'
#> ℹ omega/sigma items treated as zero: 'etalka', 'etalvc', 'etalcl', 'etaltlag'
#> ℹ parameter labels from comments will be replaced by 'label()'
#> ℹ omega/sigma items treated as zero: 'etalka', 'etalvc', 'etalcl', 'etaltlag'
#> ℹ parameter labels from comments will be replaced by 'label()'
#> ℹ omega/sigma items treated as zero: 'etalka', 'etalvc', 'etalcl', 'etaltlag'
#> ℹ parameter labels from comments will be replaced by 'label()'
#> ℹ omega/sigma items treated as zero: 'etalka', 'etalvc', 'etalcl', 'etaltlag'
#> ℹ parameter labels from comments will be replaced by 'label()'
#> ℹ omega/sigma items treated as zero: 'etalka', 'etalvc', 'etalcl', 'etaltlag'
#> ℹ parameter labels from comments will be replaced by 'label()'
#> ℹ omega/sigma items treated as zero: 'etalka', 'etalvc', 'etalcl', 'etaltlag'
#> ℹ parameter labels from comments will be replaced by 'label()'
#> ℹ omega/sigma items treated as zero: 'etalka', 'etalvc', 'etalcl', 'etaltlag'
#> ℹ parameter labels from comments will be replaced by 'label()'
#> ℹ omega/sigma items treated as zero: 'etalka', 'etalvc', 'etalcl', 'etaltlag'
#> ℹ parameter labels from comments will be replaced by 'label()'
#> ℹ omega/sigma items treated as zero: 'etalka', 'etalvc', 'etalcl', 'etaltlag'
#> ℹ parameter labels from comments will be replaced by 'label()'
#> ℹ omega/sigma items treated as zero: 'etalka', 'etalvc', 'etalcl', 'etaltlag'
#> ℹ parameter labels from comments will be replaced by 'label()'
#> ℹ omega/sigma items treated as zero: 'etalka', 'etalvc', 'etalcl', 'etaltlag'
#> ℹ parameter labels from comments will be replaced by 'label()'
#> ℹ omega/sigma items treated as zero: 'etalka', 'etalvc', 'etalcl', 'etaltlag'
#> ℹ parameter labels from comments will be replaced by 'label()'
#> ℹ omega/sigma items treated as zero: 'etalka', 'etalvc', 'etalcl', 'etaltlag'
#> ℹ parameter labels from comments will be replaced by 'label()'
#> ℹ omega/sigma items treated as zero: 'etalka', 'etalvc', 'etalcl', 'etaltlag'
#> ℹ parameter labels from comments will be replaced by 'label()'
#> ℹ omega/sigma items treated as zero: 'etalka', 'etalvc', 'etalcl', 'etaltlag'
#> ℹ parameter labels from comments will be replaced by 'label()'
#> ℹ omega/sigma items treated as zero: 'etalka', 'etalvc', 'etalcl', 'etaltlag'
#> ℹ parameter labels from comments will be replaced by 'label()'
#> ℹ omega/sigma items treated as zero: 'etalka', 'etalvc', 'etalcl', 'etaltlag'
#> ℹ parameter labels from comments will be replaced by 'label()'
#> ℹ omega/sigma items treated as zero: 'etalka', 'etalvc', 'etalcl', 'etaltlag'
#> ℹ parameter labels from comments will be replaced by 'label()'
#> ℹ omega/sigma items treated as zero: 'etalka', 'etalvc', 'etalcl', 'etaltlag'

typical |>
  select(drug, dose, cmax, cmax_sd, auc24, auc_sd, auc_ss, pct_cmax_sd, pct_auc_sd, pct_auc_ss) |>
  dplyr::rename(
    "Drug" = drug,
    "Dose (mg)" = dose,
    "Table 4 Cmax" = cmax,
    "Typical single-dose Cmax" = cmax_sd,
    "Table 4 AUC0-24" = auc24,
    "Typical single-dose AUC0-24" = auc_sd,
    "Typical steady-state AUC0-24" = auc_ss,
    "Cmax % diff (single dose)" = pct_cmax_sd,
    "AUC % diff (single dose)" = pct_auc_sd,
    "AUC % diff (steady state)" = pct_auc_ss
  ) |>
  knitr::kable(
    digits = 1,
    caption = "Typical-value Cmax (mg/L) and AUC0-24 (mg*h/L) against the Table 4 simulated medians of Rao 2021."
)| Drug | Dose (mg) | Table 4 Cmax | Typical single-dose Cmax | Table 4 AUC0-24 | Typical single-dose AUC0-24 | Typical steady-state AUC0-24 | Cmax % diff (single dose) | AUC % diff (single dose) | AUC % diff (steady state) |
|---|---|---|---|---|---|---|---|---|---|
| pyrazinamide | 1000 | 25.7 | 26.5 | 303.8 | 324.5 | 384.6 | 3.2 | 6.8 | 26.6 |
| pyrazinamide | 1500 | 38.0 | 39.8 | 466.0 | 486.8 | 576.9 | 4.7 | 4.5 | 23.8 |
| pyrazinamide | 2000 | 50.4 | 53.0 | 624.7 | 649.1 | 769.2 | 5.2 | 3.9 | 23.1 |
| pyrazinamide | 2500 | 63.1 | 66.3 | 778.5 | 811.3 | 961.5 | 5.0 | 4.2 | 23.5 |
| pyrazinamide | 3000 | 75.8 | 79.5 | 933.0 | 973.6 | 1153.8 | 4.9 | 4.4 | 23.7 |
| ethambutol | 800 | 1.6 | 1.5 | 13.0 | 14.9 | 15.5 | -5.0 | 14.8 | 19.3 |
| ethambutol | 1200 | 2.4 | 2.3 | 19.5 | 22.4 | 23.3 | -5.0 | 14.8 | 19.3 |
| ethambutol | 1600 | 3.2 | 3.0 | 26.0 | 29.9 | 31.0 | -5.0 | 14.8 | 19.3 |
| ethambutol | 2000 | 3.9 | 3.8 | 32.5 | 37.3 | 38.8 | -2.6 | 14.8 | 19.3 |
| ethambutol | 2400 | 4.7 | 4.6 | 39.0 | 44.8 | 46.5 | -3.0 | 14.8 | 19.3 |
pza <- typical[typical$drug == "pyrazinamide", ]
emb <- typical[typical$drug == "ethambutol", ]
stopifnot(
  # Pyrazinamide: single dose reproduces both Table 4 medians at every dose
  # (realised 3-7%). A mis-transcribed ka, V or CL moves these by tens of
  # percent or more.
  all(abs(pza$pct_cmax_sd) < 10),
  all(abs(pza$pct_auc_sd) < 10),
  # ...and steady state does not (realised +23% to +27%), which is what
  # identifies Table 4 as single-dose simulations.
  all(pza$pct_auc_ss > 15),
  # Ethambutol: Cmax within 10% (realised -3% to -5%). The AUC0-24 medians
  # run about 15% below the typical value at every dose; see Assumptions.
  all(abs(emb$pct_cmax_sd) < 10),
  all(abs(emb$pct_auc_sd) < 20)
)
These are deterministic solves with no random draw, so the bounds above are tight on purpose.
Replicate Figures 6 and 8
sim_nca <- sim |>
  dplyr::filter(!is.na(Cc)) |>
  dplyr::mutate(group = paste(drug, treatment)) |>
  dplyr::select(id, time, Cc, drug, treatment, group)

sim_nca <- dplyr::bind_rows(
  sim_nca,
  sim_nca |>
    dplyr::distinct(id, drug, treatment, group) |>
    dplyr::mutate(time = 0, Cc = 0)
) |>
  dplyr::distinct(id, group, time, .keep_all = TRUE) |>
  dplyr::arrange(group, id, time)

dose_df <- bind_rows(events) |>
  dplyr::filter(evid == 1) |>
  dplyr::mutate(group = paste(drug, treatment)) |>
  dplyr::select(id, time, amt, drug, treatment, group)

conc_obj <- PKNCA::PKNCAconc(
  sim_nca, Cc ~ time | group + id,
  concu = "mg/L", timeu = "h"
)
dose_obj <- PKNCA::PKNCAdose(
  dose_df, amt ~ time | group + id,
  doseu = "mg"
)
intervals <- data.frame(start = 0, end = 24, cmax = TRUE, tmax = TRUE, auclast = TRUE)
nca_res <- PKNCA::pk.nca(PKNCA::PKNCAdata(conc_obj, dose_obj, intervals = intervals))

per_subject <- as.data.frame(nca_res$result) |>
  dplyr::filter(PPTESTCD %in% c("cmax", "auclast")) |>
  dplyr::select(group, id, PPTESTCD, PPORRES) |>
  tidyr::pivot_wider(names_from = PPTESTCD, values_from = PPORRES) |>
  dplyr::left_join(
    dplyr::distinct(dose_df, group, drug, treatment, amt),
    by = "group"
  )
# Replicates Figures 6 (pyrazinamide) and 8 (ethambutol) of Rao 2021:
# simulated Cmax and AUC0-24 by single oral dose, with the Table 4 targets.
targets <- tibble::tribble(
  ~drug, ~metric, ~target,
  "pyrazinamide", "Cmax (mg/L)", 20,
  "pyrazinamide", "AUC0-24 (mg*h/L)", 363,
  "ethambutol", "Cmax (mg/L)", 2
)

per_subject |>
  tidyr::pivot_longer(c(cmax, auclast), names_to = "metric", values_to = "value") |>
  dplyr::mutate(
    metric = ifelse(metric == "cmax", "Cmax (mg/L)", "AUC0-24 (mg*h/L)"),
    dose = factor(amt)
  ) |>
  ggplot(aes(dose, value)) +
  geom_boxplot(outlier.size = 0.6) +
  geom_hline(data = targets, aes(yintercept = target), linetype = "dashed") +
  facet_wrap(drug ~ metric, scales = "free", ncol = 2) +
  labs(
    x = "Single oral dose (mg)", y = NULL,
    caption = "Replicates Figures 6 and 8 of Rao 2021; dashed lines are the Table 4 targets."
  ) +
  theme_bw()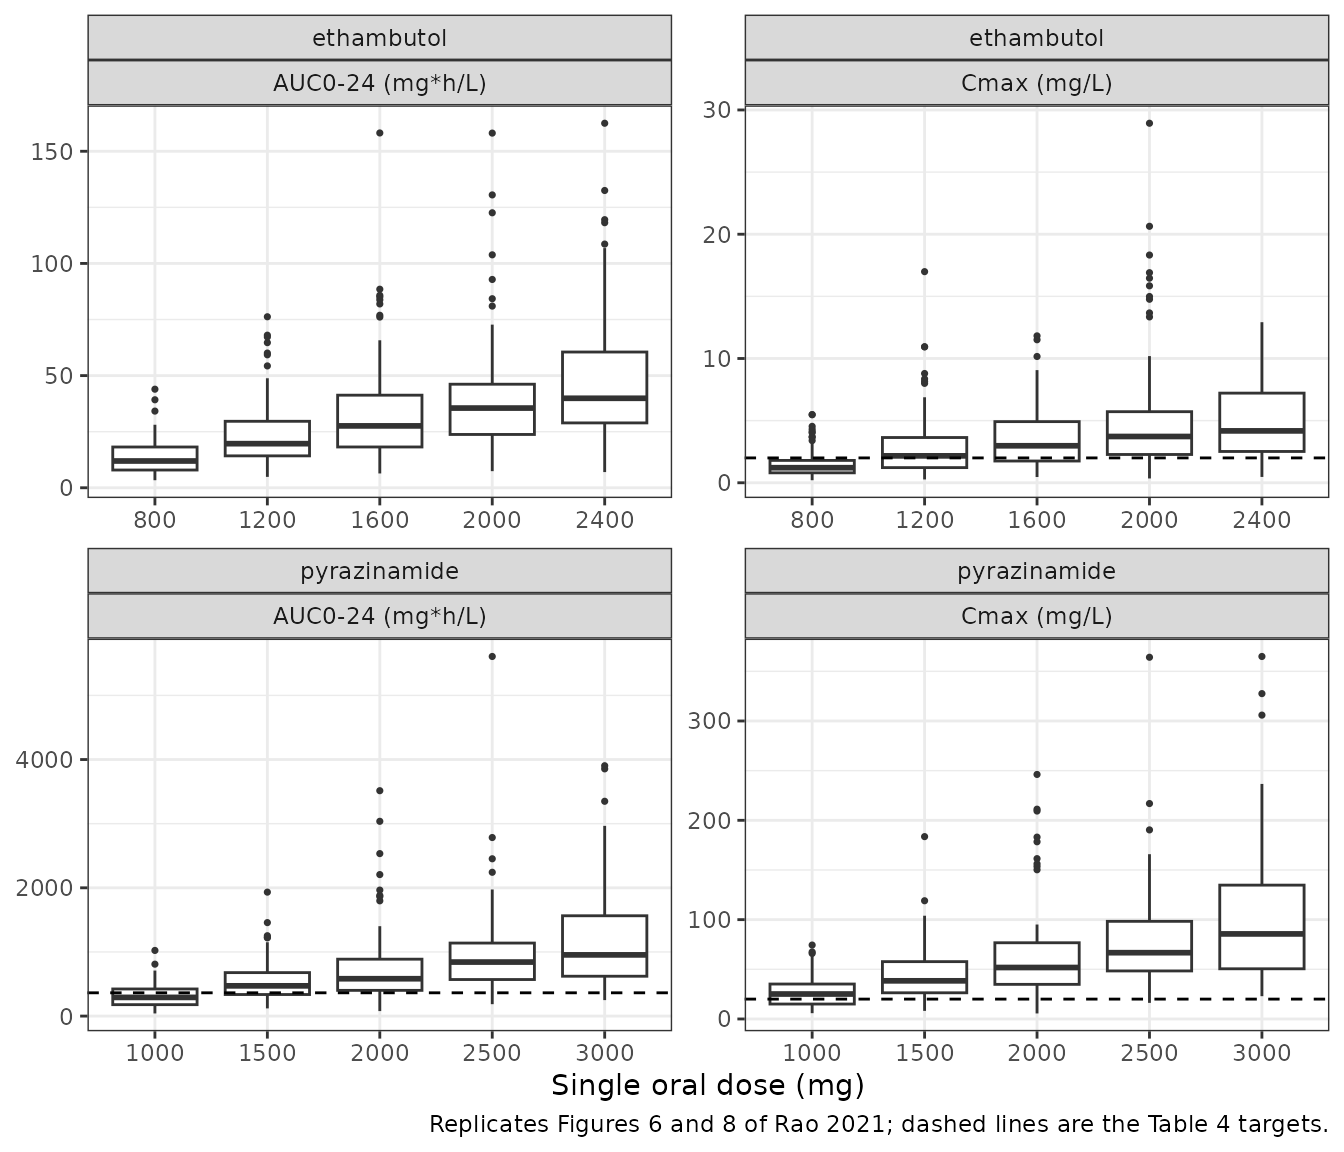
PKNCA comparison against Table 4
reference <- published_t4 |>
  dplyr::mutate(group = paste(drug, paste(dose, "mg"))) |>
  dplyr::select(group, cmax, auclast = auc24)

cmp <- nlmixr2lib::ncaComparisonTable(
  simulated = nca_res,
  reference = reference,
  by = "group",
  params = c("cmax", "auclast"),
  units = c(cmax = "mg/L", auclast = "mg*h/L"),
  tolerance_pct = 20
)
knitr::kable(
  cmp,
  caption = "Simulated (single dose, 100 subjects per dose) vs. Rao 2021 Table 4 medians. * differs from the reference by >20%."
)| NCA parameter | group | Reference | Simulated | % diff |
|---|---|---|---|---|
| Cmax (mg/L) | pyrazinamide 1000 mg | 25.7 | 25.1 | -2.2% |
| Cmax (mg/L) | pyrazinamide 1500 mg | 38 | 38.4 | +1.1% |
| Cmax (mg/L) | pyrazinamide 2000 mg | 50.4 | 51.8 | +2.8% |
| Cmax (mg/L) | pyrazinamide 2500 mg | 63.1 | 66.7 | +5.7% |
| Cmax (mg/L) | pyrazinamide 3000 mg | 75.8 | 85.6 | +13.0% |
| Cmax (mg/L) | ethambutol 800 mg | 1.6 | 1.21 | -24.3%* |
| Cmax (mg/L) | ethambutol 1200 mg | 2.4 | 2.17 | -9.8% |
| Cmax (mg/L) | ethambutol 1600 mg | 3.2 | 2.98 | -7.0% |
| Cmax (mg/L) | ethambutol 2000 mg | 3.9 | 3.72 | -4.5% |
| Cmax (mg/L) | ethambutol 2400 mg | 4.7 | 4.17 | -11.2% |
| AUClast (mg*h/L) | pyrazinamide 1000 mg | 304 | 291 | -4.1% |
| AUClast (mg*h/L) | pyrazinamide 1500 mg | 466 | 472 | +1.2% |
| AUClast (mg*h/L) | pyrazinamide 2000 mg | 625 | 582 | -6.8% |
| AUClast (mg*h/L) | pyrazinamide 2500 mg | 778 | 842 | +8.2% |
| AUClast (mg*h/L) | pyrazinamide 3000 mg | 933 | 954 | +2.3% |
| AUClast (mg*h/L) | ethambutol 800 mg | 13 | 11.9 | -8.2% |
| AUClast (mg*h/L) | ethambutol 1200 mg | 19.5 | 19.7 | +0.8% |
| AUClast (mg*h/L) | ethambutol 1600 mg | 26 | 27.6 | +6.1% |
| AUClast (mg*h/L) | ethambutol 2000 mg | 32.5 | 35.5 | +9.3% |
| AUClast (mg*h/L) | ethambutol 2400 mg | 39 | 39.9 | +2.3% |
chk <- per_subject |>
  dplyr::group_by(drug, amt) |>
  dplyr::summarise(cmax = median(cmax), auclast = median(auclast), .groups = "drop") |>
  dplyr::inner_join(published_t4, by = c("drug", "amt" = "dose")) |>
  dplyr::mutate(
    pct_cmax = 100 * (cmax.x - cmax.y) / cmax.y,
    pct_auc = 100 * (auclast - auc24) / auc24
  )
stopifnot(
  # Centre, not extremes: the cohort median across the five doses. A wrong
  # dose, unit or clearance moves every dose level together.
  abs(median(chk$pct_cmax[chk$drug == "pyrazinamide"])) < 15,
  abs(median(chk$pct_auc[chk$drug == "pyrazinamide"])) < 15,
  # Ethambutol Cmax: the expected offset is about -9% (a 2000-subject run
  # gave a median of 1.45 against 1.6 mg/L at 800 mg), so the bound leaves
  # room for cohort noise while still failing on a mis-transcribed V or ka.
  abs(median(chk$pct_cmax[chk$drug == "ethambutol"])) < 20,
  abs(median(chk$pct_auc[chk$drug == "ethambutol"])) < 25
)
For pyrazinamide, the simulated medians fall within about 15% of Table 4 at every dose. For ethambutol, the AUC0-24 medians agree within about 10%. The Cmax medians run 5-25% low, and the gap is widest at 800 mg, where Table 4 rounds to one decimal place. The ka variance of 0.6 is wide, and it pulls the median Cmax below the typical-value Cmax: a subject with slow absorption has a lower peak, while a subject with fast absorption gains comparatively little.
Target attainment
per_subject |>
  dplyr::inner_join(published_t4, by = c("drug", "amt" = "dose")) |>
  dplyr::group_by(drug, amt) |>
  dplyr::summarise(
    sim_cmax = 100 * mean(cmax.x >= cmax_target),
    pub_cmax = dplyr::first(pct_cmax),
    sim_auc = if (all(is.na(auc_target))) NA_real_ else 100 * mean(auclast >= auc_target),
    pub_auc = dplyr::first(pct_auc),
    .groups = "drop"
  ) |>
  dplyr::rename(
    "Drug" = drug,
    "Dose (mg)" = amt,
    "Simulated % Cmax >= target" = sim_cmax,
    "Table 4 % Cmax >= target" = pub_cmax,
    "Simulated % AUC0-24 >= target" = sim_auc,
    "Table 4 % AUC0-24 >= target" = pub_auc
  ) |>
  knitr::kable(
    digits = 1,
    caption = "Percentage attaining the Table 4 targets (pyrazinamide Cmax 20 mg/L and AUC0-24 363 mg*h/L; ethambutol Cmax 2 mg/L)."
)| Drug | Dose (mg) | Simulated % Cmax >= target | Table 4 % Cmax >= target | Simulated % AUC0-24 >= target | Table 4 % AUC0-24 >= target |
|---|---|---|---|---|---|
| ethambutol | 800 | 20 | 32.6 | NA | NA |
| ethambutol | 1200 | 54 | 63.2 | NA | NA |
| ethambutol | 1600 | 71 | 89.8 | NA | NA |
| ethambutol | 2000 | 81 | 93.8 | NA | NA |
| ethambutol | 2400 | 84 | 93.8 | NA | NA |
| pyrazinamide | 1000 | 63 | 69.4 | 34 | 42.9 |
| pyrazinamide | 1500 | 90 | 89.8 | 69 | 71.4 |
| pyrazinamide | 2000 | 92 | 91.8 | 82 | 85.1 |
| pyrazinamide | 2500 | 96 | 96.0 | 90 | 89.6 |
| pyrazinamide | 3000 | 100 | 98.0 | 91 | 91.7 |
This table is descriptive. The Table 4 percentages come from the 49 patients’ own (shrunken) parameter estimates, so their spread is narrower than a simulation from the full between-subject variances. For pyrazinamide the simulated attainment is close to Table 4 at every dose. For ethambutol it is lower, because the simulated median Cmax sits below Table 4 (see above) and the wider spread puts more subjects under the 2 mg/L target.
Scale of the IIV column
Table 3 heads the variability column ‘IIV (Shrinkage)’ without saying whether the number is a variance or a standard deviation. Phoenix NLME reports the Omega diagonal as variances, and Table 4 supports that reading. The paper’s simulations use individual estimates, which shrinkage pulls toward the typical value, so the spread in Table 4 can be no wider than a simulation from the true between-subject variances. Its AUC0-24 interquartile ratio (Q3/Q1) is 2.01 for pyrazinamide at 1000 mg and 1.86 for ethambutol at 800 mg. Under the standard-deviation reading, a full-variability simulation gives a spread narrower than the shrunken one Table 4 shows, which is impossible. Under the variance reading it gives a wider one, as it should.
iqr_ratio <- function(x) unname(quantile(x, 0.75) / quantile(x, 0.25))
per_subject |>
  dplyr::filter(amt %in% c(1000, 800)) |>
  dplyr::group_by(drug, amt) |>
  dplyr::summarise(sim_iqr_ratio = iqr_ratio(auclast), .groups = "drop") |>
  dplyr::mutate(table4_iqr_ratio = ifelse(drug == "pyrazinamide", 466.1 / 231.6, 18.6 / 10)) |>
  dplyr::rename(
    "Drug" = drug,
    "Dose (mg)" = amt,
    "Simulated AUC0-24 Q3/Q1 (variance reading)" = sim_iqr_ratio,
    "Table 4 AUC0-24 Q3/Q1" = table4_iqr_ratio
  ) |>
knitr::kable(digits = 2)| Drug | Dose (mg) | Simulated AUC0-24 Q3/Q1 (variance reading) | Table 4 AUC0-24 Q3/Q1 |
|---|---|---|---|
| ethambutol | 800 | 2.30 | 1.86 |
| pyrazinamide | 1000 | 2.37 | 2.01 |
When the maintainers repeated this with a large cohort under the standard-deviation reading, it gave AUC0-24 Q3/Q1 ratios of about 1.7 (pyrazinamide) and 1.5 (ethambutol). Both are below the Table 4 values, so that reading was rejected.
Steady state against the observed NCA
Results 2.3 and 2.4 report observed non-compartmental values at the two-week visit. For pyrazinamide these are a median Cmax of 34 mg/L and AUC0-24 of 351 mgh/L at 25.4 mg/kg; for ethambutol, a Cmax of 1.8 mg/L and AUC0-24 of 14.3 mgh/L at 18.4 mg/kg. For a 52.5 kg patient those doses are about 1334 mg and 966 mg.
bind_rows(
  typical_profile("pyrazinamide", 25.4 * 52.5, steady_state = TRUE) |>
    mutate(drug = "pyrazinamide", obs_cmax = 34, obs_auc = 351),
  typical_profile("ethambutol", 18.4 * 52.5, steady_state = TRUE) |>
    mutate(drug = "ethambutol", obs_cmax = 1.8, obs_auc = 14.3)
) |>
  dplyr::select(drug, obs_cmax, cmax, obs_auc, auc24) |>
  dplyr::rename(
    "Drug" = drug,
    "Observed NCA Cmax" = obs_cmax,
    "Typical steady-state Cmax" = cmax,
    "Observed NCA AUC0-24" = obs_auc,
    "Typical steady-state AUC0-24" = auc24
  ) |>
  knitr::kable(digits = 1, caption = "Typical steady-state values at the median mg/kg dose for a 52.5 kg patient.")
#> ℹ parameter labels from comments will be replaced by 'label()'
#> ℹ omega/sigma items treated as zero: 'etalka', 'etalvc', 'etalcl', 'etaltlag'
#> ℹ parameter labels from comments will be replaced by 'label()'
#> ℹ omega/sigma items treated as zero: 'etalka', 'etalvc', 'etalcl', 'etaltlag'| Drug | Observed NCA Cmax | Typical steady-state Cmax | Observed NCA AUC0-24 | Typical steady-state AUC0-24 |
|---|---|---|---|---|
| pyrazinamide | 34.0 | 41.7 | 351.0 | 512.9 |
| ethambutol | 1.8 | 1.9 | 14.3 | 18.7 |
This comparison is not a validation gate. The observed AUC0-24 values were extrapolated to 24 h from four samples between 1 and 6 h post-dose, and only in patients whose 6-h sample lay in the elimination phase (Methods 4.4). For pyrazinamide, the terminal phase is absorption-limited (half-life about ln 2 / 0.08 = 8.7 h), and a 6-h window captures little of it. The model’s steady-state pyrazinamide AUC0-24 is therefore well above the observed NCA value. For ethambutol the steady-state Cmax agrees with the observed median, and the AUC0-24 is about 30% higher. The paper’s own Table 4 simulations also sit below steady state, because they are single-dose.
Assumptions and deviations
- Rifampin and isoniazid are not packaged. The weight coefficient on rifampin clearance and the MUAC coefficient on isoniazid central volume are not reported, and the printed isoniazid clearance does not reproduce Table 4. See Rifampin and isoniazid.
-
Residual error magnitude. Results 2.3 and 2.4 name
an additive residual error for both drugs but give no value, and the
paper has no supplement.
addSdisfixed(0), so simulations carry between-subject variability only. - IIV scale. The Table 3 ‘IIV (Shrinkage)’ entries are read as Phoenix NLME Omega variances of exponential random effects, with the parenthesised number taken as the shrinkage fraction. See Scale of the IIV column.
- Pyrazinamide ka IIV. Table 3 prints ‘0.1-0.11’ in the IIV (Shrinkage) column, while every other row reads ‘value (shrinkage)’. It is read as a variance of 0.1 with shrinkage 0.11.
- Pyrazinamide V/F of 1.5 L. This is far below the roughly 40-50 L usually reported for pyrazinamide. With ka = 0.08 1/h, well below CL/V = 1.7 1/h, the fitted model is flip-flop: its terminal slope is set by ka, and it reproduces the paper’s own Table 4 medians. It is kept as published and not reinterpreted.
- Ethambutol AUC0-24. The typical-value AUC0-24 is about 15% above the Table 4 median at every dose, while Cmax agrees within 5%. The Table 4 medians summarise 49 individual clearance estimates with 30% shrinkage, and their median need not equal the typical value. The parameters were not adjusted.
- Dosing. Table 4 is reproduced with single oral doses, the reading the typical-value comparison supports. The paper does not state it.
-
Covariates screened but not retained. Age, sex,
weight, MUAC and TB diagnostic group (Methods 4.4) are recorded in
covariatesDataExcluded. - No erratum or correction notice for this article was found on the publisher page or Europe PMC as of 2026-09-28.