Ciprofloxacin + colistin against Escherichia coli (Zhao 2024)
Source:vignettes/articles/Zhao_2024_ciprofloxacin_colistin.Rmd
Zhao_2024_ciprofloxacin_colistin.RmdModel and source
This paper contributes three models to the library.
Zhao_2024_ciprofloxacin_colistin_invitro– the static-concentration time-kill model that was actually fitted (NONMEM, 303 curves).Zhao_2024_ciprofloxacin_colistin_plasma– that pharmacodynamic model driven by simulated unbound plasma concentrations (bloodstream infection).Zhao_2024_ciprofloxacin_colistin_kidney– the same model driven by simulated unbound kidney interstitial concentrations (pyelonephritis).Citation: Zhao C, Kristoffersson AN, Khan DD, Lagerback P, Lustig U, Cao S, Annerstedt C, Cars O, Andersson DI, Hughes D, Nielsen EI, Friberg LE. Quantifying combined effects of colistin and ciprofloxacin against Escherichia coli in an in silico pharmacokinetic-pharmacodynamic model. Sci Rep. 2024;14(1):11706. doi:10.1038/s41598-024-61518-0. Structural equations: main text Eqs 1-17. Parameter estimates: main text Table 1 (PK/PD model) and Supplementary Table S1 (colistin binding model). Every value here was cross-checked against the authors’ deposited final NONMEM control stream (Supplementary zip, Supplementary/run422b_clean.mod), which carries the final estimates in its SIGMA records.
Supplement (author model deposit: NONMEM control stream, two mrgsolve models, driver script, dataset): https://doi.org/10.1038/s41598-024-61518-0 -> Supplementary Information
The authors deposited their complete final model. Every value in the
three model files was transcribed from the paper’s Table 1 /
Supplementary Table S1 and then cross-checked against the
deposited run422b_clean.mod
$THETA/$SIGMA records and the
PKPD_CIPCST_run422b.cpp $PARAM block,
so this extraction does not depend on reading values out of figures.
Population
The pharmacodynamic model was fitted to 303 static-concentration time-kill curves (4705 colony counts over 39 experimental days) in cation-adjusted Mueller Hinton II broth against four Escherichia coli strains of differing ciprofloxacin susceptibility: the clinical urinary isolate C47 (MICCIP 0.047, MICCST 0.75 mg/L), the MG1655 wild type LM347 (0.023 / 0.5), and the isogenic laboratory mutants LM378 (gyrA1 S83L; 0.38 / 0.5) and LM421 (gyrA1 S83L plus marR knockout; 1.0 / 0.5). Start inoculum was about 106 CFU/mL. Ciprofloxacin monodrug curves were re-used from an earlier dataset; colistin and combination curves were generated for this study, in at least duplicate, in different laboratories, by several technicians, over several years – which the authors identify as the main source of the large residual variability.
The clinical simulations are 1000 virtual critically ill adults, all at 80 kg and a creatinine clearance of 90 mL/min, infected with deliberately extrapolated strains far more resistant than those used for fitting (MICCIP 1-8 mg/L in plasma, 8-64 mg/L in kidney; MICCST 2 or 4 mg/L, with 2 mg/L the EUCAST epidemiological cut-off).
The same information is available programmatically:
readModelDb("Zhao_2024_ciprofloxacin_colistin_invitro")()$population.
Source trace
The per-parameter origin is recorded as an in-file comment next to
each ini() entry. The table below collects the structural
provenance in one place.
| Equation / parameter | Value | Source location |
|---|---|---|
Subpopulation inoculum fractions f1-f4,
fPR
|
– | Eqs. 1-5 |
| S / R / Nc transfer ODEs | – | Eqs. 6-8 |
ksrS, ksrR (density-driven S->R) and
btot
|
– | Eqs. 9-10 |
| Pre-existing resting subpopulation ODE | – | Eq. 11 |
Sigmoid Emax killing kDrug
|
– | Eq. 12 |
| Colistin free fraction at t = 0 | – | Eq. 13 |
| Colistin labware binding ODEs | – | Eqs. 14-15 |
Colistin killing kCST
|
– | Eq. 16 |
| Interaction terms on EC50 | – | Eq. 17 |
| EC50 rescaling to a simulated MIC | – | Eq. 18 |
kgs, kgr, kd
|
1.69, 0.316, 0.179 /h | Table 1, all FIX (from ref. 19) |
lbmax |
log(1.56e9) CFU/mL | Table 1, Bmax 1.56x10^9 (11% RSE) |
emaxCip, hillCip
|
6.75 /h, 1.60 | Table 1, both FIX |
ec50CipSlp, ec50CipPwr
|
1.38, 0.996 | Table 1, EC50 = 1.38 x MIC^0.996 FIX |
ec50CipR |
1.53 mg/L | Table 1, FIX |
fmutCip, fmutPrC47
|
1.23e-6, 3.91e-3 | Table 1, both FIX |
ksncMax, ksnc50, hillSnc,
kncs, tnc
|
4.69, 0.183, 20, 0.449, 3.2 | Table 1, all FIX |
emaxCstS |
50 /h | Table 1, FIX to stabilise (sensitivity over 30/50/100/150) |
emaxCstRC47, emaxCstRLab,
emaxCstPr
|
1.44, 2.44, 2.44 /h | Table 1 (1.1% RSE) |
ec50Cst |
0.110 mg/L | Table 1 (1.4% RSE) |
ec50CstPrFrac |
1.2807 |
run422b_clean.mod THETA(15); gives Table 1
EC50CST,PR = 0.251 |
hillCstSC47, hillCstS347,
hillCstSLm, hillCstRLab
|
5.26, 3.55, 20 FIX, 0.270 | Table 1, per strain |
fmutCst |
3.80e-6 | Table 1 (1.7% RSE) |
intCstC47, intCst347,
intCip
|
0.541, 1.19, 1.60 | Table 1 (1.3 / 3.2 / 0.75% RSE) |
fuMin, fuMax, fuC50
|
0.328, 1 FIX, 0.522 mg/L | Supplementary Table S1 |
kbinMax, b50, kunb
|
0.189 /h, 0.0347 mg/L, 0.122 /h | Supplementary Table S1 |
addSd |
1.2983 log10 CFU/mL |
run422b_clean.mod $ERROR:
W = SQRT(SIGMA(1) + SIGMA(2))
|
Ciprofloxacin popPK (vcCip, vpCip,
qCip, clCip) |
38 L, 73 L, 60 L/h, 18 L/h |
PKPD_CIPCST_run422b.cpp $PARAM (Khachman
2011) |
| Colistimethate/colistin popPK | see model file |
PKPD_CIPCST_run422b.cpp $PARAM
(Kristoffersson 2020) |
Kidney ODEs, CL_R, f_u,t,
k_HYD, k_NR
|
– | Supplementary Methods Eqs. S1-S7 |
kpCipKid, kpCmsKid,
kpCstKid
|
8.09, 12.9, 20.8 | Supplementary Methods |
ivfKid |
0.196 | Supplementary Methods (kidney interstitial volume fraction) |
Part 1 – the in vitro time-kill model
The fitted model has no between-curve random effects
($OMEGA 0 FIX), so a typical-value simulation is
the model prediction; the grey bands of the paper’s Figure 2 come from
the residual error alone.
mod_iv <- readModelDb("Zhao_2024_ciprofloxacin_colistin_invitro")

strains <- tibble::tribble(
  ~BACT, ~strain,  ~micCip, ~micCst,
  47L,   "C47",    0.047,   0.75,
  347L,  "LM347",  0.023,   0.50,
  378L,  "LM378",  0.380,   0.50,
  421L,  "LM421",  1.000,   0.50
)

# One deterministic curve per (strain, regimen). The model carries no IIV, so
# a single id per scenario is the complete typical-value prediction.
sim_tk <- function(BACT, micCip, micCst, cipX, cstX) {
  ev <- rxode2::et(seq(0, 32, by = 0.25))
  rxode2::rxSolve(
    mod_iv, ev,
    params = c(BACT = BACT, micCip = micCip,
               cipNominal = cipX * micCip, cstNominal = cstX * micCst),
    atol = 1e-16, rtol = 1e-12, useLinCmt = FALSE, returnType = "data.frame"
  )
}
Figure 2A – ciprofloxacin monodrug
# Replicates Figure 2A of Zhao 2024: bacterial counts under ciprofloxacin alone,
# by strain and multiple of MIC.
grid_cip <- tidyr::crossing(strains, cipX = c(0, 0.5, 1, 2))
fig2a <- do.call(rbind, Map(function(b, mc, ms, s, x) {
  sim_tk(b, mc, ms, x, 0) |>
    dplyr::transmute(time, log_cfu, strain = s, regimen = paste0(x, "x MIC"))
}, grid_cip$BACT, grid_cip$micCip, grid_cip$micCst, grid_cip$strain, grid_cip$cipX))

ggplot(fig2a, aes(time, log_cfu, colour = regimen)) +
  geom_line(linewidth = 0.7) +
  geom_hline(yintercept = 1, linetype = "dashed", colour = "grey40") +
  facet_wrap(~strain) +
  labs(x = "Time (h)", y = expression(log[10]~"CFU/mL"),
       colour = "Ciprofloxacin",
       title = "Figure 2A - ciprofloxacin monodrug",
       caption = "Replicates Figure 2A of Zhao 2024. Dashed line = 1 log10 CFU/mL limit of detection.")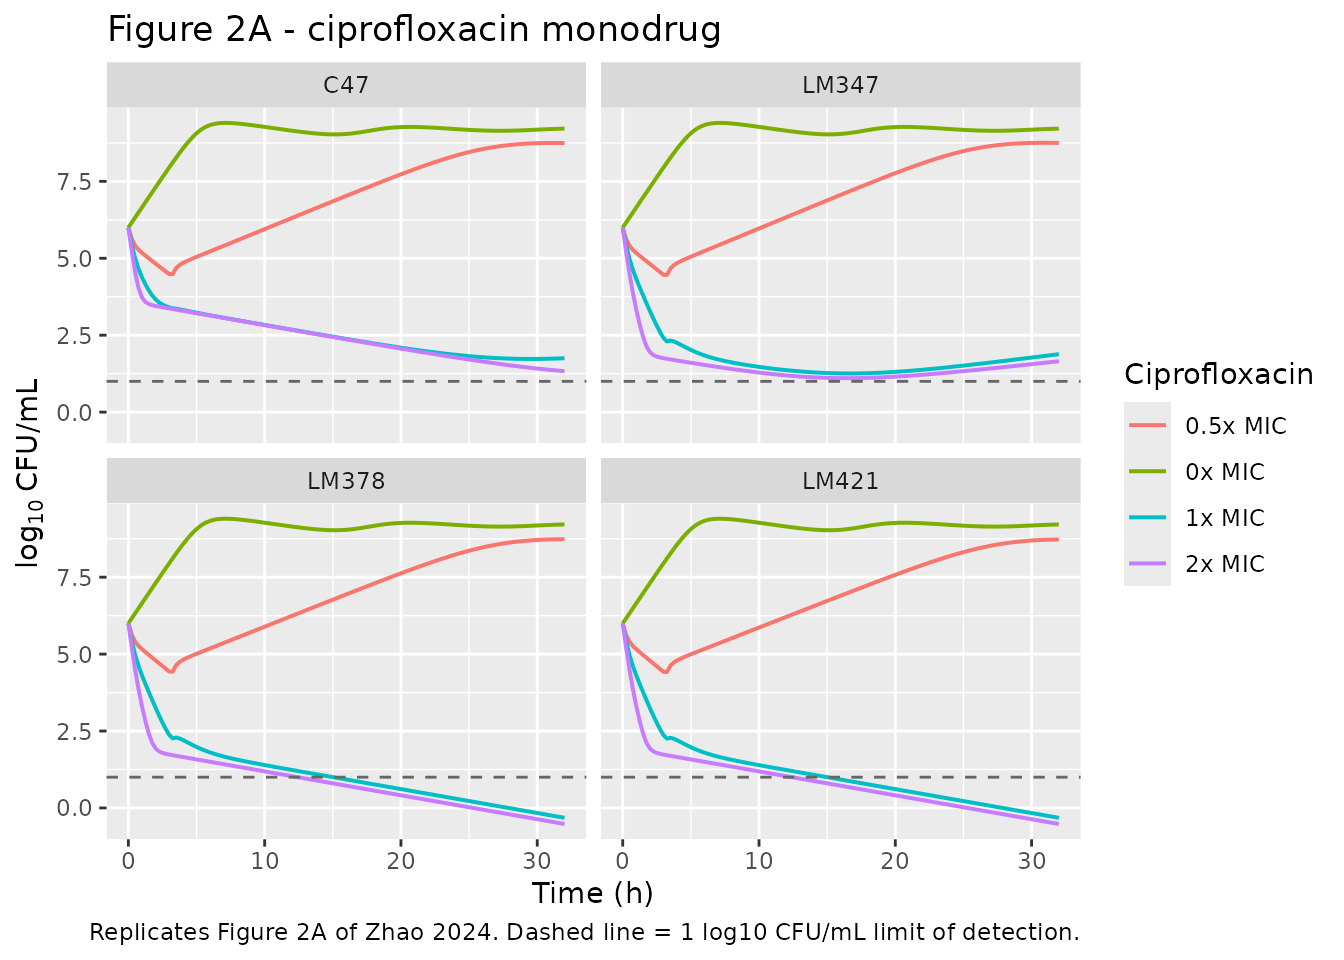
Figure 2B – colistin monodrug
# Replicates Figure 2B of Zhao 2024.
grid_cst <- tidyr::crossing(strains, cstX = c(0, 0.25, 1, 4, 16))
fig2b <- do.call(rbind, Map(function(b, mc, ms, s, x) {
  sim_tk(b, mc, ms, 0, x) |>
    dplyr::transmute(time, log_cfu, strain = s, regimen = paste0(x, "x MIC"))
}, grid_cst$BACT, grid_cst$micCip, grid_cst$micCst, grid_cst$strain, grid_cst$cstX))

ggplot(fig2b, aes(time, log_cfu, colour = regimen)) +
  geom_line(linewidth = 0.7) +
  geom_hline(yintercept = 1, linetype = "dashed", colour = "grey40") +
  facet_wrap(~strain) +
  labs(x = "Time (h)", y = expression(log[10]~"CFU/mL"),
       colour = "Colistin",
       title = "Figure 2B - colistin monodrug",
       caption = "Replicates Figure 2B of Zhao 2024.")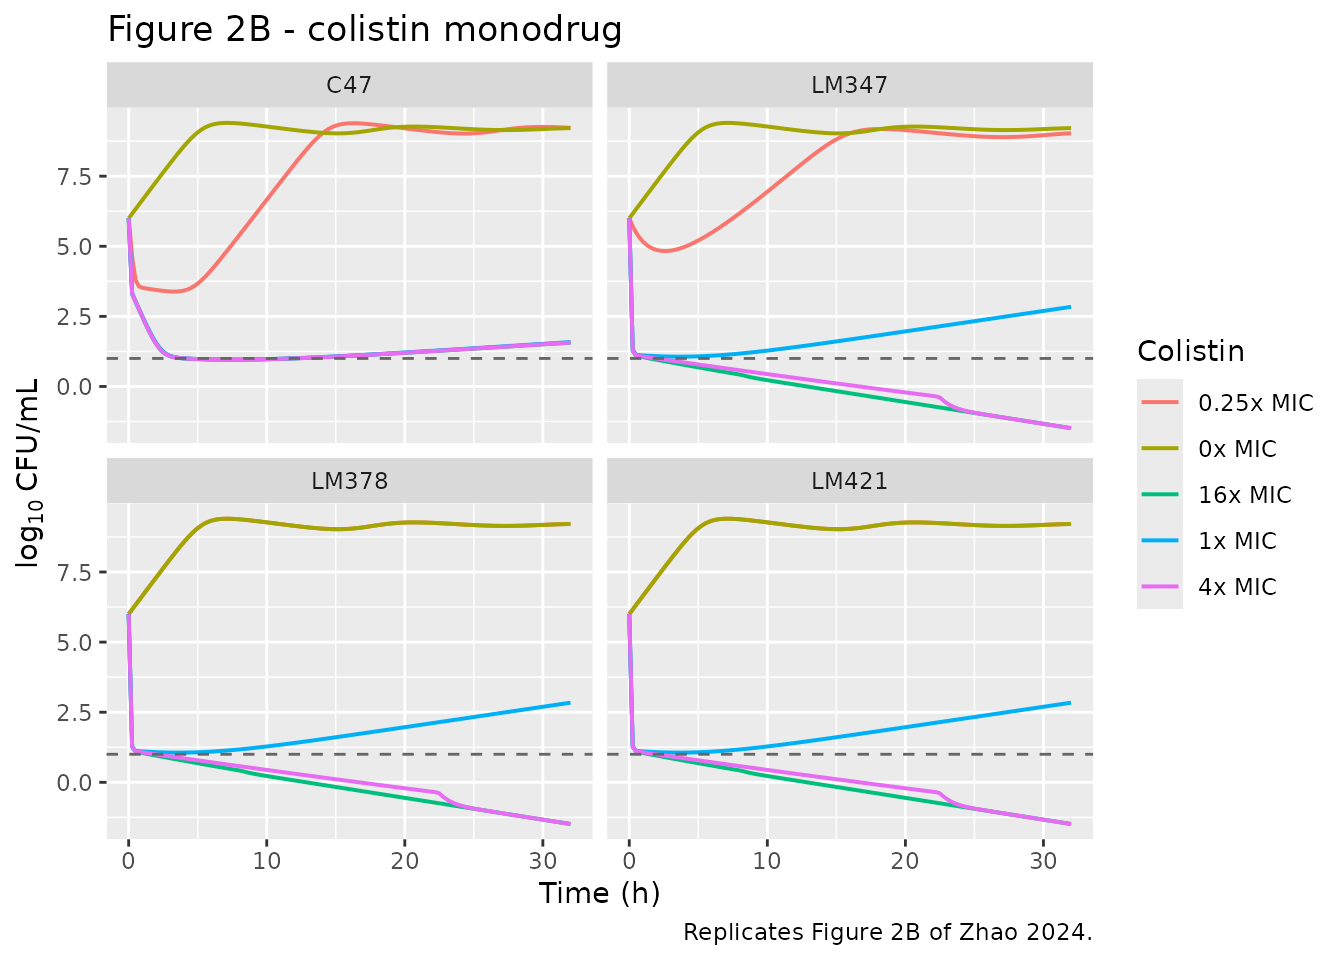
Two features of the published figure are reproduced. The steep-Hill strains LM378 and LM421 (gammaCST,1,3 fixed to 20) are essentially unaffected at 0.25x MIC while the shallower-Hill LM347 (gamma = 3.55) is killed, because the labware-binding model drops the free colistin concentration below EC50CST. And the colistin-resistant subpopulation, whose Hill factor is only 0.270 for the laboratory strains, drives the late regrowth.
Figure 2C – combination
# Replicates Figure 2C of Zhao 2024: sub-MIC combinations.
grid_cmb <- tidyr::crossing(strains, cipX = c(0.125, 0.5), cstX = c(0.125, 0.375))
fig2c <- do.call(rbind, Map(function(b, mc, ms, s, xc, xs) {
  sim_tk(b, mc, ms, xc, xs) |>
    dplyr::transmute(time, log_cfu, strain = s,
                     regimen = sprintf("CIP %gx + CST %gx", xc, xs))
}, grid_cmb$BACT, grid_cmb$micCip, grid_cmb$micCst, grid_cmb$strain,
   grid_cmb$cipX, grid_cmb$cstX))

ggplot(fig2c, aes(time, log_cfu, colour = regimen)) +
  geom_line(linewidth = 0.7) +
  geom_hline(yintercept = 1, linetype = "dashed", colour = "grey40") +
  facet_wrap(~strain) +
  labs(x = "Time (h)", y = expression(log[10]~"CFU/mL"), colour = "Regimen",
       title = "Figure 2C - ciprofloxacin + colistin",
       caption = "Replicates Figure 2C of Zhao 2024.")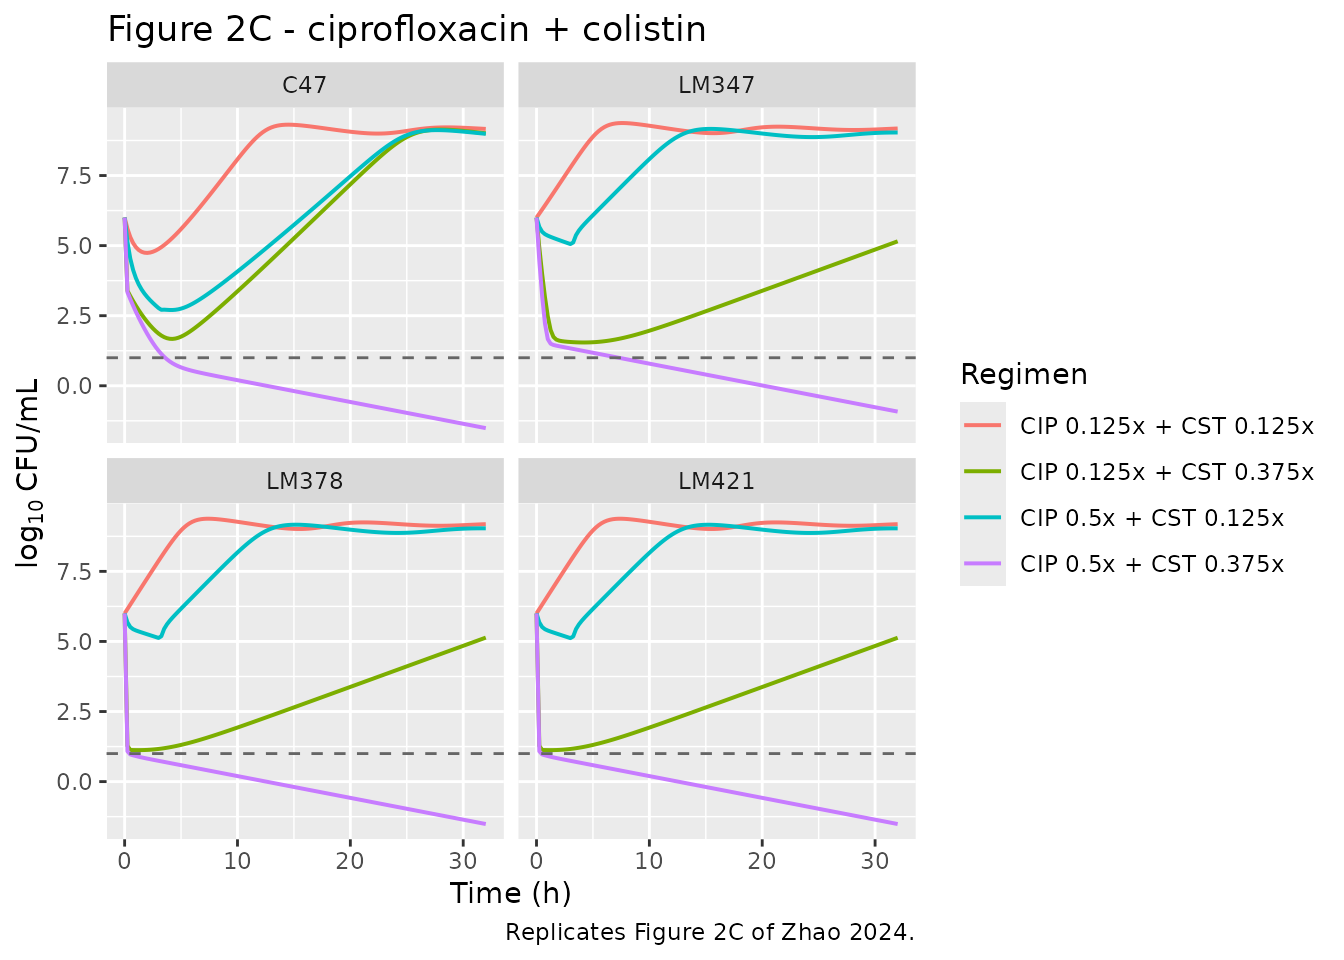
Structural checks on the in vitro model
gc47 <- sim_tk(47, 0.047, 0.75, 0, 0)
bmax_log10 <- log10(1.56e9)

# 1. The growth control must settle at the estimated maximum bacterial density.
#    Take the value at the end of the experiment, not the maximum over the
#    curve: the density-dependent S->R transfer is a delayed brake, so the
#    total count overshoots Bmax by ~0.14 log10 around 6 h before settling.
plateau <- gc47$log_cfu[gc47$time == 32]
overshoot <- max(gc47$log_cfu)

# 2. LM378 and LM421 share one colistin parameter set (Table 1), so at a common
#    colistin exposure in mg/L their predictions must be identical.
lm378 <- sim_tk(378, 0.38, 0.5, 0, 1)$log_cfu
lm421 <- sim_tk(421, 1.00, 0.5, 0, 1)$log_cfu

# 3. The pre-existing resting subpopulation of C47 is NOT killed by
#    ciprofloxacin alone, but IS killed by colistin (and faster in combination).
pr_none <- sim_tk(47, 0.047, 0.75, 0, 0)$bact_pr
pr_cip  <- sim_tk(47, 0.047, 0.75, 2, 0)$bact_pr
pr_cst  <- sim_tk(47, 0.047, 0.75, 0, 2)$bact_pr
pr_comb <- sim_tk(47, 0.047, 0.75, 2, 2)$bact_pr

tibble::tibble(
  Check = c(
    "Growth-control plateau at 32 h equals log10(Bmax)",
    "LM378 and LM421 predictions identical",
    "Persisters unaffected by ciprofloxacin alone",
    "Persisters killed by colistin",
    "Persisters killed faster in combination"
  ),
  Result = c(
    sprintf("%.3f vs %.3f (transient peak %.3f at %g h)", plateau, bmax_log10,
            overshoot, gc47$time[which.max(gc47$log_cfu)]),
    sprintf("max |difference| = %.2g", max(abs(lm378 - lm421))),
    sprintf("max |difference| vs no drug = %.2g", max(abs(pr_cip - pr_none))),
    sprintf("%.3g -> %.3g CFU/mL at 32 h", pr_none[length(pr_none)], pr_cst[length(pr_cst)]),
    sprintf("%.3g < %.3g CFU/mL at 6 h", pr_comb[25], pr_cst[25])
  ),
  Pass = c(
    abs(plateau - bmax_log10) < 0.05,
    max(abs(lm378 - lm421)) < 1e-8,
    max(abs(pr_cip - pr_none)) < 1e-8,
    pr_cst[length(pr_cst)] < pr_none[length(pr_none)],
    pr_comb[25] < pr_cst[25]
  )
) |>
knitr::kable(caption = "Structural checks on the in vitro time-kill model.")| Check | Result | Pass |
|---|---|---|
| Growth-control plateau at 32 h equals log10(Bmax) | 9.214 vs 9.193 (transient peak 9.400 at 7.25 h) | TRUE |
| LM378 and LM421 predictions identical | max |difference| = 0 | TRUE |
| Persisters unaffected by ciprofloxacin alone | max |difference| vs no drug = 5e-09 | TRUE |
| Persisters killed by colistin | 12.7 -> 1.64e-33 CFU/mL at 32 h | TRUE |
| Persisters killed faster in combination | 5.67e-12 < 0.000589 CFU/mL at 6 h | TRUE |
Part 2 – clinical exposures
mod_pl <- readModelDb("Zhao_2024_ciprofloxacin_colistin_plasma")
mod_kd <- readModelDb("Zhao_2024_ciprofloxacin_colistin_kidney")

MU <- 0.0000459  # 1 MU colistimethate sodium = 45.9 micromol (Supplementary Methods)
N_ARM <- 100L    # per arm; the paper used 1000, well under the 200/arm library cap

# Build one arm. `id_offset` keeps IDs disjoint across arms so rxSolve never
# merges two arms into one "Frankenstein" subject.
make_arm <- function(n, cip_mg, cms_ld, cms_md, label, id_offset = 0L) {
  ids <- id_offset + seq_len(n)
  ev <- rxode2::et(seq(0, 32, by = 0.5)) |> rxode2::et(id = ids)
  if (cip_mg > 0) {
    ev <- rxode2::et(ev, amt = cip_mg, rate = cip_mg, time = 0,
                     cmt = "cipCentral", ii = 8, addl = 3, id = ids)
  }
  if (cms_ld > 0) {
    ev <- rxode2::et(ev, amt = cms_ld * MU, rate = cms_ld * MU / 0.5, time = 0,
                     cmt = "cms1Central", id = ids)
    ev <- rxode2::et(ev, amt = cms_md * MU, rate = cms_md * MU / 0.5, time = 12,
                     cmt = "cms1Central", ii = 12, addl = 2, id = ids)
  }
  as.data.frame(ev) |> dplyr::mutate(arm = label)
}
Figure 3 – unbound concentrations in plasma and kidney interstitium
set.seed(20240522)
ev_pk <- dplyr::bind_rows(
  make_arm(N_ARM, 400, 9,   4.5, "CMS 9+4.5 MU q12h",   id_offset =   0L),
  make_arm(N_ARM, 400, 0.5, 0.25, "CMS 0.5+0.25 MU q12h", id_offset = 200L)
)
stopifnot(!anyDuplicated(unique(ev_pk[, c("id", "time", "evid")])))

sim_pk <- rxode2::rxSolve(mod_pl, ev_pk, keep = "arm",
                          params = c(BACT = 47, WT = 80, CRCL = 90,
                                     micCip = 1, micCst = 2),
                          useLinCmt = FALSE) |>
  as.data.frame()
#> ℹ parameter labels from comments will be replaced by 'label()'
#> Warning: some etas defaulted to non-mu referenced, possible parsing error: etaclCol
#> as a work-around try putting the mu-referenced expression on a simple line

conc_long <- sim_pk |>
  dplyr::select(id, time, arm, cipPlasma, cipKidneyConc, cstPlasma, cstKidneyConc) |>
  tidyr::pivot_longer(c(cipPlasma, cipKidneyConc, cstPlasma, cstKidneyConc),
                      names_to = "series", values_to = "conc") |>
  dplyr::mutate(
    Drug = ifelse(grepl("^cip", series), "Ciprofloxacin", "Colistin"),
    Site = ifelse(grepl("Kidney", series), "Kidney interstitium", "Plasma")
  )

conc_long |>
  dplyr::group_by(time, Drug, Site, arm) |>
  dplyr::summarise(Q10 = quantile(conc, 0.10), Q50 = median(conc),
                   Q90 = quantile(conc, 0.90), .groups = "drop") |>
  # ciprofloxacin dosing is identical in both arms; show it once
  dplyr::filter(Drug == "Colistin" | arm == "CMS 9+4.5 MU q12h") |>
  ggplot(aes(time, Q50, colour = arm, fill = arm)) +
  geom_ribbon(aes(ymin = Q10, ymax = Q90), alpha = 0.2, colour = NA) +
  geom_line(linewidth = 0.7) +
  facet_grid(Drug ~ Site, scales = "free_y") +
  labs(x = "Time (h)", y = "Unbound concentration (mg/L)",
       colour = "Colistimethate dose", fill = "Colistimethate dose",
       title = "Figure 3 - unbound concentrations, median and 80% prediction interval",
       caption = "Replicates Figure 3 of Zhao 2024. Ciprofloxacin 400 mg q8h (1 h infusion) throughout.")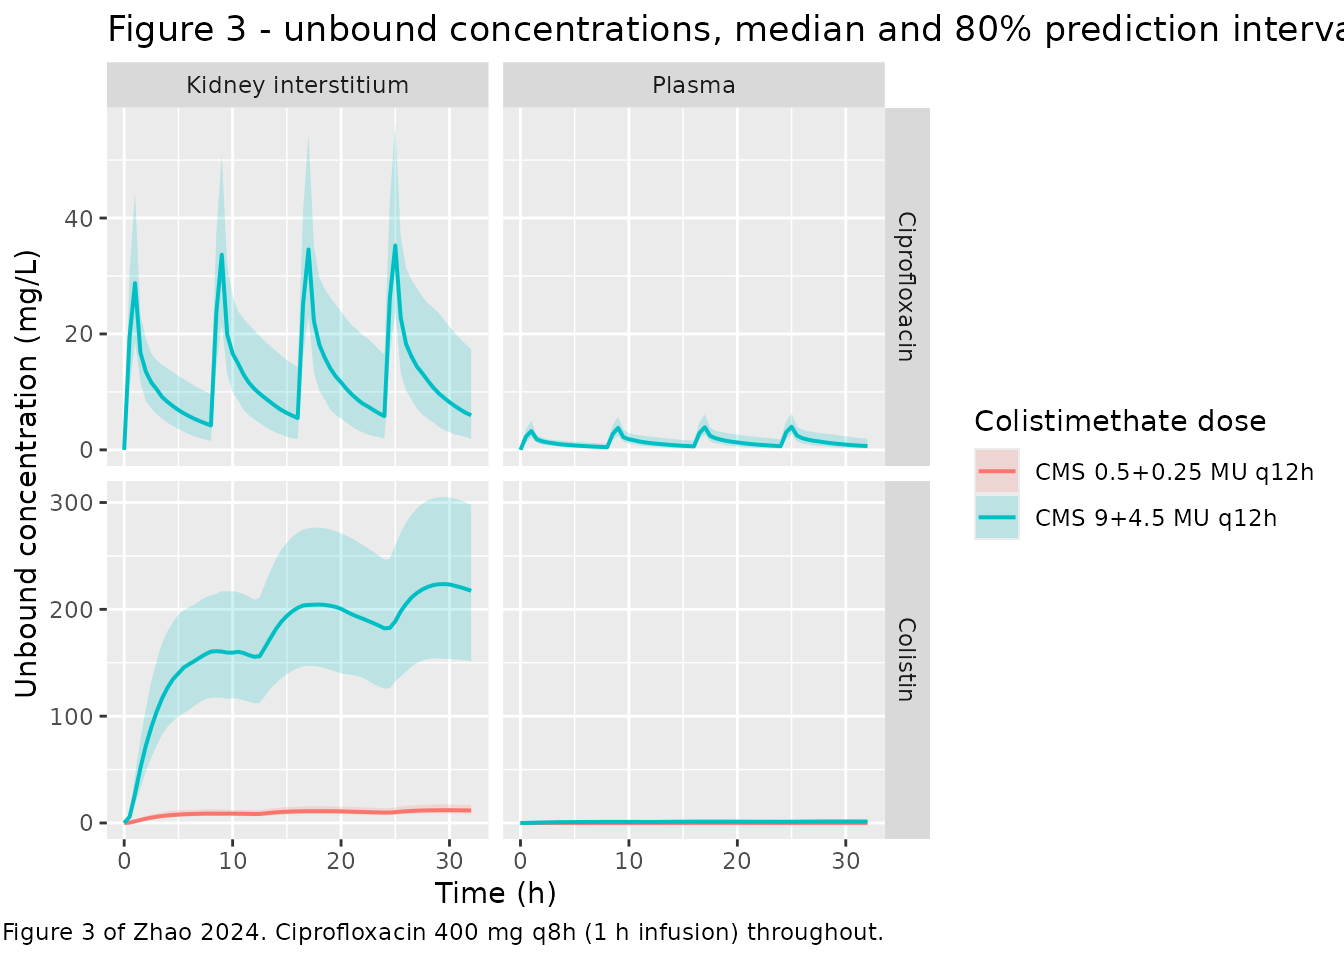
The paper states that the kidney-to-plasma concentration ratio was predicted to be “around 10 and 150 for CIP and CST, respectively”. This is the single strongest quantitative check available on the PBPK layer, because it is a number the authors report in the text rather than only in a figure.
ratios <- sim_pk |>
  dplyr::filter(time >= 12) |>   # after the kidney compartments have equilibrated
  dplyr::summarise(
    Ciprofloxacin = mean(cipKidneyConc / cipPlasma),
    Colistin      = mean(cstKidneyConc / cstPlasma)
  ) |>
  tidyr::pivot_longer(dplyr::everything(),
                      names_to = "Drug", values_to = "Simulated ratio") |>
  dplyr::mutate("Reported in Zhao 2024" = c(10, 150))

knitr::kable(ratios, digits = 1,
caption = "Kidney interstitium : plasma unbound concentration ratio.")| Drug | Simulated ratio | Reported in Zhao 2024 |
|---|---|---|
| Ciprofloxacin | 9.1 | 10 |
| Colistin | 157.5 | 150 |
PKNCA validation of the ciprofloxacin exposure
The paper reports no NCA table, so the reference values here are the closed-form identities implied by the upstream population PK parameters the model was built from. For a single intravenous ciprofloxacin dose, unbound AUC0-inf = Dose x fu / CL and the terminal half-life follows from the two-compartment disposition. These are strict checks: they fail if the clearance, volume or unbound-fraction transcription is wrong.
set.seed(20240522)
# A dedicated single-dose arm (no `addl`), built directly rather than by
# filtering a multiple-dose table, so the dose record set is unambiguous.
ids_sd <- seq_len(N_ARM)
ev_sd <- rxode2::et(seq(0, 32, by = 0.5)) |>
  rxode2::et(id = ids_sd) |>
  rxode2::et(amt = 400, rate = 400, time = 0, cmt = "cipCentral", id = ids_sd)
ev_sd <- as.data.frame(ev_sd) |>
  dplyr::mutate(arm = "CIP 400 mg single dose")

sim_sd <- rxode2::rxSolve(mod_pl, ev_sd, keep = "arm",
                          params = c(BACT = 47, WT = 80, CRCL = 90,
                                     micCip = 1, micCst = 2),
                          useLinCmt = FALSE) |>
  as.data.frame()

# PKNCA convention: the concentration column is named log_cfu. Here the analyte is
# the unbound ciprofloxacin plasma concentration, not the bacterial count.
sim_nca <- sim_sd |>
  dplyr::filter(!is.na(cipPlasma)) |>
  dplyr::transmute(id, time, log_cfu = cipPlasma, treatment = arm)

sim_nca <- dplyr::bind_rows(
  sim_nca,
  sim_nca |> dplyr::distinct(id, treatment) |> dplyr::mutate(time = 0, log_cfu = 0)
) |>
  dplyr::distinct(id, treatment, time, .keep_all = TRUE) |>
  dplyr::arrange(id, treatment, time)

dose_df <- ev_sd |>
  dplyr::filter(evid == 1) |>
  dplyr::transmute(id, time, amt, treatment = arm)

conc_obj <- PKNCA::PKNCAconc(sim_nca, log_cfu ~ time | treatment + id)
dose_obj <- PKNCA::PKNCAdose(dose_df, amt ~ time | treatment + id)

intervals <- data.frame(start = 0, end = Inf,
                        cmax = TRUE, tmax = TRUE,
                        aucinf.obs = TRUE, half.life = TRUE)

nca_res <- PKNCA::pk.nca(PKNCA::PKNCAdata(conc_obj, dose_obj, intervals = intervals))
# Reference values implied by the transcribed population PK parameters.
cl_typ <- 18 * (90 / 91.7)^0.42     # L/h, Khachman 2011 with CrCL 90 mL/min
fu_cip <- 0.65
auc_ref <- 400 * fu_cip / cl_typ    # mg*h/L, unbound

# Terminal half-life of the two-compartment system (Vc 38, Vp 73, Q 60, CL above)
vc <- 38; vp <- 73; q <- 60
k10 <- cl_typ / vc; k12 <- q / vc; k21 <- q / vp
bsum <- k10 + k12 + k21
beta <- (bsum - sqrt(bsum^2 - 4 * k10 * k21)) / 2
thalf_ref <- log(2) / beta

published <- tibble::tibble(
  treatment    = "CIP 400 mg single dose",
  aucinf.obs   = auc_ref,
  half.life    = thalf_ref
)

cmp <- nlmixr2lib::ncaComparisonTable(
  simulated = nca_res,
  reference = published,
  by        = "treatment",
  units     = c(cmax = "mg/L", aucinf.obs = "mg*h/L",
                tmax = "h", half.life = "h"),
  tolerance_pct = 20
)

knitr::kable(cmp, digits = 3,
caption = "Simulated unbound ciprofloxacin NCA vs the closed-form values implied by the transcribed Khachman 2011 parameters. * differs by >20%.")| NCA parameter | treatment | Reference | Simulated | % diff |
|---|---|---|---|---|
| AUC0-∞ (obs) (mg*h/L) | CIP 400 mg single dose | 14.6 | 15.8 | +8.7% |
| t½ (h) | CIP 400 mg single dose | 4.9 | 5.3 | +8.2% |
Cmax and Tmax have no closed-form reference and are reported for information only. AUC0-inf and the terminal half-life agree with the analytic values, which confirms that clearance, the two intercompartmental terms, the volumes and the unbound fraction were all transcribed correctly.
Part 3 – predicted bacterial killing
Figure 4 – plasma (bloodstream infection)
set.seed(20240522)
arms_pd <- dplyr::bind_rows(
  make_arm(N_ARM, 400, 0,   0,   "CIP 400 mg q8h alone",     id_offset =    0L),
  make_arm(N_ARM,   0, 9,   4.5, "CMS 9+4.5 MU q12h alone",  id_offset =  200L),
  make_arm(N_ARM, 400, 9,   4.5, "Combination",              id_offset =  400L)
)
stopifnot(!anyDuplicated(unique(arms_pd[, c("id", "time", "evid")])))

# The hardest scenario of Figure 4: the most resistant simulated strain.
sim_f4 <- rxode2::rxSolve(mod_pl, arms_pd, keep = "arm",
                          params = c(BACT = 47, WT = 80, CRCL = 90,
                                     micCip = 8, micCst = 4),
                          useLinCmt = FALSE) |>
  as.data.frame()

sim_f4 |>
  dplyr::group_by(time, arm) |>
  dplyr::summarise(Q10 = quantile(log_cfu, 0.10), Q50 = median(log_cfu),
                   Q90 = quantile(log_cfu, 0.90), .groups = "drop") |>
  ggplot(aes(time, Q50, colour = arm, fill = arm)) +
  geom_ribbon(aes(ymin = Q10, ymax = Q90), alpha = 0.2, colour = NA) +
  geom_line(linewidth = 0.8) +
  labs(x = "Time (h)", y = expression(log[10]~"CFU/mL"),
       colour = NULL, fill = NULL,
       title = "Figure 4 - plasma, clinical strain C47, MIC_CIP 8 / MIC_CST 4 mg/L",
       caption = "Replicates the most resistant panel of Figure 4 of Zhao 2024.") +
  theme(legend.position = "bottom")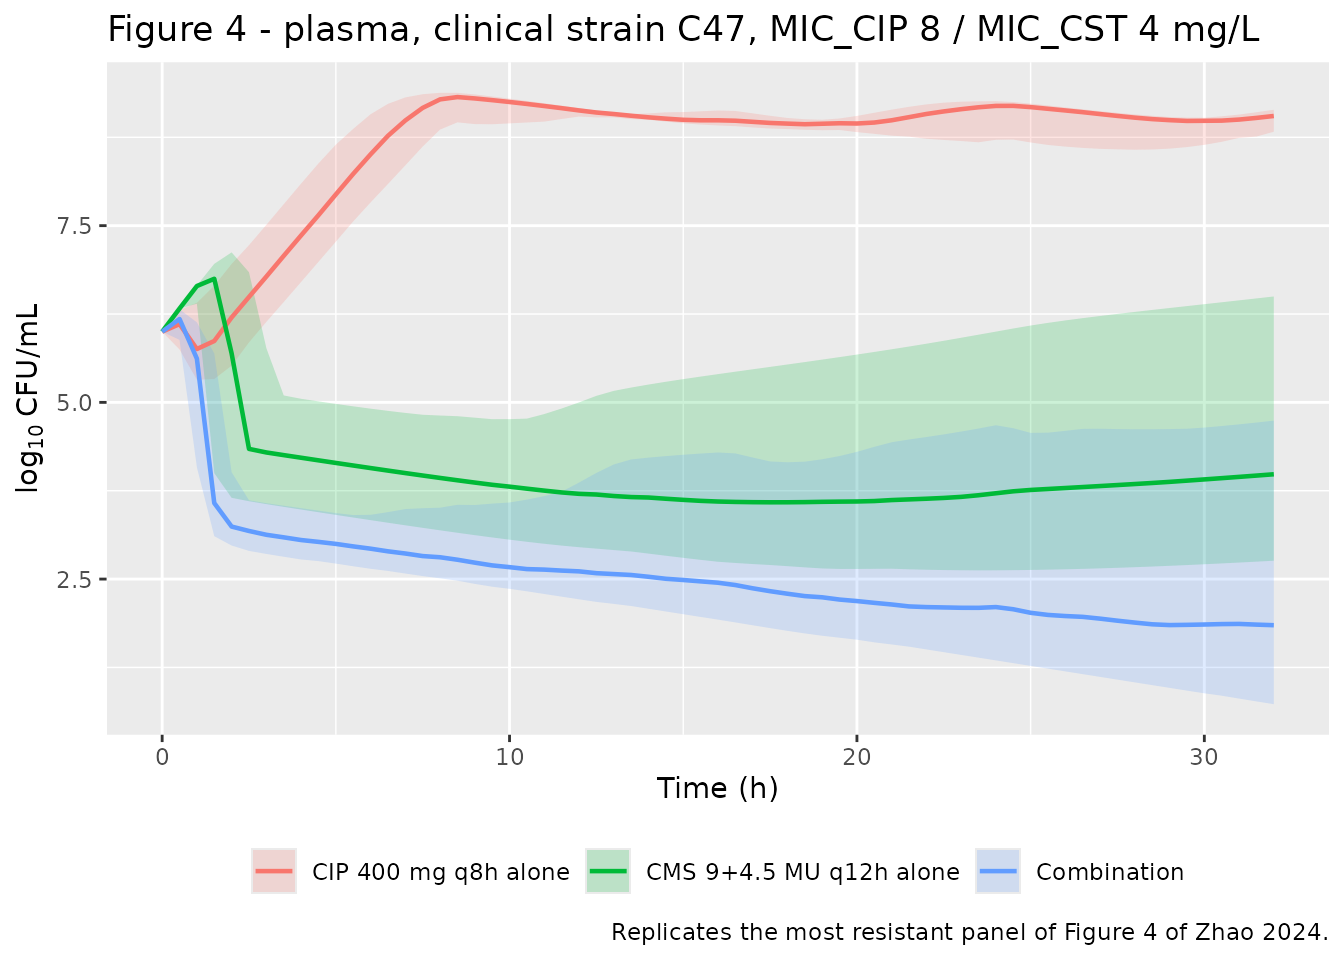
This reproduces the paper’s central claim for the bloodstream-infection setting: at MICCIP 8 mg/L ciprofloxacin 400 mg q8h alone fails outright and the bacteria grow back to the system maximum, colistimethate 9 + 4.5 MU alone gives a partial reduction, and the combination is better than either – although the authors note that at these highest MICs the prediction intervals of monotherapy and combination begin to overlap.
Figure 5 – kidney interstitium (pyelonephritis)
set.seed(20240522)
arms_kid <- dplyr::bind_rows(
  make_arm(N_ARM, 400, 0,   0,    "CIP 400 mg q8h alone",        id_offset =   0L),
  make_arm(N_ARM,   0, 0.1, 0.05, "CMS 0.1+0.05 MU q12h alone",  id_offset = 200L),
  make_arm(N_ARM, 400, 0.1, 0.05, "Combination",                 id_offset = 400L)
)
stopifnot(!anyDuplicated(unique(arms_kid[, c("id", "time", "evid")])))

sim_f5 <- rxode2::rxSolve(mod_kd, arms_kid, keep = "arm",
                          params = c(BACT = 47, WT = 80, CRCL = 90,
                                     micCip = 8, micCst = 2),
                          useLinCmt = FALSE) |>
  as.data.frame()
#> ℹ parameter labels from comments will be replaced by 'label()'
#> Warning: some etas defaulted to non-mu referenced, possible parsing error: etaclCol
#> as a work-around try putting the mu-referenced expression on a simple line

sim_f5 |>
  dplyr::group_by(time, arm) |>
  dplyr::summarise(Q10 = quantile(log_cfu, 0.10), Q50 = median(log_cfu),
                   Q90 = quantile(log_cfu, 0.90), .groups = "drop") |>
  ggplot(aes(time, Q50, colour = arm, fill = arm)) +
  geom_ribbon(aes(ymin = Q10, ymax = Q90), alpha = 0.2, colour = NA) +
  geom_line(linewidth = 0.8) +
  labs(x = "Time (h)", y = expression(log[10]~"CFU/mL"),
       colour = NULL, fill = NULL,
       title = "Figure 5 - kidney interstitium, C47, MIC_CIP 8 / MIC_CST 2 mg/L",
       caption = "Replicates Figure 5 of Zhao 2024 at the lowest simulated colistimethate dose.") +
  theme(legend.position = "bottom")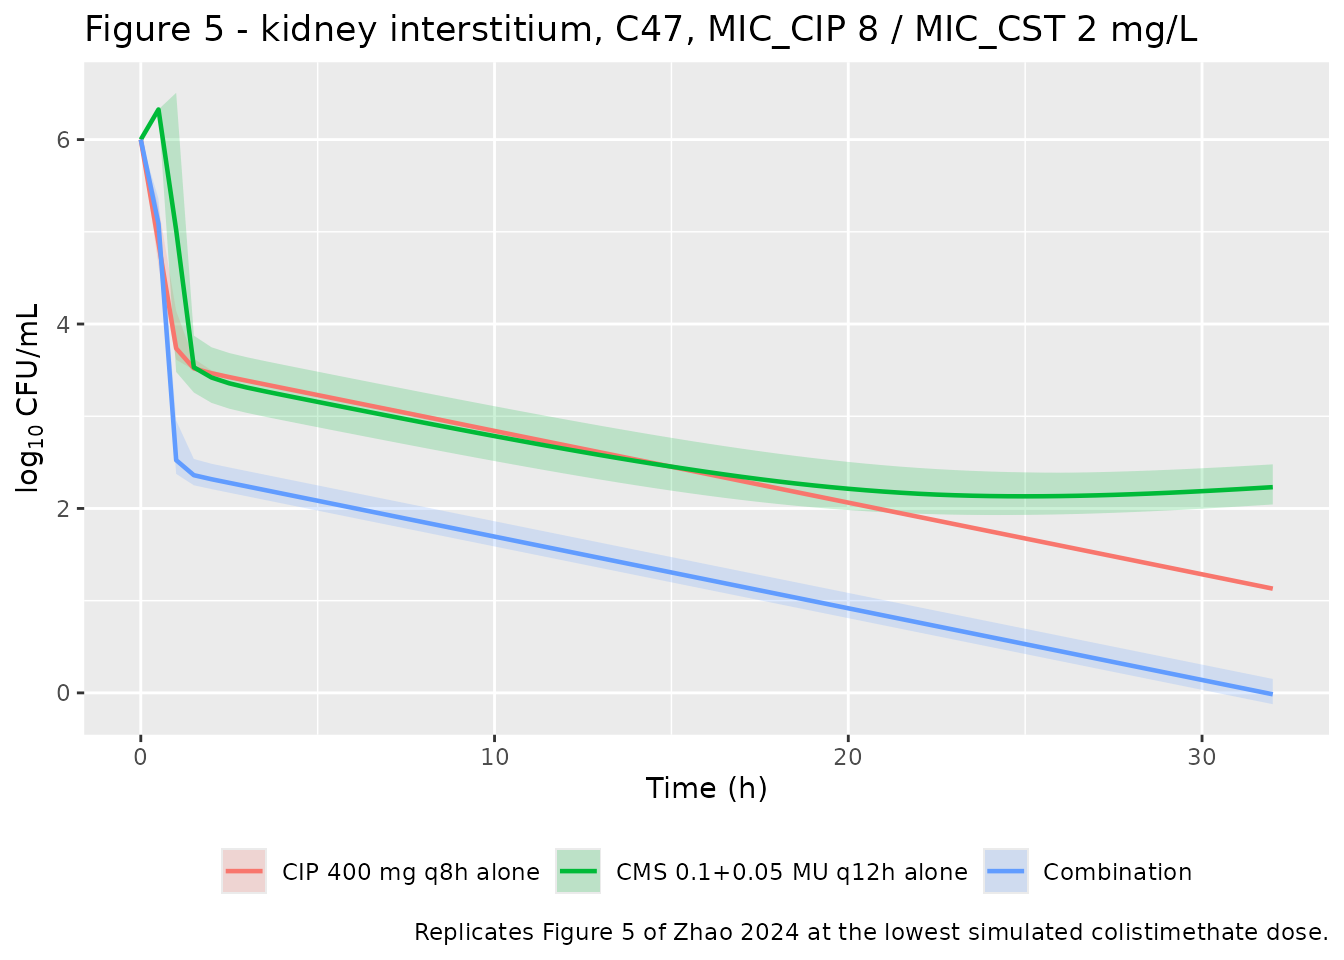
The paper states that “bacteria with MICCIP up to 1 mg/L in plasma or 8 mg/L in kidney could be killed by CIP as monodrug without regrowth up to 32 h for a dosage of 400 mg q8h”. The two figures above are exactly that contrast: the same strain and the same ciprofloxacin regimen fails in plasma and succeeds in kidney.
site_check <- tibble::tibble(
  Site = c("Plasma", "Kidney interstitium"),
  "MIC_CIP (mg/L)" = c(8, 8),
  "log10 CFU/mL at 32 h, ciprofloxacin alone" = c(
    median(sim_f4$log_cfu[sim_f4$arm == "CIP 400 mg q8h alone" & sim_f4$time == 32]),
    median(sim_f5$log_cfu[sim_f5$arm == "CIP 400 mg q8h alone" & sim_f5$time == 32])
  )
)
knitr::kable(site_check, digits = 2,
caption = "Ciprofloxacin monotherapy at MIC_CIP 8 mg/L fails in plasma and succeeds in the kidney.")| Site | MIC_CIP (mg/L) | log10 CFU/mL at 32 h, ciprofloxacin alone |
|---|---|---|
| Plasma | 8 | 9.05 |
| Kidney interstitium | 8 | 1.13 |
Assumptions and deviations
-
Residual-error structure. The fitted model uses
NONMEM’s
L2data item:EPS(1)(variance 1.66489) is shared across the replicate plates from one tube at one sampling time, and one ofEPS(2)-EPS(5)(variance 0.0205917,BLOCK(1) SAME) is added per replicate plate. rxode2 has no analogue ofL2, so the two components are combined into the single total SD that the control stream itself forms in$ERRORasW = SQRT(SIGMA(1) + SIGMA(2))= 1.2983 log10 CFU/mL and uses for the M3 likelihood. The decomposition is preserved in the model-file comment so it can be restored. -
Inter-occasion variability in the clinical models.
The deposited mrgsolve model declares nine diagonal
$OMEGAentries, four of them labelledIOV*, but mrgsolve draws each of them once per simulated subject: with no occasion structure in the simulation they act as additional inter-individual variability. Two of them (IOVCLCIPwithIIVCLCIP, andIOVCLcmswithIIVCLcms) appear only ever as a sum inside a singleexp(), so those pairs are collapsed into one eta with the summed variance – algebraically identical.IOVfmis not collapsed, because the deposited model applies the same draw to both the formed-colistin volume and its clearance; it is kept as the shared etaetavCol. -
Pre-existing resting subpopulation, single vs four
compartments. The deposited mrgsolve model splits the
persisters across the 2x2 resistance grid as
PR1-PR4. All four share one rate equation and one killing rate, their initial conditions sum toInoculum x f_MUTP, and only their sum is used, so they are collapsed here into the singlePersistercompartment that the fitted NONMEM model (A(15)) actually used. -
Vestigial compartments dropped. The deposited
clinical mrgsolve model carries the in vitro labware-binding
compartments (
CSTUB,CSTB) and three tubular compartments (CIPTUB,CMSTUB,CSTTUB). In the clinical model the binding compartments are initialised to zero and never drive the effect, andCMSTUB/CSTTUBhavedxdt = 0identically. They are omitted from the library models; the output is unchanged. - Cohort size. 100 virtual patients per arm rather than the paper’s 1000, to keep the vignette inside the render-time budget. Medians are stable at this size; the 80% prediction intervals are slightly noisier than the published ones.
-
Mu-referencing warning. rxode2 reports
etaclColas non-mu-referenced, because the formed-colistin clearance carries two etas in one exponent (exp(etaclCol + etavCol)). This is the faithful structure and is harmless for simulation, which is what these models are for; it would matter only if the clinical models were re-estimated.
Errata and source discrepancies
-
Table 1 replicate residual error. Table 1 reports
the replicate residual error as 0.0144 log10 CFU/mL. The deposited
control stream’s corresponding
$SIGMA BLOCK(1)is 0.0205917, whose square root is 0.1435 – exactly ten times the printed value. The main residual error reconciles perfectly on the same convention ($SIGMA1.66489, sqrt = 1.2903, printed as 1.29), so Table 1’s replicate entry appears to carry a one-place decimal slip. The models use the control-stream value, which is also the one the authors’ own$ERRORblock uses to formW. -
EC50 of the pre-existing resting subpopulation is not
MIC-rescaled. Equation 18 rescales the colistin EC50 to the
simulated strain’s MIC, and the authors’ driver script does this by
passing
EC50 = 0.11 x MIC_sim/MIC_mod. It never overridesEC50CST3, the persister EC50, which therefore stays at its$PARAMdefault of 0.2504 mg/L in every clinical simulation regardless of the simulated MIC. The library models reproduce this behaviour so that they match the published figures, but it is an inconsistency in the deposited code rather than a stated modelling choice, and it affects only the C47 strain group. -
k1p2puses the central volume. In the deposited mrgsolve model the CMS1 peripheral-to-CMS2 peripheral micro-rate constant is writtenK1p2p = CLnrcmsi/Vc, using the central rather than the peripheral volume, in contrast to the neighbouringK1p1c = Q1/Vp. This is transcribed verbatim because it is what generated the published figures. - The extracted text lost every equation. A plain-text extraction of the PDF preserves none of the equations (14 equation blocks are reduced to placeholders). All 18 equations were recovered from the publisher’s rendered equation images deposited with the article and cross-checked against the deposited NONMEM control stream.