Metformin drug-drug interactions with OCT/MATE perpetrators (Yang 2021)
Source:vignettes/articles/Yang_2021_metformin_ddi_pbpk.Rmd
Yang_2021_metformin_ddi_pbpk.RmdModel and source
- Citation: Yang Y, Zhang Z, Li P, Kong W, Liu X, Liu L. A Whole-Body Physiologically Based Pharmacokinetic Model Characterizing Interplay of OCTs and MATEs in Intestine, Liver and Kidney to Predict Drug-Drug Interactions of Metformin with Perpetrators. Pharmaceutics. 2021;13(5):698. doi:10.3390/pharmaceutics13050698. Equations 1-17, Table 1 (drug parameters), Supplementary Table S1 (physiology), Table S2 (tissue:plasma ratios), Table S4 (metformin dose-ranging predictions) and Table S6 (DDI schedules).
- Description: PBPK (whole-body, transporter-mediated drug-drug interaction; Phoenix WinNonlin 8.1). The Yang 2021 metformin model solved simultaneously with one co-administered perpetrator that competitively inhibits the metformin carriers: intestinal OCT3 (apical enterocyte), hepatic OCT1 (sinusoidal), renal OCT2 (tubule basolateral) and renal MATE1/2-K (tubule apical). Metformin absorption is nonlinear: Michaelis-Menten uptake by intestinal OCT3 and PMAT in duodenum, jejunum and ileum (regional expression and pH scaling) plus 30% passive, over a six-segment gut-lumen transit chain. The liver is split into hepatic blood and hepatocytes (OCT1 uptake, passive diffusion, metabolism); the kidney into renal blood and tubule cells (OCT2 uptake with back-flux, MATE efflux, glomerular filtration). The perpetrator slot is parameterised: cimetidine uses the same transporter-resolved liver/kidney structure (tr = 1), while the other five perpetrators (pyrimethamine, trimethoprim, ondansetron, rabeprazole, verapamil) use well-stirred liver and kidney (tr = 0). Dosing the perpetrator states with zero amount recovers the metformin-alone arm, so one model object gives both arms of each interaction. The model ships set to cimetidine; the drugLibrary metadata holds all six perpetrators’ inputs and the validation vignette swaps them in to reproduce Table 2, Table 3, Table S4 and Figure 6. Deterministic typical-value model: the paper’s VPC estimated inter-individual variances on Vmax,OCT3, CLint,up,OCT1, CLint,up,OCT2, CLint,eff,MATE and Kti but did not report them, so no IIV is implemented. Several values are as-run reproductions of the WinNonlin model that deviate from the printed equations/constants (the metformin M-M absorption constants, the back-solved hepatic passive-diffusion clearance, and the rabeprazole metabolic clearance); see the vignette Errata.
- Article: https://doi.org/10.3390/pharmaceutics13050698 (open access, PMC8151202)
- Supplement: Table S1 (physiology), Table S2 (tissue:plasma ratios), Table S3/S4 (observed/predicted metformin dose ranging), Table S5 (perpetrator PK) and Table S6 (DDI schedules).
Yang and colleagues built a whole-body PBPK model for metformin in which disposition is controlled by the organic-cation transporters OCT1 (hepatic), OCT2 (renal), OCT3 (intestinal), the plasma-membrane monoamine transporter PMAT (intestinal) and the multidrug/toxin extrusion transporters MATE1/2-K (renal). Intestinal absorption is nonlinear, driven by Michaelis-Menten uptake through OCT3 and PMAT. The model predicts the interaction of metformin with six perpetrators that competitively inhibit these carriers: cimetidine, pyrimethamine, trimethoprim, ondansetron, rabeprazole and verapamil.
This is the same China Pharmaceutical University group, and the same
Table S1 human physiology, as
Kong_2020_vonoprazan_human_pbpk.
How the parameterised perpetrator slot works
The paper solves metformin together with one perpetrator at a time. The model carries that as two coupled blocks of states:
- the metformin block (bare state names, output
Cc): the victim, always the full transporter-resolved whole-body model; - the perpetrator block (
_perpetratorsuffix, outputCperp): a parameterised slot that ships set to cimetidine and whose values are swapped for any of the six perpetrators from the model’sdrugLibrarymetadata.
The perpetrator inhibits the four metformin carriers competitively,
each term of the form 1 / (1 + fub_perp * C_perp / Ki).
Dosing the perpetrator states with nothing recovers the metformin-alone
(control) arm, so one model object gives both arms of each
interaction.
Cimetidine uses the same transporter-resolved liver (hepatic blood +
hepatocytes) and kidney (renal blood + tubule) structure as metformin
(p_tr = 1); the other five perpetrators are described by a
well-stirred liver and kidney (p_tr = 0). Both structures
are present in every solve and the inactive one is held at zero by the
p_tr / 1 - p_tr multipliers. This follows the
parameterised-perpetrator design of
CherkaouiRbati_2017_midazolam_qsp and
Stader_2021_bictegravir_ddi_pbpk.
mod <- readModelDb("Yang_2021_metformin_ddi_pbpk")
ui <- rxode2::rxode(mod)
lib <- ui$meta$drugLibrary

perps <- c("cimetidine", "pyrimethamine", "trimethoprim", "ondansetron", "rabeprazole", "verapamil")

# Load a drugLibrary column into a named parameter vector for rxSolve.
perp_params <- function(drug) stats::setNames(lib[[drug]], lib$parameter)

# Solve metformin +/- a perpetrator. Doses in mg (converted to ug); times in
# minutes. A zero perpetrator dose is the control arm.
solve_run <- function(drug, met_mg, met_t = 0, perp_mg = 0, perp_t = 0, tend_min = 24 * 60) {
  ev <- rxode2::et(amt = met_mg * 1000, cmt = "stomach", time = met_t)
  if (perp_mg > 0) {
    ev <- ev |> rxode2::et(amt = perp_mg * 1000, cmt = "stomach_perpetrator", time = perp_t)
  }
  ev <- ev |> rxode2::et(seq(0, met_t + tend_min, by = 2))
  s <- as.data.frame(rxode2::rxSolve(ui, perp_params(drug), ev, atol = 1e-10, rtol = 1e-10))
  s[s$time >= met_t, ]
}

# Trapezoidal AUC of Cc over the window, minutes -> hours.
trap_auc <- function(time, conc) sum(diff(time) * (head(conc, -1) + tail(conc, -1)) / 2) / 60
Population
A PBPK model has no fitted population. The transporter and metabolism
parameters came from in vitro data and prior models (Table 1), the
physiology from Table S1 (a 70-kg adult), and the tissue:plasma ratios
from Table S2. The clinical plasma data used for comparison came from
healthy-volunteer studies. The paper’s visual predictive check estimated
inter-individual variances on Vmax,OCT3, the hepatic OCT1, renal OCT2
and renal MATE clearances, and the gastrointestinal transit rate, but
did not report them, so this model is typical-value only (no random
effects). The same information is available from
readModelDb("Yang_2021_metformin_ddi_pbpk")()$population.
Source trace
Every ini() value carries a comment giving the table or
equation it comes from. The drugLibrary metadata holds the
per-perpetrator inputs (Table 1 drug parameters and Table S2
tissue:blood ratios); molecular weights are from PubChem. A column
loaded into the p_* / ki_*_um /
kp_p parameters reproduces that perpetrator.
lib |>
  knitr::kable(
    caption = paste(
      "Per-perpetrator inputs of the parameterised perpetrator slot",
      "(drugLibrary metadata). Units are those of the corresponding ini() labels."
    ),
    digits = 5
)| parameter | cimetidine | pyrimethamine | trimethoprim | ondansetron | rabeprazole | verapamil |
|---|---|---|---|---|---|---|
| p_tr | 1.00000 | 0.00000e+00 | 0.00000 | 0.00000 | 0.0000e+00 | 0.000000e+00 |
| p_fub | 0.82000 | 1.50000e-01 | 0.43000 | 0.32500 | 4.0000e-02 | 1.400000e-01 |
| p_rbp | 0.97000 | 8.60000e-01 | 1.29000 | 0.83000 | 7.5000e-01 | 6.800000e-01 |
| p_clmet | 188.30000 | 2.72900e+01 | 52.40000 | 1365.14000 | 2.3890e+04 | 1.788300e+04 |
| p_ka_duodenum | 0.01200 | 6.20000e-02 | 0.03550 | 0.01200 | 2.9000e-02 | 1.560000e-02 |
| p_ka_jejunum | 0.01472 | 6.20000e-02 | 0.03550 | 0.01472 | 2.9000e-02 | 1.914000e-02 |
| p_ka_ileum | 0.01655 | 6.20000e-02 | 0.03550 | 0.01655 | 2.9000e-02 | 2.152000e-02 |
| p_clint_up_oct1 | 200.00000 | 0.00000e+00 | 0.00000 | 0.00000 | 0.0000e+00 | 0.000000e+00 |
| p_clint_up_oct2 | 539.80000 | 0.00000e+00 | 0.00000 | 0.00000 | 0.0000e+00 | 0.000000e+00 |
| p_clint_eff_mate | 532.20000 | 0.00000e+00 | 0.00000 | 0.00000 | 0.0000e+00 | 0.000000e+00 |
| p_clint_renal | 0.00000 | 3.13452e+00 | 193.20090 | 0.00000 | 0.0000e+00 | 0.000000e+00 |
| p_clint_pd | 0.00000 | 0.00000e+00 | 0.00000 | 0.00000 | 0.0000e+00 | 0.000000e+00 |
| p_mw | 252.34000 | 2.48710e+02 | 290.32000 | 293.37000 | 3.5944e+02 | 4.546000e+02 |
| ki_oct1_um | 101.00000 | 4.46000e+00 | 27.70000 | 0.27000 | 3.0000e+00 | 9.620000e+00 |
| ki_oct2_um | 2.97000 | 6.10000e-01 | 19.80000 | 0.89000 | 5.7000e+00 | 3.240000e+00 |
| ki_oct3_um | 45.70000 | 1.00000e+06 | 12.30000 | 17.40000 | 3.0000e+00 | 3.600000e+00 |
| ki_mate_um | 0.65000 | 2.00000e-02 | 0.51000 | 0.01000 | 4.6000e+00 | 1.000000e+06 |
| tissopt | 1.00000 | 1.00000e+00 | 1.00000 | 1.00000 | 1.0000e+00 | 1.000000e+00 |
| cellopt | 1.00000 | 1.00000e+00 | 1.00000 | 1.00000 | 1.0000e+00 | 1.000000e+00 |
| kgb_p | 1.21650 | 3.60465e+00 | 1.00775 | 2.61446 | 2.2667e-01 | 3.216176e+01 |
| ksb_p | 1.21650 | 3.60465e+00 | 1.00775 | 0.89157 | 1.0667e-01 | 3.216176e+01 |
| kspb_p | 2.08247 | 4.18605e+00 | 1.46512 | 0.87952 | 1.4667e-01 | 3.685294e+01 |
| khb_p | 1.50516 | 8.72093e+00 | 1.47287 | 1.40964 | 1.3333e-01 | 8.904412e+01 |
| krb_p | 1.62887 | 7.90698e+00 | 1.47287 | 1.34940 | 1.8667e-01 | 8.044118e+01 |
| klub_p | 2.42268 | 2.79070e+00 | 1.58140 | 1.78313 | 2.9333e-01 | 2.094118e+01 |
| kheb_p | 1.46392 | 3.13953e+00 | 1.03876 | 1.27711 | 2.2667e-01 | 2.833824e+01 |
| kbrb_p | 1.67010 | 2.20930e+00 | 1.18605 | 2.39759 | 8.0000e-02 | 1.277941e+01 |
| kmub_p | 1.21650 | 1.43023e+00 | 0.75969 | 0.89157 | 1.0667e-01 | 1.114706e+01 |
| kadb_p | 1.94845 | 7.90698e+00 | 2.94574 | 47.01205 | 1.0667e-01 | 1.904412e+01 |
| kskb_p | 2.38144 | 2.44186e+00 | 1.50388 | 3.75904 | 3.8667e-01 | 1.836765e+01 |
| kreb_p | 0.01031 | 1.16300e-02 | 0.77519 | 0.01205 | 1.3330e-02 | 1.471000e-02 |
tibble::tribble(
  ~Component, ~Source,
  "Gut lumen / wall transit, 6 segments", "Eqs 1-3; Table S1 transit constants",
  "Metformin OCT3 + PMAT M-M absorption", "Eqs 2-3; Table 1 / Methods Vmax, Km, PBSF, Tsf",
  "Hepatic OCT1 uptake + passive diffusion + metabolism", "Eqs 7-8; Table 1",
  "Renal OCT2 uptake/back-flux, MATE efflux, GFR", "Eqs 12-13; Table 1",
  "Competitive inhibition at OCT1/OCT2/OCT3/MATE", "Eqs 4, 7-8, 12-13; Table 1 Ki",
  "Perpetrator well-stirred liver / kidney (tr = 0)", "Eqs 11, 14-15",
  "Whole-body blood and tissue mass balance", "Eqs 16-17; Table S1",
  "Tissue:blood partition ratios", "Table S2 (Kp / Rb)"
) |>
knitr::kable(caption = "Source location for each model component.")| Component | Source |
|---|---|
| Gut lumen / wall transit, 6 segments | Eqs 1-3; Table S1 transit constants |
| Metformin OCT3 + PMAT M-M absorption | Eqs 2-3; Table 1 / Methods Vmax, Km, PBSF, Tsf |
| Hepatic OCT1 uptake + passive diffusion + metabolism | Eqs 7-8; Table 1 |
| Renal OCT2 uptake/back-flux, MATE efflux, GFR | Eqs 12-13; Table 1 |
| Competitive inhibition at OCT1/OCT2/OCT3/MATE | Eqs 4, 7-8, 12-13; Table 1 Ki |
| Perpetrator well-stirred liver / kidney (tr = 0) | Eqs 11, 14-15 |
| Whole-body blood and tissue mass balance | Eqs 16-17; Table S1 |
| Tissue:blood partition ratios | Table S2 (Kp / Rb) |
Metformin nonlinear absorption (Table S4)
The paper’s headline absorption result is that metformin oral clearance (dose/AUC) rises with dose because intestinal OCT3/PMAT uptake saturates. The model reproduces the predicted dose-ranging Cmax and AUC of Table S4.
doses <- c(250, 500, 750, 850, 1000)
sim_conc <- bind_rows(lapply(doses, function(d) {
  s <- solve_run("cimetidine", met_mg = d, perp_mg = 0)
  data.frame(treatment = paste(d, "mg"), dose = d, time = s$time / 60, Cc = s$Cc)
}))

# PKNCA single-dose NCA, grouped by dose. One id per dose arm.
nca_conc <- sim_conc |>
  filter(!is.na(Cc)) |>
  mutate(id = dose) |>
  select(id, treatment, dose, time, Cc)
nca_dose <- data.frame(id = doses, treatment = paste(doses, "mg"), dose = doses, time = 0)
met_nca <- PKNCA::pk.nca(PKNCA::PKNCAdata(
  PKNCA::PKNCAconc(nca_conc, Cc ~ time | treatment + id),
  PKNCA::PKNCAdose(nca_dose, dose ~ time | treatment + id),
  intervals = data.frame(start = 0, end = 24, cmax = TRUE, tmax = TRUE, auclast = TRUE)
))
sim_wide <- as.data.frame(met_nca) |>
  select(treatment, PPTESTCD, PPORRES) |>
  pivot_wider(names_from = PPTESTCD, values_from = PPORRES)
# Table S4 predicted values (the model's own target).
tableS4 <- tibble::tibble(
  treatment = paste(doses, "mg"),
  cmax = c(0.67, 0.95, 1.22, 1.32, 1.47),
  auclast = c(4.80, 7.68, 10.19, 11.15, 12.55)
)
met_cmp <- nlmixr2lib::ncaComparisonTable(
  sim_wide, tableS4,
  by = "treatment",
  params = c("cmax", "auclast"),
  units = c(cmax = "ug/mL", auclast = "h*ug/mL")
)
knitr::kable(
  met_cmp,
  caption = "Metformin dose ranging: PKNCA of the simulation vs Table S4 predictions. * > 20% difference."
)| NCA parameter | treatment | Reference | Simulated | % diff |
|---|---|---|---|---|
| Cmax (ug/mL) | 250 mg | 0.67 | 0.673 | +0.4% |
| Cmax (ug/mL) | 500 mg | 0.95 | 0.955 | +0.5% |
| Cmax (ug/mL) | 750 mg | 1.22 | 1.22 | -0.3% |
| Cmax (ug/mL) | 850 mg | 1.32 | 1.32 | -0.1% |
| Cmax (ug/mL) | 1000 mg | 1.47 | 1.47 | +0.1% |
| AUClast (h*ug/mL) | 250 mg | 4.8 | 4.8 | +0.0% |
| AUClast (h*ug/mL) | 500 mg | 7.68 | 7.68 | +0.0% |
| AUClast (h*ug/mL) | 750 mg | 10.2 | 10.2 | +0.0% |
| AUClast (h*ug/mL) | 850 mg | 11.2 | 11.2 | +0.0% |
| AUClast (h*ug/mL) | 1000 mg | 12.6 | 12.6 | +0.0% |
# Structural gate: the as-run model must reproduce Table S4 to a few percent.
met_diff <- as.numeric(gsub("[^0-9.eE-]", "", met_cmp[["% diff"]]))
stopifnot(all(abs(met_diff) < 3))
ggplot(sim_conc, aes(time, Cc, colour = factor(dose))) +
  geom_line() +
  labs(x = "Time (h)", y = "Metformin plasma (ug/mL)", colour = "Dose (mg)") +
  theme_bw()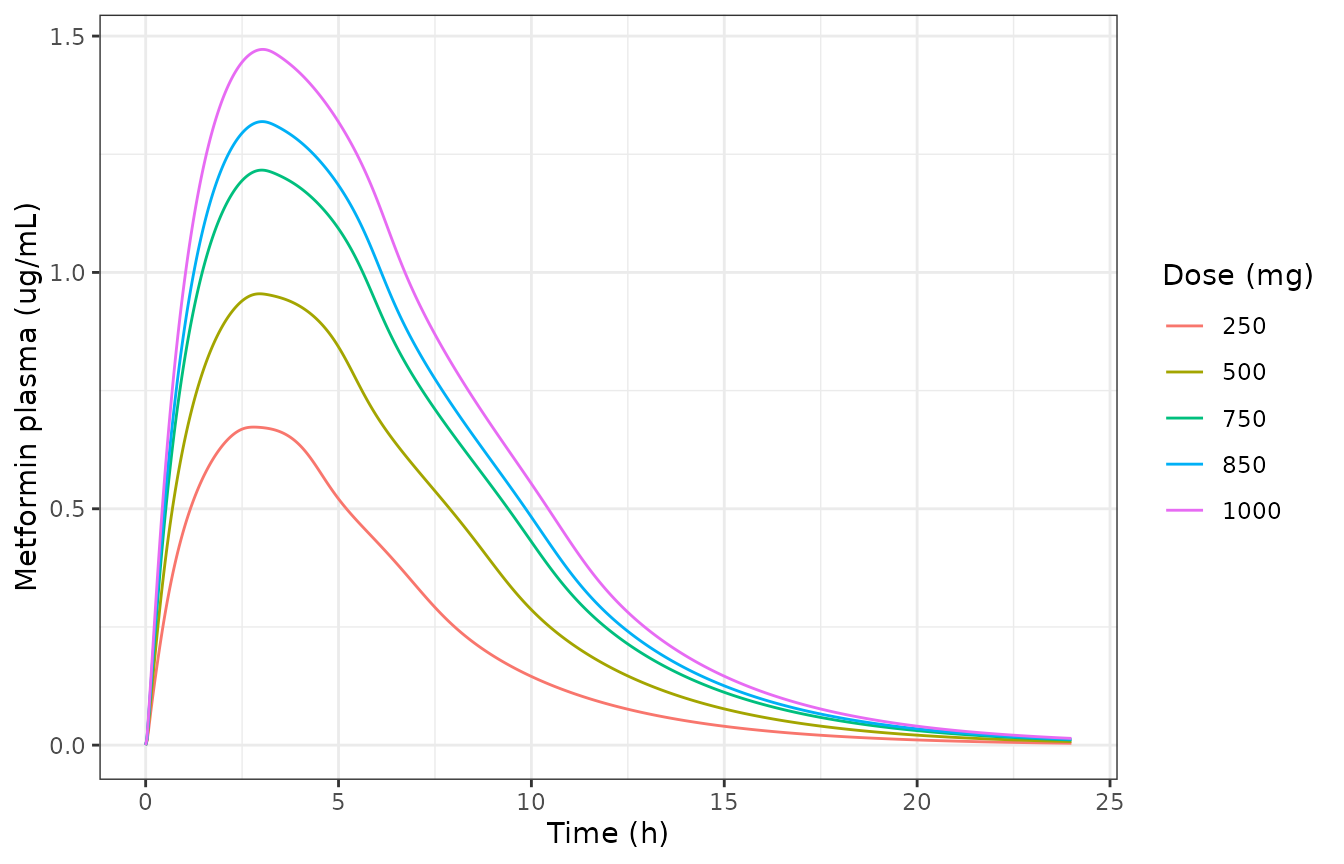
Metformin plasma concentration by oral dose (replicates Figure 3a of Yang 2021).
Transporter contributions to metformin exposure (Figure 6b)
The individual contribution of each transporter is the percent change in metformin AUC when that transporter is removed. The model reproduces the Figure 6b values: renal OCT2 and MATE dominate (each roughly +160% when removed), intestinal OCT3 and PMAT act in the opposite direction, and hepatic OCT1 is minor.
auc250 <- function(over = NULL) {
  ev <- rxode2::et(amt = 250 * 1000, cmt = "stomach") |> rxode2::et(seq(0, 24 * 60, by = 2))
  s <- as.data.frame(rxode2::rxSolve(ui, if (is.null(over)) numeric(0) else over, ev, atol = 1e-10, rtol = 1e-10))
  trap_auc(s$time, s$Cc)
}
ctrl <- auc250()
ko <- c(OCT3 = "vmax_oct3", PMAT = "vmax_pmat", OCT1 = "clint_up_oct1", OCT2 = "clint_up_oct2", MATE = "clint_eff_mate")
paper_pct <- c(OCT3 = -35.94, PMAT = -12.06, OCT1 = 15.67, OCT2 = 160.30, MATE = 159.80)
contrib <- data.frame(
  Transporter = names(ko),
  `Simulated %` = round(sapply(ko, function(p) 100 * (auc250(stats::setNames(0, p)) / ctrl - 1)), 2),
  `Paper %` = paper_pct,
  check.names = FALSE
)
knitr::kable(contrib, row.names = FALSE, caption = "Contribution of each transporter to metformin AUC (Figure 6b).")| Transporter | Simulated % | Paper % |
|---|---|---|
| OCT3 | -35.87 | -35.94 |
| PMAT | -12.10 | -12.06 |
| OCT1 | 15.81 | 15.67 |
| OCT2 | 160.46 | 160.30 |
| MATE | 159.97 | 159.80 |
Perpetrator standalone pharmacokinetics (Table 2)
Each perpetrator’s own plasma PK is reproduced by loading its
drugLibrary column and dosing only the perpetrator
slot.
perp_doses <- list(cimetidine = 400, pyrimethamine = 50, trimethoprim = 210, ondansetron = 8, rabeprazole = 40, verapamil = 40)
perp_tbl <- bind_rows(lapply(names(perp_doses), function(d) {
  dose <- perp_doses[[d]]
  ev <- rxode2::et(amt = dose * 1000, cmt = "stomach_perpetrator") |> rxode2::et(seq(0, 24 * 60, by = 2))
  s <- as.data.frame(rxode2::rxSolve(ui, perp_params(d), ev, atol = 1e-10, rtol = 1e-10))
  data.frame(Perpetrator = d, `Dose (mg)` = dose, Cmax = max(s$Cperp), `AUC0-24` = trap_auc(s$time, s$Cperp), check.names = FALSE)
}))
# Paper Table 2 predicted Cmax / AUC (same doses).
perp_tbl$`Paper Cmax` <- c(2.06, 0.57, 2.18, 0.046, 0.40, 0.050)
perp_tbl$`Paper AUC` <- c(9.17, 31.18, 28.26, 0.203, 1.27, 0.28)
knitr::kable(perp_tbl, digits = 3, caption = "Perpetrator standalone Cmax (ug/mL) and AUC0-24 (ug*h/mL) vs Table 2 predictions.")| Perpetrator | Dose (mg) | Cmax | AUC0-24 | Paper Cmax | Paper AUC |
|---|---|---|---|---|---|
| cimetidine | 400 | 1.914 | 7.694 | 2.060 | 9.170 |
| pyrimethamine | 50 | 0.575 | 7.860 | 0.570 | 31.180 |
| trimethoprim | 210 | 2.008 | 20.831 | 2.180 | 28.260 |
| ondansetron | 8 | 0.047 | 0.227 | 0.046 | 0.203 |
| rabeprazole | 40 | 0.545 | 0.902 | 0.400 | 1.270 |
| verapamil | 40 | 0.050 | 0.278 | 0.050 | 0.280 |
Drug-drug interactions with metformin (Table 3)
Loading a perpetrator and dosing both drugs on the Table S6 schedule gives the interaction. The interaction ratio is AUC (or Cmax) with perpetrator over the metformin-alone control.
# perpetrator, metformin dose (mg), metformin time offset (min), perpetrator dose (mg)
ddi_cases <- tibble::tribble(
  ~perp,            ~met_mg, ~met_t, ~perp_mg,
  "cimetidine",     500,     120,    400,
  "pyrimethamine",  500,     0,      50,
  "ondansetron",    850,     60,     8,
  "verapamil",      750,     0,      180,
  "rabeprazole",    500,     720,    20
)
ddi <- bind_rows(lapply(seq_len(nrow(ddi_cases)), function(i) {
  r <- ddi_cases[i, ]
  a <- solve_run(r$perp, r$met_mg, r$met_t, 0)
  b <- solve_run(r$perp, r$met_mg, r$met_t, r$perp_mg, 0)
  data.frame(
    Perpetrator = r$perp,
    `AUCR (sim)` = round(trap_auc(b$time, b$Cc) / trap_auc(a$time, a$Cc), 2),
    `CmaxR (sim)` = round(max(b$Cc) / max(a$Cc), 2),
    check.names = FALSE
  )
}))
# Paper Table 3 AUCR / CmaxR for the matched rows.
ddi$`AUCR (paper)` <- c(1.52, 2.09, 1.16, 1.09, 1.00)
ddi$`CmaxR (paper)` <- c(1.40, 1.73, 1.16, 1.05, 0.95)
knitr::kable(ddi, caption = "Metformin interaction ratios vs Table 3. See the deviations section for cimetidine and pyrimethamine.")| Perpetrator | AUCR (sim) | CmaxR (sim) | AUCR (paper) | CmaxR (paper) |
|---|---|---|---|---|
| cimetidine | 1.11 | 1.10 | 1.52 | 1.40 |
| pyrimethamine | 2.49 | 1.66 | 2.09 | 1.73 |
| ondansetron | 1.15 | 1.15 | 1.16 | 1.16 |
| verapamil | 1.06 | 1.02 | 1.09 | 1.05 |
| rabeprazole | 1.00 | 1.00 | 1.00 | 0.95 |
Assumptions and deviations (Errata)
The model is an as-run reproduction of the published WinNonlin model, and several values deviate from the printed equations and constants. Each is documented inline in the model file and summarised here.
-
Metformin OCT3/PMAT absorption (Table 1 constants).
The model reproduces Table S4 only when (i) the Michaelis-Menten uptake
is driven by the gut-lumen concentration
A_i / V_irather than the enterocyte concentration of the printed Eqs 2-3 (taken literally, the printed form drives the lumen negative and makes absorption linear), and (ii) the reported Km (2.46 and 1.68 mM) and Vmax (12.08 and 15.28 nmol/mg/min, used as /1000) are applied to the ug amounts without molar-to-mass conversion. This dimensionally inconsistent as-run form reproduces Table S4 at every dose, the oral microdose and the OCT3/PMAT knockouts; the dimensionally correct form predicts a Cmax four to six times too high. The maintainers ship the as-run form that reproduces the paper. - Hepatic passive-diffusion clearance CLint,pd. Eqs 7-8 use a hepatocyte-to-blood passive-diffusion clearance that is printed nowhere in the paper or supplement. Six independent printed metformin outputs (the control AUC, the no-OCT1 and no-OCT2 percentages, the no-OCT2 AUC, and the 500 and 1000 mg AUCs) all back-solve to a value between 10 and 12 mL/min, so the maintainers ship 11 mL/min. Cimetidine is insensitive to its own hepatic passive diffusion, so the perpetrator value is 0.
-
Rabeprazole metabolic clearance. The printed
fub * CLintform (fub 0.04, CLint 955.6 mL/min) over-predicts rabeprazole exposure about 17-fold. The published rabeprazole PK is reproduced when CLint is applied as a blood clearance withoutfub; the model encodes this for rabeprazole only by shippingp_clmet = 955.6 / 0.04 = 23890, so the model’sfub * CLintterm recovers 955.6 mL/min. - Cimetidine interaction is under-predicted. With the printed transporter-resolved cimetidine structure the model gives an interaction of about AUCR 1.11 / CmaxR 1.10, against the published 1.52 / 1.40. A well-stirred cimetidine reproduces the interaction but then over-predicts cimetidine’s own exposure about two-fold, so neither structure reproduces both. The maintainers follow the Methods text and keep the printed transporter structure, and note the interaction shortfall here.
- Pyrimethamine interaction. Pyrimethamine’s own exposure is poorly predicted by the paper (Table 2 predicted AUC 31-47 vs observed 42-124), and its interaction ratio is correspondingly approximate.
-
Printed-equation typos, corrected by mass balance.
Eq 7 as printed has an
A_h,b / V_h,cterm (should beV_h,b) and multiplies a portal inflow byKg:brather than dividing; Eq 11 has a hepatic outflow without theKh:bpartition. The model uses the mass-balance-consistent forms. - No inter-individual variability. The paper’s VPC estimated variances but did not report them, so the model is typical-value only.
- Molecular weights used for the Ki unit conversion (uM to ug/mL) are from PubChem, not the paper.