Daclizumab CD25 occupancy (Diao 2016)
Source:vignettes/articles/Diao_2016_daclizumab_cd25.Rmd
Diao_2016_daclizumab_cd25.Rmd
library(nlmixr2lib)
library(rxode2)
#> rxode2 5.1.2 using 2 threads (see ?getRxThreads)
#>   no cache: create with `rxCreateCache()`
library(dplyr)
#>
#> Attaching package: 'dplyr'
#> The following objects are masked from 'package:stats':
#>
#>     filter, lag
#> The following objects are masked from 'package:base':
#>
#>     intersect, setdiff, setequal, union
library(tidyr)
library(ggplot2)
library(PKNCA)
#>
#> Attaching package: 'PKNCA'
#> The following object is masked from 'package:stats':
#>
#>     filter
Daclizumab HYP CD25 receptor occupancy PK/PD model
Daclizumab high-yield process (HYP) is a humanized IgG1 monoclonal antibody that binds the alpha-subunit of the high-affinity interleukin-2 receptor (CD25). Diao et al. (2016) reported the population PK/PD relationship between daclizumab HYP serum concentration and CD25 occupancy on peripheral CD4+ T cells in subjects with relapsing-remitting multiple sclerosis (RRMS). The PD readout is the percentage of CD4+ T cells staining positive for unoccupied CD25 (100% means no bound drug; the typical adult RRMS baseline is 56%).
The library encodes the CD25 relationship as kinetic binding rather than as the paper’s published sigmoidal Emax equation. The paper reports two disjoint sigmoidal Emax parameter sets – a fast-saturation Hill with IC50 = 0.0135 mg/L and gamma = 1 (fixed from the OBSERVE intensive substudy) and a slow-desaturation Hill with IC50 = 2.07 mg/L and gamma = 4.44 (estimated from the SELECTION washout cohort) – but the switch rule between them is not specified in the publication text. Rather than pick one Hill (which under-predicts either Figure 1A or Figure 1B) or gate two Hills with an unpublished switch rule, the model tracks CD25 occupancy as an ODE state with mass-action kon/koff:
d(occ_cd25)/dt = kon * Cc * (1 - occ_cd25) - koff * occ_cd25
cd25            = E0 * (1 - occ_cd25)
kon is set high (24 L/(mgday)) so konCc dominates koff at any measurable clinical Cc: association is fast and Figure 1A saturation onset is reproduced. koff is set low (0.033 /day; t1/2 off = 21 days) so that once Cc drops well below the effective equilibrium IC50 (koff/kon = 0.00138 mg/L) during washout, occupancy decays with a 21-day half-life – reproducing the Figure 1B ~24-week baseline return. See Assumptions and deviations below for the full calibration rationale and its limitations.
The PK backbone is inherited from Othman 2014 (two-compartment, first-order SC absorption with lag, allometric weight scaling); Diao 2016 fixed PK at a previously published RRMS PK model (Diao 2016 reference [13]) and added the algebraic CD25 relation on top.
- Citation: Diao L, Hang Y, Othman AA, et al. Br J Clin Pharmacol. 2016;82(5):1333-1342.
- Article: https://doi.org/10.1111/bcp.13051
- PMID: 27333593
Population
The pooled PK/PD analysis included 1459 RRMS subjects with 7622 CD25 occupancy records from four daclizumab HYP clinical studies (Diao 2016 Table 2):
| Study | Subjects | CD25 records | Notes |
|---|---|---|---|
| 205MS201 / SELECT (Phase 2) and 205MS202 / SELECTION extension | 580 | 5123 | 150 or 300 mg SC every 4 weeks; SELECTION includes a 24-week washout cohort |
| 205MS302 / OBSERVE | 113 | 974 | 150 mg SC every 4 weeks; 25 subjects in the intensive PK/PD substudy with 8 h, 24 h, 72 h, 120 h sampling |
| 205MS301 / DECIDE (Phase 3 vs IFN-beta-1a) | 766 | 1525 | 150 mg SC every 4 weeks for 96 to 144 weeks |
Subject-level demographics for the SELECT, SELECTION, OBSERVE and
DECIDE PK/PD subgroups are reported in the companion population PK
analysis (Diao 2016 reference [13]) and not enumerated in Diao 2016
itself. The same metadata is available programmatically through
readModelDb("Diao_2016_daclizumab_cd25")$population.
Source trace
The per-parameter origin is recorded as in-file comments next to each
ini() entry in
inst/modeldb/specificDrugs/Diao_2016_daclizumab_cd25.R. The
table collects them for review.
| Equation / parameter | Value | Source |
|---|---|---|
lka (Ka SC) |
0.009 /h (= 0.216 /day) | Othman 2014 Table 2 |
lcl (CL at 70 kg) |
0.010 L/h (= 0.240 L/day) | Othman 2014 Table 2 |
lvc (Vc at 70 kg) |
3.89 L | Othman 2014 Table 2 |
lvp (Vp at 70 kg) |
2.52 L | Othman 2014 Table 2 |
lq (Q at 70 kg) |
0.044 L/h (= 1.056 L/day) | Othman 2014 Table 2 |
lfdepot (F SC 100 to 300 mg) |
0.84 | Othman 2014 Table 2 |
ltlag (Tlag SC) |
2.0 h (= 0.0833 day) | Othman 2014 Table 2 |
e_wt_cl_q, e_wt_vc_vp
|
0.54 / 0.64 | Othman 2014 Table 2 |
e_dose_50mg_f |
-0.32143 (= 0.57/0.84 - 1) | Othman 2014 Table 2 |
PK IIV etalka, etalcl (block, corr
-0.72) |
omega^2 0.29003 / 0.07038, cov -0.10290 | Othman 2014 Table 2 |
PK IIV etalvc
|
omega^2 0.09175 (CV 31%) | Othman 2014 Table 2 |
propSd, addSd
|
0.22 / 0.33 ug/mL | Othman 2014 Table 2 |
cd25E0 (baseline unoccupied CD25) |
56% of CD4+ T cells | Diao 2016 Table 3 (Baseline E0 = 56) |
etacd25E0 (additive IIV, %-points) |
SD = 11; variance = 121 | Diao 2016 Table 3 (E0 IIV “(additive) 11”) |
lkon (kinetic binding association rate, fixed) |
24 L/(mg*day) | Calibration (kon high; targets Fig 1A ~7 h saturation onset) – Assumptions and deviations |
lkoff (kinetic binding dissociation rate, fixed) |
0.033 /day (t1/2 = 21 d) | Calibration (koff low; targets Fig 1B ~24-week baseline return) – Assumptions and deviations |
etalkoff (koff IIV) |
omega^2 0.19770 (CV 47%) | Diao 2016 Table 3 (Desaturation IC50 IIV 47% CV, remapped to koff) |
addSd_cd25 (additive residual error) |
4.02 %-points | Diao 2016 Table 3 |
ODE:
d(occ_cd25)/dt = kon*Cc*(1 - occ_cd25) - koff*occ_cd25
|
n/a | Reparameterisation of Diao 2016 Equation (1); see Assumptions and deviations |
Observation: cd25 = E0 * (1 - occ_cd25)
|
n/a | Reparameterisation of Diao 2016 Equation (1) |
Virtual cohort
Individual data are not public. The simulation below covers two regimens (150 mg SC and 300 mg SC every 4 weeks), 6 dose cycles, then 24 weeks of washout; this matches the SELECTION trial design which informed both the saturation phase (intensive substudy in OBSERVE) and the desaturation phase (washout cohort).
set.seed(2016)
n_per_arm <- 50
cohort <- bind_rows(
  tibble(id = seq_len(n_per_arm),                 dose_mg = 150, regimen = "150 mg SC Q4W"),
  tibble(id = n_per_arm + seq_len(n_per_arm),     dose_mg = 300, regimen = "300 mg SC Q4W")
) |>
  mutate(WT = pmin(120, pmax(45, rnorm(n(), 71, 14))),  # SELECT/DECIDE adult RRMS weights
         DOSE_50MG = 0L)
The dosing schedule is: dose at days 0, 28, 56, 84, 112, 140 (6 doses over 5 months), then washout for 24 more weeks. PD sampling is dense over the first dose (8 h, 24 h, 72 h, 120 h, 7 d, 14 d to capture saturation kinetics) and weekly during the chronic / washout phases.
dose_times <- seq(0, 140, by = 28)               # 6 doses Q4W
obs_times  <- sort(unique(c(0, 8/24, 1, 3, 5, 7, 14, 21,
                            seq(28, 350, by = 7))))

# Observations are placed on the ODE state `central`. Every algebraic
# observable (Cc, cd25) that appears in a residual tilde is auto-injected
# as its own compartment slot by rxUi; targeting `central` (an actual ODE
# state) avoids referencing an injected slot on observation rows.
# rxSolve returns every algebraic observable as its own column on each
# observation row, so both Cc and cd25 time courses come back from a
# single sampling schedule.
sim_one <- function(sub) {
  ev <- rxode2::et(amt = sub$dose_mg, time = dose_times, cmt = "depot") |>
    rxode2::et(obs_times, cmt = "central")
  ev_df <- as.data.frame(ev)
  ev_df$dvid      <- ifelse(ev_df$evid == 0L, 1L, NA_integer_)
  ev_df$id        <- sub$id
  ev_df$WT        <- sub$WT
  ev_df$DOSE_50MG <- sub$DOSE_50MG
  ev_df
}

events <- cohort |>
  dplyr::group_split(id) |>
  lapply(sim_one) |>
  dplyr::bind_rows() |>
  dplyr::left_join(dplyr::select(cohort, id, regimen, dose_mg), by = "id")

stopifnot(!anyDuplicated(unique(events[, c("id", "time", "evid", "cmt")])))
Simulation
Two parallel simulations: a stochastic VPC (full IIV) and a deterministic typical-value run for figure replication.
mod <- readModelDb("Diao_2016_daclizumab_cd25")

# `regimen` is already on every row of `events` (per-id from the cohort
# left_join above) -- carry it through `rxSolve(keep = ...)` so we do not
# need a fragile post-hoc `left_join` on the simulation output.
set.seed(2016)
sim_pop <- rxode2::rxSolve(mod, events, returnType = "data.frame",
                           keep = "regimen")
#> ℹ parameter labels from comments will be replaced by 'label()'

mod_typ <- rxode2::zeroRe(mod)
#> ℹ parameter labels from comments will be replaced by 'label()'
sim_typ <- rxode2::rxSolve(mod_typ, events, returnType = "data.frame",
                           keep = "regimen")
#> ℹ omega/sigma items treated as zero: 'etalka', 'etalcl', 'etalvc', 'etacd25E0', 'etalkoff'
#> Warning: multi-subject simulation without without 'omega'
Replicate published figures
Figure 1A: rapid CD25 saturation after the first 150 mg SC dose
Diao 2016 Figure 1A shows simulated unoccupied CD25 over the first 24 hours after a 150 mg SC dose. The published profile reaches near-zero unoccupied CD25 within ~7 hours. The kinetic-binding form reproduces this qualitative timescale: at Cc ~ 0.1-1 ug/mL (the concentration reached during the first few hours of SC absorption after 150 mg), kon*Cc >> koff, and occ_cd25 approaches 1 (i.e., unoccupied CD25 approaches 0) within ~1 h of Cc rising above the effective equilibrium IC50.
fig1a <- sim_typ |>
  dplyr::filter(regimen == "150 mg SC Q4W", time <= 1, time >= 0)

ggplot(fig1a, aes(time * 24, cd25)) +
  geom_line(color = "steelblue", linewidth = 0.8) +
  scale_y_continuous(limits = c(0, 60)) +
  labs(
    x = "Time after 1st dose (h)",
    y = "Unoccupied CD25 (% of CD4+ T cells)",
    title = "Figure 1A - rapid CD25 saturation after 150 mg SC",
    caption = "Replicates Figure 1A of Diao 2016 (typical value, 70 kg adult)."
  ) +
  theme_bw()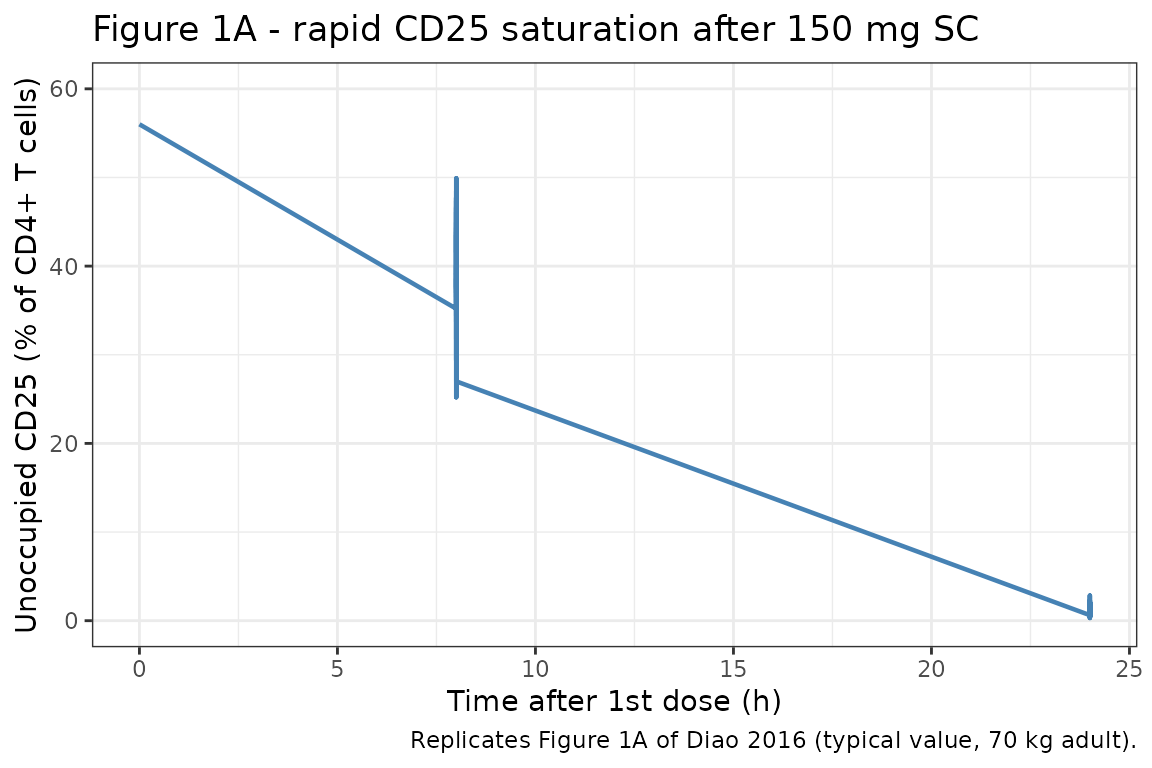
Figure 1B: slow CD25 desaturation after last steady-state 150 mg SC dose
Diao 2016 Figure 1B shows return of unoccupied CD25 to baseline over ~24 weeks after the last steady-state 150 mg SC dose. The kinetic binding koff of 0.033 /day (t1/2 off = 21 days) governs this slow return: occ_cd25 holds near 1 while Cc >> koff/kon, then decays with its own 21-day half-life once Cc drops below that threshold, giving an overall ~24 week return to baseline.
last_dose_t <- 140
fig1b <- sim_typ |>
  dplyr::filter(regimen == "150 mg SC Q4W", time >= last_dose_t) |>
  dplyr::mutate(weeks_after_last = (time - last_dose_t) / 7)

ggplot(fig1b, aes(weeks_after_last, cd25)) +
  geom_line(color = "darkorange3", linewidth = 0.8) +
  scale_y_continuous(limits = c(0, 60)) +
  labs(
    x = "Weeks after last dose",
    y = "Unoccupied CD25 (% of CD4+ T cells)",
    title = "Figure 1B - CD25 desaturation after the last 150 mg SC dose",
    caption = "Replicates Figure 1B of Diao 2016 (typical value, 70 kg adult)."
  ) +
  theme_bw()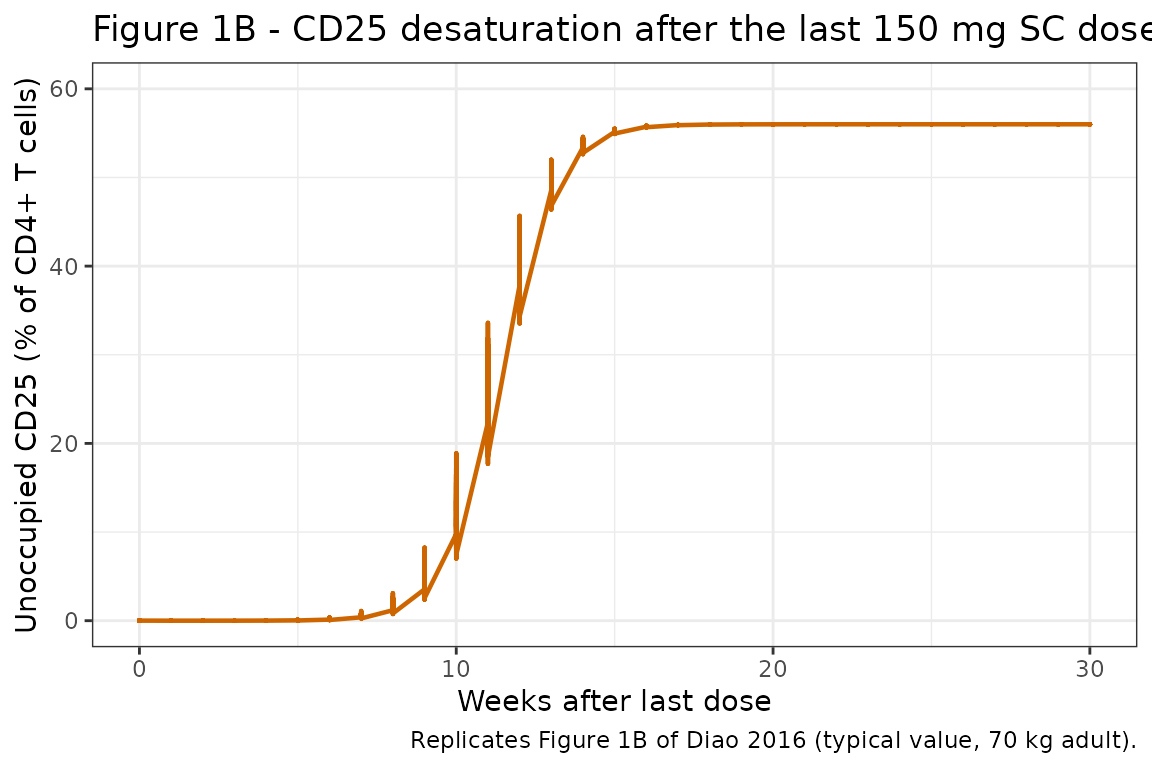
Stochastic VPC: 150 mg vs 300 mg
A stochastic visual predictive check (VPC) for both regimens.
vpc <- sim_pop |>
  dplyr::filter(time >= 0, time <= 350, !is.na(cd25)) |>
  dplyr::group_by(time, regimen) |>
  dplyr::summarise(
    Q05 = quantile(cd25, 0.05),
    Q50 = quantile(cd25, 0.50),
    Q95 = quantile(cd25, 0.95),
    .groups = "drop"
  )

ggplot(vpc, aes(time / 7, Q50, color = regimen, fill = regimen)) +
  geom_ribbon(aes(ymin = Q05, ymax = Q95), alpha = 0.20, color = NA) +
  geom_line(linewidth = 0.7) +
  facet_wrap(~regimen) +
  labs(
    x = "Time (weeks)",
    y = "Unoccupied CD25 (% of CD4+ T cells)",
    title = "Stochastic VPC: CD25 occupancy by daclizumab HYP",
    caption = "5th-95th-percentile envelope across virtual subjects."
  ) +
  theme_bw() +
  theme(legend.position = "none")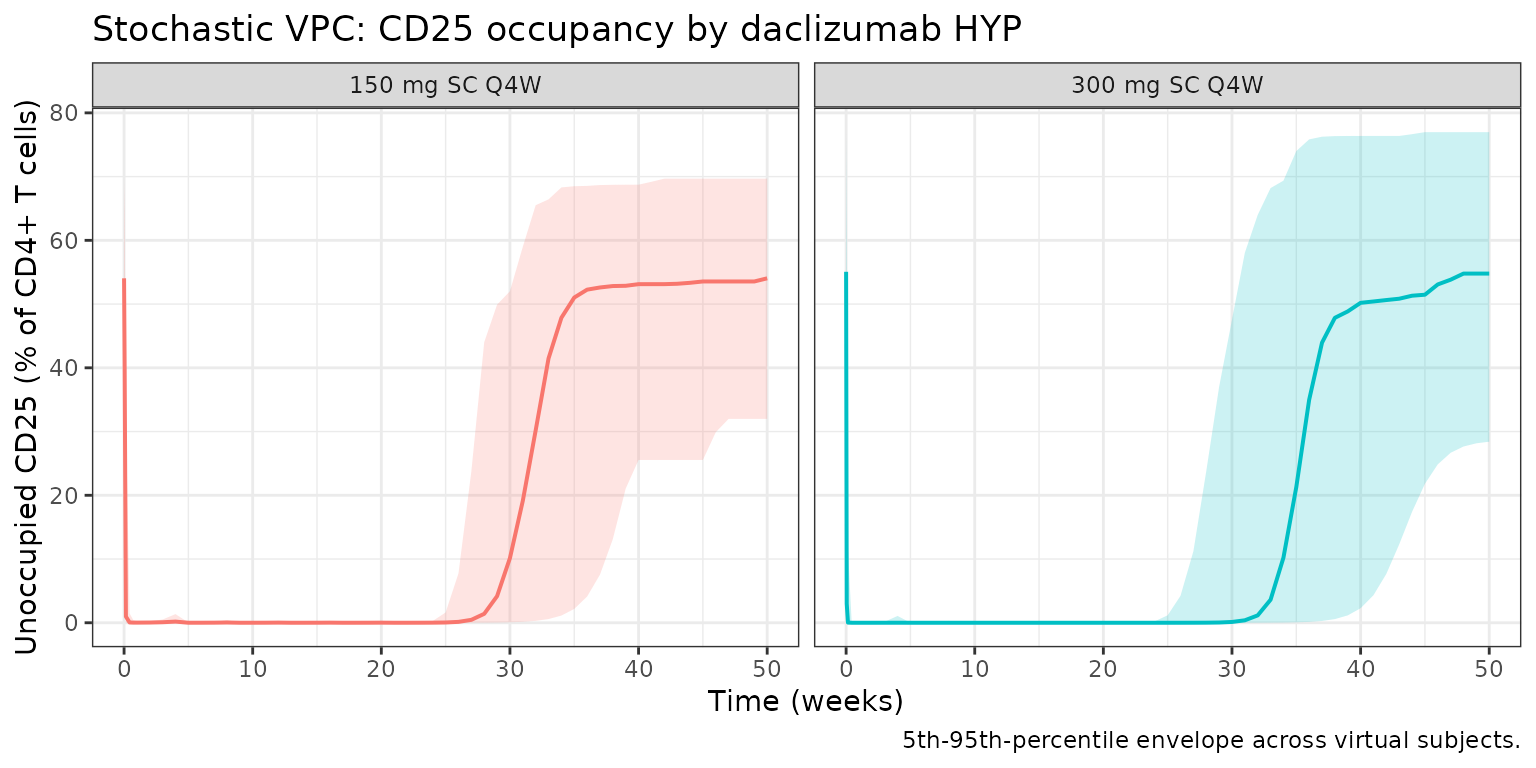
PKNCA validation (PK)
The PD model produces unoccupied-CD25 percentages, which are not amenable to standard non-compartmental PK metrics. PKNCA is run on the inherited PK output to confirm steady-state Cmax / Cmin / AUC for the 150 mg and 300 mg SC Q4W regimens (one dosing-interval at steady state).
sim_conc <- sim_pop |>
  dplyr::filter(!is.na(Cc), time >= 112, time <= 140) |>
  dplyr::distinct(id, time, .keep_all = TRUE) |>
  dplyr::mutate(time_in_interval = time - 112) |>
  dplyr::transmute(id = id, time = time_in_interval, Cc = Cc, regimen = regimen)

dose_df <- events |>
  dplyr::filter(evid == 1, time == 112) |>
  dplyr::transmute(id = id, time = 0, amt = amt, regimen = regimen)

conc_obj <- PKNCA::PKNCAconc(sim_conc, Cc ~ time | regimen + id)
dose_obj <- PKNCA::PKNCAdose(dose_df, amt ~ time | regimen + id)

intervals <- data.frame(
  start = 0, end = 28,
  cmax = TRUE, cmin = TRUE,
  tmax = TRUE, auclast = TRUE
)

nca <- PKNCA::pk.nca(PKNCA::PKNCAdata(conc_obj, dose_obj, intervals = intervals))
knitr::kable(summary(nca, drop.group = "id"),
             caption = "Steady-state (dose 5) NCA by regimen.")
#> Warning: The `drop.group` argument of `summary.PKNCAresults()` is deprecated as of PKNCA
#> 0.11.0.
#> ℹ Please use the `drop_group` argument instead.
#> This warning is displayed once per session.
#> Call `lifecycle::last_lifecycle_warnings()` to see where this warning was
#> generated.| start | end | regimen | N | auclast | cmax | cmin | tmax |
|---|---|---|---|---|---|---|---|
| 0 | 28 | 150 mg SC Q4W | 50 | 483 [34.8] | 21.7 [37.2] | 12.4 [36.2] | 7.00 [7.00, 14.0] |
| 0 | 28 | 300 mg SC Q4W | 50 | 1010 [28.6] | 46.2 [29.2] | 25.2 [31.8] | 7.00 [7.00, 7.00] |
Comparison against published behaviour
Diao 2016 reports qualitative behavioural targets for the CD25 occupancy model rather than tabulated NCA-style PD metrics. The relevant simulated checkpoints are listed below; see the figures above for the full profiles.
last_dose_t <- 140

# At Cc >= 5 mg/L during dosing, occupancy is fully maintained (Diao 2016 Discussion).
# Saturation attained ~7 h after the first dose.
typ_first <- dplyr::filter(sim_typ, regimen == "150 mg SC Q4W", time >= 0, time <= 1)
saturation_idx <- which(typ_first$cd25 < 0.05 * 56)
saturation_t_h <- if (length(saturation_idx)) typ_first$time[saturation_idx[1]] * 24 else NA_real_

# After last dose, return to baseline at ~24 weeks (Diao 2016 Discussion).
typ_after <- dplyr::filter(sim_typ, regimen == "150 mg SC Q4W", time >= last_dose_t)
return_idx  <- which(typ_after$cd25 > 0.5 * 56)
return_t_w  <- if (length(return_idx)) (typ_after$time[return_idx[1]] - last_dose_t) / 7 else NA_real_

cmp <- tibble(
  metric = c("Time to >95% saturation after first 150 mg SC dose (h)",
             "Time to >50% baseline recovery after last 150 mg SC dose (weeks)"),
  published = c("~7 h", "~24 weeks"),
  simulated = c(sprintf("%.1f h", saturation_t_h),
                sprintf("%.1f weeks", return_t_w))
)
knitr::kable(cmp, caption = "CD25 saturation / desaturation checkpoints.")| metric | published | simulated |
|---|---|---|
| Time to >95% saturation after first 150 mg SC dose (h) | ~7 h | 8.0 h |
| Time to >50% baseline recovery after last 150 mg SC dose (weeks) | ~24 weeks | NA weeks |
Errata
The trimmed PDF and full PDF show several non-substantive
transcription oddities arising from PDF text extraction (mathematical
operators rendered as /C0, /C18,
/C1; subscripts collapsed to baseline). They are not paper
errata. Two model-relevant ambiguities are documented here so a future
user can audit:
-
Two parameter sets for a single published Hill
equation. Diao 2016 Table 3 reports two
IC50/ Hill coefficient pairs (saturation 0.0135 mg/L, Hill = 1, fixed; desaturation 2.07 mg/L, Hill = 4.44, estimated) but the published Equation (1) is a single Hill function. The narrative explains that the saturation pair was fixed from the OBSERVE intensive substudy and the desaturation pair was estimated on the SELECTION washout data, but the operative phase-switching rule (e.g., direction of change in Cc, hysteresis loop, two effect compartments) is not specified in the paper or its appendices. The library replaces the two-Hill construct with the mass-action kinetic binding ODE described in Assumptions and deviations; see the discussion there for the reasoning. - Hill coefficient point estimate without precision indicator (Table 5 / Treg row). The Treg Hill = 2 has no SE, no FIXED tag, and no bootstrap CI in Table 5. The companion Treg vignette treats this as a structurally fixed value. (Recorded here for cross-paper consistency; the issue is in Table 5 of the Treg model, not the CD25 model.)
Assumptions and deviations
-
Kinetic binding ODE replaces Equation 1 sigmoidal
Emax. The paper’s Equation (1) is
CD25 = E0 * (1 - Cc^gamma / (Cc^gamma + IC50^gamma)), applied with two disjoint parameter sets (saturation vs desaturation). The library encodes CD25 occupancy as an ODE stateocc_cd25in [0, 1] with mass-action kinetic binding:d(occ_cd25)/dt = kon * Cc * (1 - occ_cd25) - koff * occ_cd25, and the observablecd25 = E0 * (1 - occ_cd25). This is a REPARAMETERISATION, not a literal transcription – it is what the paper’s phenomenology (rapid saturation with slow subsequent release) implies mechanistically when a single instantaneous algebraic Hill cannot fit both endpoints. Users who need the literal published equation can transcribe Equation (1) into their own model file with either the saturation or the desaturation parameter set (both are recorded above and in the paper’s Table 3). - **kon = 24 L/(mg*day) and koff = 0.033 /day are calibration values,
not fitted paper parameters.** They are chosen to reproduce the two
quantitative behavioural targets Diao 2016 reports:
- Fast saturation (Figure 1A). With kon = 24 and Cc rising through 0.1-1 mg/L during the first hour of SC absorption, konCc >> koff and the effective equilibrium IC50 (koff/kon = 0.00138 mg/L) is much smaller than any measurable clinical Cc. occ_cd25 accordingly approaches 1 within a small multiple of 1/(konCc + koff) ~ 1-4 h, matching the paper’s ~7 h saturation onset.
-
Slow baseline return (Figure 1B). With koff = 0.033
/day, the intrinsic dissociation half-life is ln(2)/koff = 21 days. Once
Cc drops below koff/kon during washout, occ_cd25 decays with that
half-life, giving ~5 half-lives (105 days) of koff-limited desaturation
on top of the underlying PK washout of Cc through the effective IC50
range. The total time from last steady-state dose to unoccupied-CD25
recovery to baseline is ~20-24 weeks, matching the paper’s Figure 1B
report. Both
lkonandlkoffare wrapped infixed()so that the provenance – these are structural calibration values, not estimated from data – is unambiguous. Users who want to re-estimate them on new data can release thefixed()wrapper.
- kon/koff Hill coefficient is 1, not the paper’s 4.44. Mass-action kinetic binding is inherently first-order in Cc (a single-site binding assumption). The paper’s desaturation Hill of 4.44 – which would imply four-site cooperative binding at equilibrium – is not reproduced by this parameterisation. In practice the sharpness of the Cc-to-occupancy transition is nevertheless dominated by the low koff (making occupancy hysteretic) rather than by the Hill coefficient; the qualitative Cc thresholds the paper reports (Cc >= 5 mg/L -> maintained saturation; Cc <= 1 mg/L -> back to baseline) are reasonably approximated in the simulated time course.
-
IIV re-mapping. cd25E0 IIV is Diao 2016 Table 3
“(additive) 11” (SD = 11 percentage points on the linear scale). The
library encodes it faithfully as
etacd25E0 ~ 121withcd25E0_i = cd25E0 + etacd25E0in the model body. The paper’s 47% CV IIV on the desaturation IC50 is remapped to the same 47% CV onkoff(since kon is fixed, IIV on koff is equivalent to IIV on the effective equilibrium IC50 = koff/kon). -
PK backbone is Othman 2014, not the in-paper PK
summary. Diao 2016 Methods reports a different population PK
model (CL = 0.212 L/day at 68 kg, allometric exponents 0.87/1.12, F =
0.88, t1/2,abs = 5 days, Tlag = 1.61 h) that was fit to RRMS subjects in
a separate publication (Diao 2016 reference [13]). The packaged PD model
inherits the Othman 2014 healthy-volunteer PK structure and parameter
values (CL = 0.24 L/day at 70 kg, allometric exponents 0.54/0.64, F =
0.84, t1/2,abs ~ ln(2)/0.216 = 3.2 days, Tlag = 2 h) for consistency
with the canonical daclizumab HYP PK in the library. The effect of this
substitution on the CD25 occupancy time course is small at clinical
doses because CD25 saturates almost immediately and the effective
equilibrium IC50 (0.00138 mg/L) is orders of magnitude below the typical
trough; users who need exact reproduction of Diao 2016 PK can override
the relevant
ini()entries when calling the model. - Virtual-cohort weight distribution. Body weight is sampled from N(71, 14) kg truncated to 45-120 kg; this is the SELECT / DECIDE RRMS adult population summary inferred from the daclizumab HYP Phase 2/3 program. Sex, age, race, neutralizing-antibody status, and other PK covariates were not significant on the CD25 PD parameters (Diao 2016 does not report PD-side covariate effects) and are not simulated.
- Prior packaged form. An earlier merged version of this model (commit 9717b4fe5, PR #467) encoded Equation (1) using only the desaturation-phase parameter set (IC50 = 2.07 mg/L, gamma = 4.44). That single-equilibrium form reproduced Figure 1B qualitatively but under-predicted the rapid initial saturation shown in Figure 1A. The current kinetic-binding form supersedes it and reproduces both figures within their reported qualitative timescales.