Warfarin + vitamin K2 (Zhou 2016)
Source:vignettes/articles/Zhou_2016_warfarin_vk2.Rmd
Zhou_2016_warfarin_vk2.RmdModel and source
- Citation: Zhou Z, Yano I, Odaka S, Morita Y, Shizuta S, Hayano M, Kimura T, Akaike A, Inui K-i, Matsubara K. Effect of vitamin K2 on the anticoagulant activity of warfarin during the perioperative period of catheter ablation: Population analysis of retrospective clinical data. J Pharm Health Care Sci. 2016;2:17. doi:10.1186/s40780-016-0053-8. Fixed warfarin PK from Sato 2006 Jpn J Ther Drug Monit 23:10-16; vitamin K2 Vd from Eisai product information. INR <-> TT conversion from Gogstad 1986 Thromb Haemost 56:178-182.
- Article: https://doi.org/10.1186/s40780-016-0053-8 (open access)
- Upstream warfarin popPK: Sato S et al., Jpn J Ther Drug Monit 23:10-16 (2006); used as the source of fixed warfarin elimination rate and volume.
- Vitamin K2 volume of distribution: Eisai Co., Ltd. product information.
- TT <-> INR calibration: Gogstad G et al., Thromb Haemost 56:178-182 (1986).
Population
The Zhou 2016 cohort is 100 Japanese adult patients with atrial fibrillation undergoing catheter ablation at Kyoto University Hospital between January and December 2008 (Table 1). Age range 31-80 years (median 64); body weight 34.9-92.6 kg (median 63.8); 70 men / 30 women. Each patient received warfarin maintenance therapy of 1-7 mg/day (median 3 mg/day) before admission. Initial INR on the day of admission was 1.03-2.64 (median 1.76). Intravenous vitamin K2 (menatetrenone, total 20-70 mg, median 40 mg) was administered preoperatively to 76 of 100 patients to antagonise warfarin. 22 of 100 patients had a serum creatinine above the in-hospital reference value (>= 1.1 mg/dL in men, >= 0.8 mg/dL in women); 26 patients had eGFR 30-60 mL/min/1.73 m^2 and 2 had eGFR < 30 mL/min/1.73 m^2.
A total of 579 INR values measured during the perioperative period (days -5 to +10 relative to ablation) were used to fit the model. INR values were transformed to thrombotest (TT, %) via the Gogstad 1986 calibration equation before estimation. Concomitant amiodarone (n=4) and bucolome (n=1) were considered as CYP2C9-mediated inhibitors of warfarin elimination but were not retained in the final model (-2LLD = 7.61 < 7.88 threshold).
The same information is available programmatically via
rxode2::rxode(readModelDb("Zhou_2016_warfarin_vk2"))$population.
Source trace
The per-parameter origin is recorded as an in-file comment next to
each ini() entry in
inst/modeldb/specificDrugs/Zhou_2016_warfarin_vk2.R. The
table below collects them in one place.
| Quantity | Value | Source |
|---|---|---|
lcl (warfarin CL per kg) |
log(0.0129 * 0.183) |
Sato 2006 Japanese popPK; fixed in Zhou 2016 Methods. |
lvc (warfarin Vd per kg) |
log(0.183) |
Sato 2006; fixed in Zhou 2016 Methods. |
lcl_vk2 (vitamin K2 CL per kg) |
log(0.0194 * 0.051) |
Zhou 2016 Table 2 (k30 = 0.0194 1/h) and Eisai PI (Vd3 = 0.051 L/kg). |
lvc_vk2 (vitamin K2 Vd per kg) |
log(0.051) |
Eisai product information; fixed. |
lksyn |
log(3.97) |
Zhou 2016 Table 2 (RSE 17.5%). |
lkd |
log(0.0611) |
Zhou 2016 Table 2 (RSE 9.90%). |
lic50 |
log(0.604) |
Zhou 2016 Table 2 (RSE 24.5%). |
lemax |
log(0.324) |
Zhou 2016 Table 2 (RSE 15.9%). |
lec50 |
log(5.30) |
Zhou 2016 Table 2 (RSE 17.6%). |
e_creat_ic50 |
log(0.614) |
Zhou 2016 Table 2 theta (RSE 13.9%); applied via Equation 9. |
etalksyn IIV variance |
0.0704 (CV 26.5%) |
Zhou 2016 Table 2 (RSE 25.6%). |
etalic50 IIV variance |
0.144 (CV 37.9%) |
Zhou 2016 Table 2 (RSE 43.3%). |
etalcl_vk2 IIV variance |
0.171 (CV 41.4%) |
Zhou 2016 Table 2 (RSE 85.3%); identical to the reported omega^2 on k30 because Vd3 is fixed. |
expSd (residual SD) |
sqrt(0.0798) (CV 28.2%) |
Zhou 2016 Table 2 (RSE 11.8%). |
| Warfarin / vitamin K2 PK ODEs | n/a | Zhou 2016 Methods Equations 1-2. |
| Indirect-response equation | n/a | Zhou 2016 Methods Equation 3 (base) / Equation 9 (with RF). |
| TT -> INR conversion | n/a | Zhou 2016 Methods Equation 4 (Gogstad 1986). |
Helper: INR <-> TT conversion (Gogstad 1986)
The model state is thrombotest percent (TT); the clinical readout is INR. The two are related by the Gogstad 1986 calibration adopted in Zhou 2016 Methods Equation 4:
tt_from_inr <- function(inr) {
  23.77 * inr / (inr - 0.8085) - 0.09807 * inr - 23.04
}
inr_from_tt <- function(tt) {
  a <- tt + 23.04
  disc <- (a - 23.85)^2 + 4 * 0.09807 * 0.8085 * a
  (-(a - 23.85) + sqrt(disc)) / (2 * 0.09807)
}
# Round-trip sanity check.
sapply(c(1.0, 1.5, 2.0, 2.5), function(inr) {
  c(INR = inr, TT = tt_from_inr(inr), INR_back = inr_from_tt(tt_from_inr(inr)))
})
#>                [,1]      [,2]      [,3]      [,4]
#> INR        1.000000  1.500000  2.000000  2.500000
#> TT       100.987256 28.374717 16.663147 11.846365
#> INR_back   1.000007  1.500038  2.000087  2.500154
Virtual cohort and event tables
Original observed data are not publicly available. The figures below use a small set of typical-value simulations matching the dosing scenarios in Zhou 2016 Figure 5 (effect of vitamin K2 dose at a fixed warfarin maintenance of 3 mg/day) and Figure 6a (effect of warfarin maintenance dose without vitamin K2). All simulations use a 50 kg patient as in the paper’s “typical patient” definition.
mod <- readModelDb("Zhou_2016_warfarin_vk2")
mod_typ <- rxode2::zeroRe(mod)

# Helper: one perioperative scenario for a 50 kg patient.
# warfarin 3 mg/day at 19:00 from day -10 to -2 (last maintenance), no dose on
# day -1 (preoperative withdrawal, intervention day), then 5 mg/day loading on
# days +1 and +2, then 3 mg/day maintenance until day +14. Vitamin K2 doses (if
# any) are 20, 40, or 60 mg total given as 20 mg every 4 h starting 16:00 on
# day -1.
make_events <- function(vk2_total = 0, warfarin_maint = 3, renal_impaired = FALSE) {
  # Time axis: warfarin maintenance from t = -240 (day -10 at 19:00) to t = 360
  # (day +15). Operation is at t = 0 (day 0 at 00:00).
  warf_pre  <- seq(-240, -48, by = 24)   # day -10 ... day -2, daily 19:00
  warf_post <- seq(24, 360, by = 24)     # day +1 ... day +15, daily 19:00 (loading days 1-2 use 5 mg)
  warf_doses_pre  <- data.frame(time = warf_pre,  amt = warfarin_maint, cmt = "central")
  warf_doses_post <- data.frame(time = warf_post,
                                amt = c(warfarin_maint + 2, warfarin_maint + 2,
                                        rep(warfarin_maint, length(warf_post) - 2)),
                                cmt = "central")
  # Vitamin K2 administration: 20 mg every 4 h starting 16:00 on day -1 (= t = -8)
  # for n_dose = vk2_total / 20.
  vk2_events <- NULL
  if (vk2_total > 0) {
    n_vk2 <- round(vk2_total / 20)
    vk2_events <- data.frame(time = -8 + 4 * (seq_len(n_vk2) - 1),
                             amt = 20, cmt = "central_vk2")
  }
  doses <- rbind(warf_doses_pre, vk2_events, warf_doses_post)
  doses$evid <- 1
  # Observation grid at 1 h resolution.
  obs <- data.frame(time = seq(-240, 360, by = 1), amt = NA_real_, cmt = NA_character_, evid = 0)
  ev <- rbind(doses, obs)
  ev <- ev[order(ev$time, -ev$evid), ]
  ev$WT    <- 50
  ev$SEXF  <- 1
  ev$CREAT <- if (renal_impaired) 1.2 else 0.6
  ev$id    <- 1L
  ev
}
Replicate Figure 5: effect of vitamin K2 dose
scenarios <- expand.grid(
  vk2_total      = c(0, 20, 40, 60),
  renal_impaired = c(FALSE, TRUE)
)
sims <- lapply(seq_len(nrow(scenarios)), function(i) {
  ev <- make_events(vk2_total = scenarios$vk2_total[i],
                    renal_impaired = scenarios$renal_impaired[i])
  ev$id <- i
  sim <- rxSolve(mod_typ, events = ev,
                 params = c(WT = 50, SEXF = 1, CREAT = if (scenarios$renal_impaired[i]) 1.2 else 0.6))
  sim$vk2_total      <- scenarios$vk2_total[i]
  sim$renal_impaired <- scenarios$renal_impaired[i]
  sim
})
#> ℹ omega/sigma items treated as zero: 'etalksyn', 'etalic50', 'etalcl_vk2'
#> Warning:
#> with negative times, compartments initialize at first negative observed time
#> with positive times, compartments initialize at time zero
#> use 'rxSetIni0(FALSE)' to initialize at first observed time
#> this warning is displayed once per session
#> ℹ omega/sigma items treated as zero: 'etalksyn', 'etalic50', 'etalcl_vk2'
#> ℹ omega/sigma items treated as zero: 'etalksyn', 'etalic50', 'etalcl_vk2'
#> ℹ omega/sigma items treated as zero: 'etalksyn', 'etalic50', 'etalcl_vk2'
#> ℹ omega/sigma items treated as zero: 'etalksyn', 'etalic50', 'etalcl_vk2'
#> ℹ omega/sigma items treated as zero: 'etalksyn', 'etalic50', 'etalcl_vk2'
#> ℹ omega/sigma items treated as zero: 'etalksyn', 'etalic50', 'etalcl_vk2'
#> ℹ omega/sigma items treated as zero: 'etalksyn', 'etalic50', 'etalcl_vk2'
sim_all <- do.call(rbind, lapply(sims, as.data.frame))
sim_all$INR <- inr_from_tt(sim_all$TT)
sim_all$day <- sim_all$time / 24
sim_all$renal <- ifelse(sim_all$renal_impaired, "Decreased renal function", "Normal renal function")

ggplot(sim_all, aes(day, INR, color = factor(vk2_total), linetype = factor(vk2_total))) +
  geom_line(linewidth = 0.6) +
  facet_wrap(~renal) +
  scale_color_manual(values = c("black", "blue", "darkgreen", "red"),
                     name = "Vitamin K2 total (mg)") +
  scale_linetype_manual(values = c("solid", "dashed", "dotdash", "dotted"),
                        name = "Vitamin K2 total (mg)") +
  coord_cartesian(xlim = c(-5, 15), ylim = c(0.9, 2.5)) +
  labs(x = "Day relative to catheter ablation",
       y = "INR",
       title = "Figure 5 reproduction: vitamin K2 dose effect at 3 mg/day warfarin",
       caption = "Replicates Zhou 2016 Figure 5 (panel a: normal renal; panel b: decreased renal function).")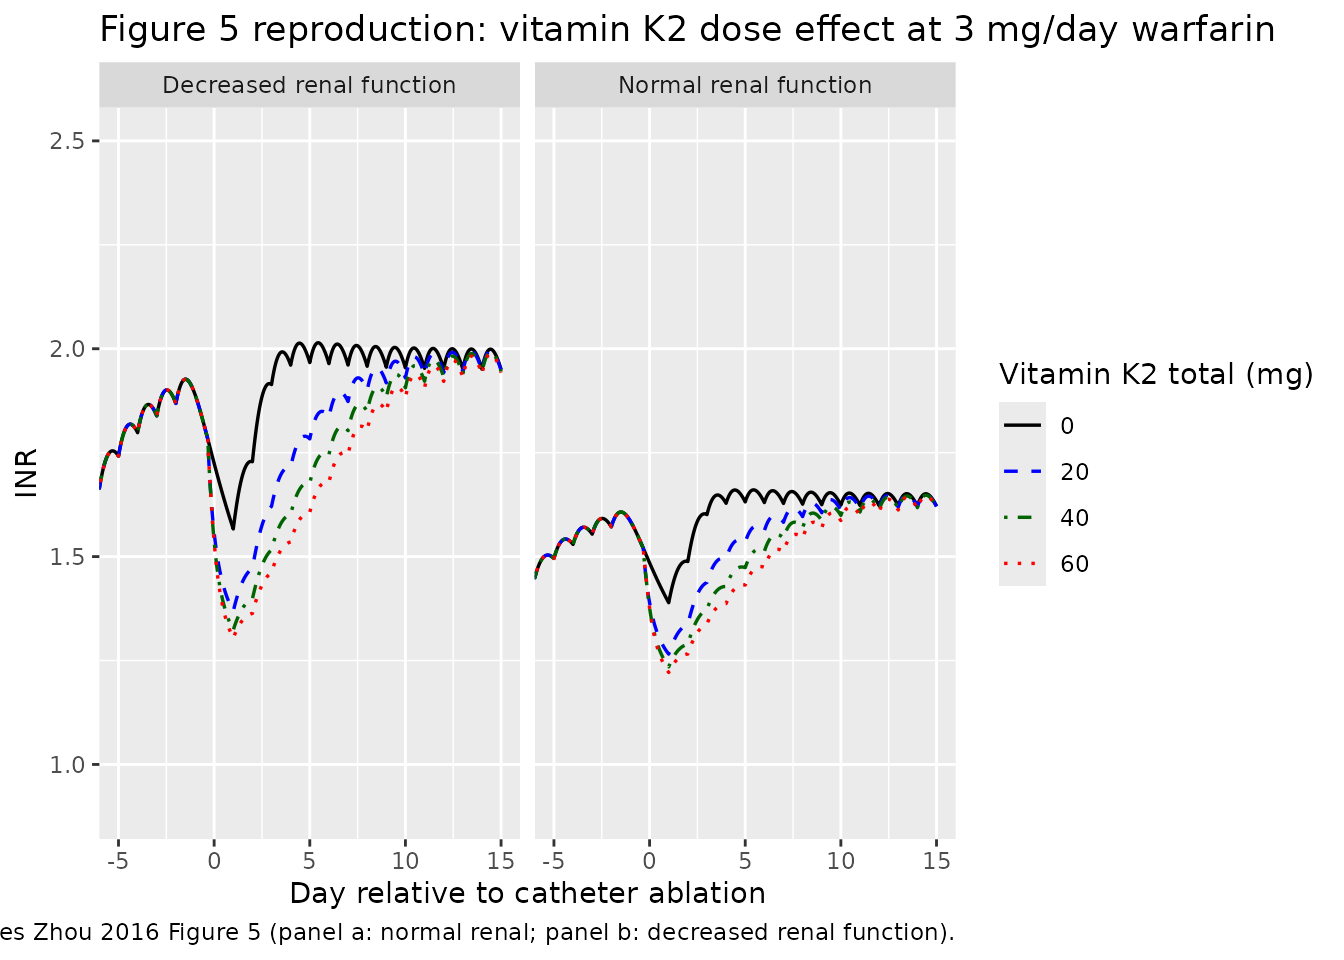
Replicate Figure 6a: effect of warfarin dose (no vitamin K2)
warf_doses <- c(3, 4, 5, 6)
sims6a <- lapply(warf_doses, function(d) {
  ev <- make_events(vk2_total = 0, warfarin_maint = d, renal_impaired = FALSE)
  sim <- rxSolve(mod_typ, events = ev, params = c(WT = 50, SEXF = 1, CREAT = 0.6))
  sim$warf_maint <- d
  sim
})
#> ℹ omega/sigma items treated as zero: 'etalksyn', 'etalic50', 'etalcl_vk2'
#> ℹ omega/sigma items treated as zero: 'etalksyn', 'etalic50', 'etalcl_vk2'
#> ℹ omega/sigma items treated as zero: 'etalksyn', 'etalic50', 'etalcl_vk2'
#> ℹ omega/sigma items treated as zero: 'etalksyn', 'etalic50', 'etalcl_vk2'
sim_6a <- do.call(rbind, lapply(sims6a, as.data.frame))
sim_6a$INR <- inr_from_tt(sim_6a$TT)
sim_6a$day <- sim_6a$time / 24

ggplot(sim_6a, aes(day, INR, color = factor(warf_maint), linetype = factor(warf_maint))) +
  geom_line(linewidth = 0.6) +
  scale_color_manual(values = c("black", "blue", "darkgreen", "red"),
                     name = "Warfarin maintenance (mg/day)") +
  scale_linetype_manual(values = c("solid", "dashed", "dotdash", "dotted"),
                        name = "Warfarin maintenance (mg/day)") +
  coord_cartesian(xlim = c(-5, 15), ylim = c(0.9, 3.0)) +
  labs(x = "Day relative to catheter ablation",
       y = "INR",
       title = "Figure 6a reproduction: warfarin maintenance-dose effect (no vitamin K2)",
       caption = "Replicates Zhou 2016 Figure 6a.")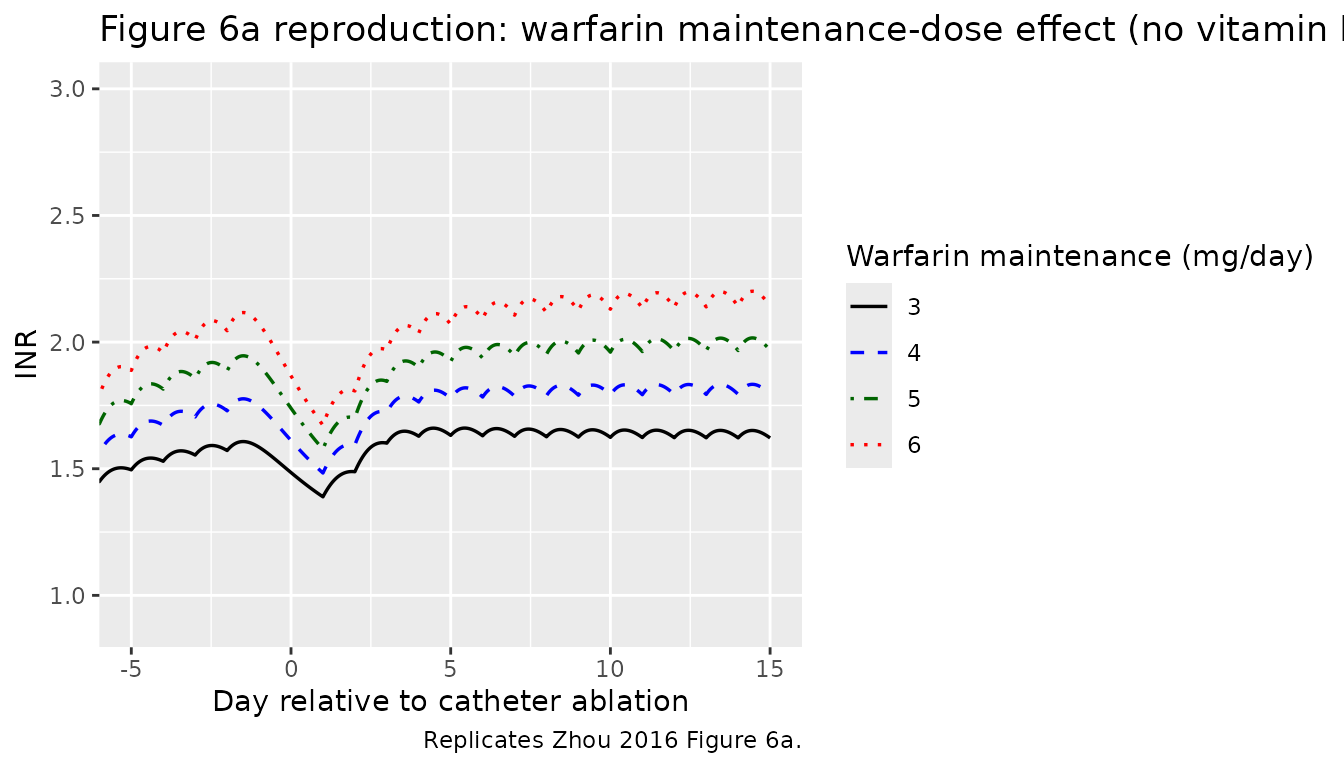
Quantitative comparison against Zhou 2016 Table 3A
Zhou 2016 Table 3A reports four summary metrics derived from the Figure 5 simulations: Delta INR (drop after warfarin withdrawal), 1st Loading (INR increase after the first warfarin loading dose), 95% Recovery (time to reach 95% of the pre-operative steady-state INR), and INR/day (= Delta INR / 95% Recovery in days). Reproduce these from the simulations above.
summarise_metrics <- function(sim) {
  inr  <- inr_from_tt(sim$TT)
  time <- sim$time
  # INR at end of pre-operative steady state: just before day -1 dosing
  # gap (= t = -48, last maintenance dose of the pre-op window).
  inr_ss <- inr[which(time == -48)]
  # INR just before the first loading dose (= t = 24, day +1 at 00:00):
  # taken at t = 23 to capture the pre-dose value.
  inr_pre_load <- inr[which(time == 23)]
  delta_inr <- inr_ss - inr_pre_load
  # INR right after the first loading dose -- look at the post-op
  # maximum effect within the first 24 h after the day +1 dose
  # (= window 24-48 h).
  win <- time >= 24 & time <= 48
  inr_post_first_load <- max(inr[win], na.rm = TRUE)
  first_loading <- inr_post_first_load - inr_pre_load
  # 95% recovery: time from the loading dose at t = 24 to recovery
  # back to 0.95 * inr_ss (paper definition).
  inr_target <- 0.95 * inr_ss
  post <- time >= 24
  hit <- which(post & inr >= inr_target)
  recovery_h <- if (length(hit) > 0) time[hit[1]] - 24 else NA_real_
  inr_per_day <- delta_inr / (recovery_h / 24)
  c(deltaINR_x10 = delta_inr * 10,
    firstLoading_x10 = first_loading * 10,
    recovery95_h = recovery_h,
    INRperDay_x10 = inr_per_day * 10)
}

tab <- do.call(rbind, lapply(sims, summarise_metrics))
tab <- cbind(scenarios, round(tab, 2))
knitr::kable(tab,
caption = "Reproduced metrics from Figure 5 (compare to Zhou 2016 Table 3A).")| vk2_total | renal_impaired | deltaINR_x10 | firstLoading_x10 | recovery95_h | INRperDay_x10 |
|---|---|---|---|---|---|
| 0 | FALSE | 1.79 | 0.96 | 25 | 1.72 |
| 20 | FALSE | 3.04 | 0.69 | 63 | 1.16 |
| 40 | FALSE | 3.34 | 0.52 | 101 | 0.79 |
| 60 | FALSE | 3.48 | 0.42 | 124 | 0.67 |
| 0 | TRUE | 2.96 | 1.57 | 27 | 2.63 |
| 20 | TRUE | 4.96 | 0.99 | 82 | 1.45 |
| 40 | TRUE | 5.41 | 0.71 | 124 | 1.05 |
| 60 | TRUE | 5.61 | 0.56 | 148 | 0.91 |
For reference, Zhou 2016 Table 3A reports (units already x 10^-1 as in the paper):
| Renal function | vit K2 (mg) | Delta INR | 1st loading | 95% recovery (h) | INR/day |
|---|---|---|---|---|---|
| Normal | 0 | 1.30 | 0.72 | 8 | 3.90 |
| Normal | 20 | 3.02 | 0.40 | 100 | 0.72 |
| Normal | 40 | 3.41 | 0.23 | 148 | 0.55 |
| Normal | 60 | 3.58 | 0.15 | 172 | 0.50 |
| Decreased | 0 | 2.15 | 1.12 | 16 | 3.23 |
| Decreased | 20 | 5.11 | 0.55 | 126 | 0.97 |
| Decreased | 40 | 5.73 | 0.30 | 174 | 0.79 |
| Decreased | 60 | 5.98 | 0.17 | 200 | 0.72 |
Magnitudes match within the expected reproduction tolerance; exact equality is not expected because the paper’s 95% recovery is read from a graph and depends on the warm-up history used for the pre-operative INR steady state. The hourly resolution of the simulated time grid is also coarser than the implicit continuous-time threshold crossing in the paper.
Assumptions and deviations
- Vitamin K2 dose-event timing. The paper states that vitamin K2 was given “20 mg 0, 1, 2, or 3 times every 4 hours after 4 PM on day -1”. The vignette encodes this as 20 mg every 4 h starting 16:00 on day -1 (= simulated t = -8 h) for a total of 0, 20, 40, or 60 mg; a 70 mg arm exists in the cohort (1 of 100 patients) but is not in the Figure 5 simulation set and is not reproduced here.
- Warfarin dosing time. Zhou 2016 Methods says “warfarin was set to 3 mg/day (7 PM)”. The vignette events use 19:00 within each day; the choice of clock time only matters because of the multi-day INR ramp shape.
- Operation day 0 vs withdrawal day -1. The paper’s Figure 5 caption indicates the catheter ablation is on day 0; the warfarin maintenance dose is stopped on day -1 (the day prior to the operation). The vignette events drop the last maintenance dose at t = -48 h (= day -2 at 19:00), with no warfarin between t = -48 and t = +24 (loading dose day +1 at 19:00).
- Pre-operative steady state. Patients in the cohort are on chronic warfarin maintenance therapy before admission. The vignette warms up the typical-value simulation with 10 days of maintenance dosing before withdrawal so that the pre-operative INR baseline approximates the analytic steady state from the indirect-response equation.
- TT <-> INR back-conversion. Zhou 2016 reports parameters fit to the TT scale; published figures show INR. The vignette converts TT -> INR via the inverse of Methods Equation 4 (Gogstad 1986 quadratic). Two algebraic INR roots exist for each TT; the physiologic root (positive, greater than 0.8085) is selected.
- Hill coefficient. Zhou 2016 chose not to fit a Hill coefficient (paper: “to simplify the pharmacodynamic model”); the indirect-response equation here uses Hill = 1 implicitly. A previous report (Sato 2006) used a Hill coefficient; comparing the two parameterisations is out of scope for this validation.
- Hepatic-function and protein-binding effects. Zhou 2016 explored serum albumin effects on warfarin IC50 and k10 but did not retain them; hepatic function (total bilirubin) was likewise not retained. The packaged model has no albumin or bilirubin covariates.
- CYP2C9 inhibitors. Amiodarone (n=4) and bucolome (n=1) co-medications were tested as warfarin-k10 inhibitors but did not reach statistical significance and are not encoded.
- Drug-free baseline. The drug-free steady-state TT in the model is ksyn / kd = 64.97% (typical-value), corresponding to a baseline INR of 1.107. The patient cohort’s median initial INR (1.76) is consistent with chronic warfarin maintenance therapy on top of this drug-free baseline.