Schoenmakers_2025_betamethasone
Source:vignettes/articles/Schoenmakers_2025_betamethasone.Rmd
Schoenmakers_2025_betamethasone.RmdModel and source
- Citation: Schoenmakers S, Li L, Kluivers ACM, Broekhuizen M, Harhangi MS, Ronde E, DeKoninck PLJ, Reiss I, Danser AHJ, Allegaert K, van den Berg SAA, van Zelst BD, van Schaik RHN, Simons SHP, Koch BCP, Sassen SDT. (2025). Pharmacokinetics of betamethasone in pre-eclampsia: An in vivo and ex vivo study. Br J Clin Pharmacol 91(11):2327-2339. doi:10.1002/bcp.70035.
- Description: Two-compartment population PK model with first-order absorption (no lag time) for intramuscular betamethasone in pregnant women admitted with imminent preterm birth, including early-onset pre-eclampsia (eoPE; diagnosed before 34 weeks gestation). Apparent clearance is multiplied by 0.617 (a 38% reduction, or ~60% of the non-eoPE clearance) when eoPE is present; this is the only retained covariate after backward elimination at P < 0.01. Body weight, BMI, lean body weight, age, gestational age, number of foetuses, white blood cell counts and CRP were screened but did not retain after backward elimination.
- Article: https://doi.org/10.1002/bcp.70035
Population
The model was developed from 28 pregnant women admitted with imminent preterm birth at the Department of Obstetrics, Erasmus University Medical Center Rotterdam (Netherlands), between January and October 2021 (Schoenmakers 2025 Methods, “Study design” paragraph; Table 1). Subjects contributed 194 maternal serum samples for the popPK analysis after exclusion of 8 samples flagged as potential sampling-time errors. The cohort splits into 23 women without pre-eclampsia and 5 women with early-onset pre-eclampsia (eoPE; pre-eclampsia diagnosed before 34 weeks gestation).
Baseline demographics from Schoenmakers 2025 Table 1: age median 31 years (range 21-41); gestational age at first betamethasone dose median 27+4 weeks (range 23+5 to 33+6); total body weight median 68 kg (range 50-121); lean body weight median 43.1 kg (range 34.1-58.6); BMI median 25.3 kg/m^2 (range 16.7-44). Two of the 28 pregnancies were twin pregnancies (both in the non-eoPE subgroup); the remaining 26 were singletons. Race / ethnicity was not tabulated, but the placental-experiments cohort (Table 3) lists North African, African, Caucasian, Turkish, and other ethnicities.
Each woman received Celestone Chronodose 11.4 mg intramuscular betamethasone (6 mg betamethasone sodium phosphate + 5.4 mg betamethasone acetate; an instant-release + depot-prodrug combination) once daily for 2 consecutive days. Serum was sampled pre-dose and at 0-0.5, 1-3, 5-8, 10-12, and 20-24 h after each of the two doses. Active betamethasone was quantified by LC-MS/MS (assay performance per Methods).
The same information is available programmatically via
readModelDb("Schoenmakers_2025_betamethasone")$population.
Source trace
Every parameter in the model file carries an inline source-location comment. The table below collects the entries in one place.
| Equation / parameter | Value | Source location |
|---|---|---|
| Two-compartment open model, first-order absorption (no lag), first-order elimination | n/a | Results, “Pharmacokinetic study population” paragraph; Methods 2.2 |
| Proportional residual error model | n/a | Methods 2.2 (“Proportional, additive and combined models were evaluated”); Results 3.1 |
| Forward inclusion P < 0.05 / backward elimination P < 0.01 covariate procedure | n/a | Methods 2.2 (“forward inclusion … backward elimination”) |
lka (typical absorption rate) |
1.67 1/h | Table 2 final-model row “Ka” |
lcl (CL/F, non-eoPE) |
15.6 L/h | Table 2 final-model row “Apparent clearance (CL/F; L/h)” |
lvc (Vc/F) |
46.1 L | Table 2 final-model row “Apparent volume of distribution in the central compartment (Vc/F; L)” |
lvp (Vp/F) |
109 L | Table 2 final-model row “Apparent volume of distribution in the peripheral compartment (Vp/F; L)” |
lq (Q/F) |
99.8 L/h | Table 2 final-model row “Apparent intercompartmental clearance (Q/F; L)” – the printed unit “L” is a typo; the parameter’s role as inter-compartmental clearance requires L/h |
e_eope_cl (log-multiplicative eoPE effect on CL) |
log(0.617) | Table 2 final-model row “ThetaPE on CL”; Eq 2 in Methods 2.2 |
| IIV-CL (% CV in paper) | 21.30% | Table 2 final-model row “IIV-CL (%)” |
| IIV-Vc (% CV in paper) | 89.50% | Table 2 final-model row “IIV-Vc (%)” |
| Residual variability | 0.224 | Table 2 final-model row “Residual variability” |
| Half-life (informational, not a fitted parameter) | 7.44 h | Table 2 final-model row “Half-life (h)” |
Virtual cohort
Original maternal-serum concentrations are not openly available. The virtual cohort below mirrors the paper’s two-stratum design (23 non-eoPE + 5 eoPE) scaled up for stable NCA statistics: 200 non-eoPE women + 200 eoPE women. The age, weight, and gestational-age distributions reflect the medians and ranges in Schoenmakers 2025 Table 1. Body weight does not enter the model equations (it was screened out at backward elimination), so the weight distribution is for reporting only and does not affect the simulated concentrations.
set.seed(20250211)

n_per_stratum <- 200L

make_stratum <- function(n, dis_eope, id_offset) {
  tibble(
    id   = id_offset + seq_len(n),
    DIS_EOPE = dis_eope,
    WT   = runif(n, 50, 95),
    AGE  = runif(n, 21, 41),
    GA   = runif(n, 24, 33)
  )
}

demo <- bind_rows(
  make_stratum(n_per_stratum, 0L, id_offset = 0L * n_per_stratum),
  make_stratum(n_per_stratum, 1L, id_offset = 1L * n_per_stratum)
)
stopifnot(!anyDuplicated(demo$id))
Simulation
The 2-dose regimen (11.4 mg IM at t = 0 h and t = 24 h) is simulated for each woman with dense sampling for NCA (Cmax, AUC0-24, AUC0-48, terminal half-life). The observation grid (every 0.5 h over 0-4 h and every 1 h thereafter to 72 h) is denser than the actual clinical sampling, so the simulated NCA does not suffer from sparse-sample bias.
obs_times <- sort(unique(c(seq(0,   4,   by = 0.25),
                           seq(4.5, 24,  by = 0.5),
                           seq(24,  72,  by = 1))))

build_events <- function(demo) {
  dose1 <- demo |>
    mutate(time = 0,
           amt  = 11.4,
           evid = 1L,
           cmt  = "depot") |>
    select(id, time, amt, evid, cmt, DIS_EOPE, WT, AGE, GA)

  dose2 <- demo |>
    mutate(time = 24,
           amt  = 11.4,
           evid = 1L,
           cmt  = "depot") |>
    select(id, time, amt, evid, cmt, DIS_EOPE, WT, AGE, GA)

  obs <- demo |>
    select(id, DIS_EOPE, WT, AGE, GA) |>
    tidyr::crossing(time = obs_times) |>
    mutate(amt  = NA_real_,
           evid = 0L,
           cmt  = NA_character_)

  bind_rows(dose1, dose2, obs) |>
    arrange(id, time, desc(evid))
}

events <- build_events(demo)
mod <- rxode2::rxode2(readModelDb("Schoenmakers_2025_betamethasone"))
#> ℹ parameter labels from comments will be replaced by 'label()'

sim <- rxode2::rxSolve(
  mod, events = events,
  keep = c("DIS_EOPE", "WT", "AGE", "GA")
) |> as.data.frame()

mod_typical <- mod |> rxode2::zeroRe()
sim_typical <- rxode2::rxSolve(
  mod_typical, events = events,
  keep = c("DIS_EOPE", "WT", "AGE", "GA")
) |> as.data.frame()
#> ℹ omega/sigma items treated as zero: 'etalcl', 'etalvc'
#> Warning: multi-subject simulation without without 'omega'
Replicate published figures
Figure 3 – typical-value betamethasone exposure with vs without eoPE
Schoenmakers 2025 Figure 3 simulates 2 doses of 11.4 mg IM betamethasone q24h in a “standard patient” with vs without eoPE and plots the typical- value concentration profile over time. The replication below uses the zero-random-effect typical-value model for one non-eoPE and one eoPE patient at the cohort-median weight (68 kg).
typical_demo <- tibble::tibble(
  id   = 1:2,
  DIS_EOPE = c(0L, 1L),
  WT   = 68,
  AGE  = 31,
  GA   = 27
)
typical_events <- build_events(typical_demo)

typical_sim <- rxode2::rxSolve(
  mod_typical, events = typical_events,
  keep = c("DIS_EOPE")
) |>
  as.data.frame() |>
  mutate(stratum = ifelse(DIS_EOPE == 1, "eoPE", "w/o eoPE"),
         Cc_ugL  = Cc * 1000)  # mg/L -> ug/L
#> ℹ omega/sigma items treated as zero: 'etalcl', 'etalvc'
#> Warning: multi-subject simulation without without 'omega'

ggplot(typical_sim, aes(time, Cc_ugL, colour = stratum)) +
  geom_line(linewidth = 1) +
  scale_colour_manual(values = c("w/o eoPE" = "#CC3311",
                                 "eoPE"     = "#0077BB")) +
  labs(x = "Time after first dose (h)",
       y = "Betamethasone (ug/L)",
       colour = NULL,
       title = "Schoenmakers 2025 Figure 3 replication") +
  theme_minimal()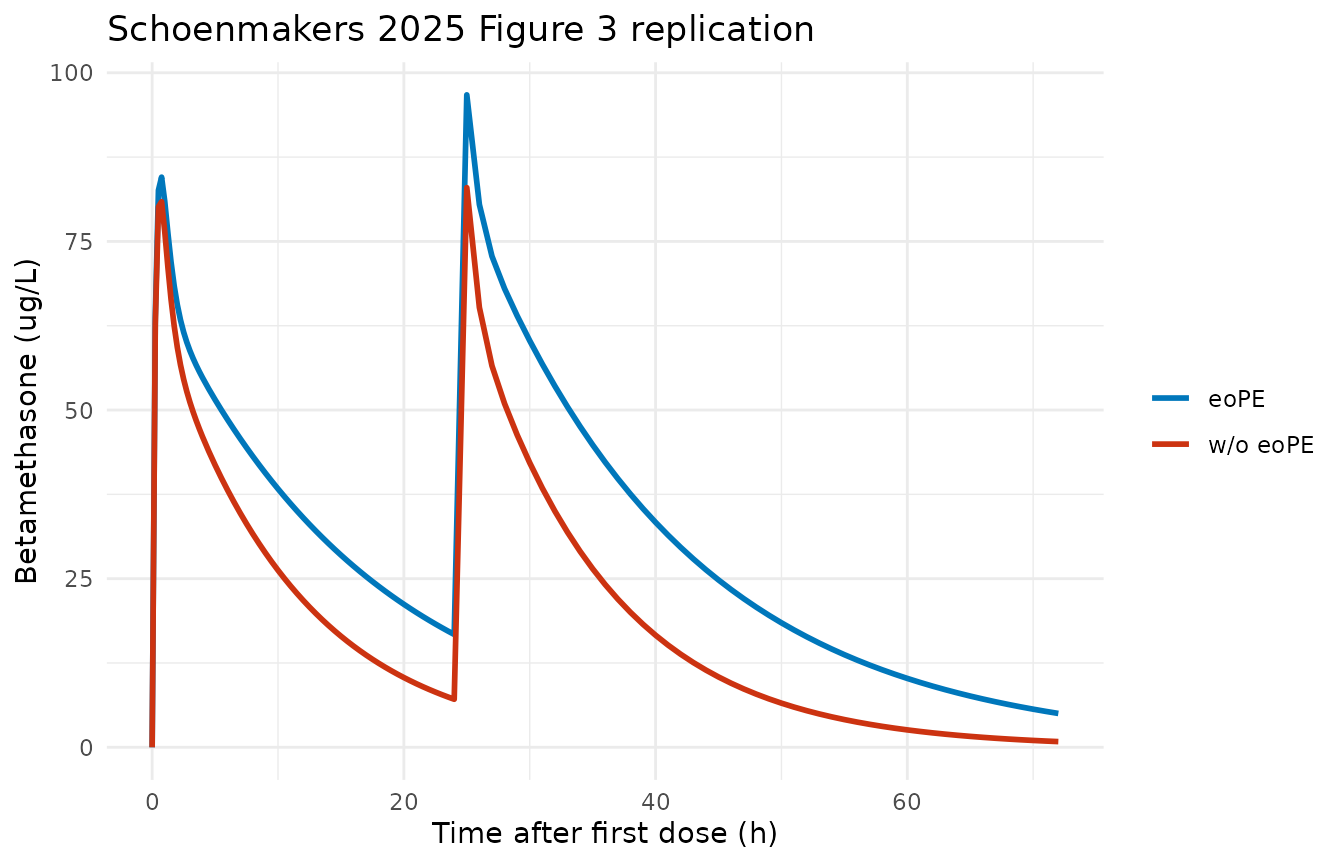
Replicates Figure 3 of Schoenmakers 2025: typical-value betamethasone serum concentration after two 11.4 mg IM doses (q24h) for non-eoPE (red) vs eoPE (blue). Concentrations plotted in ug/L (= ng/mL = mg/L x 1000).
Figure 2 (VPC) replication is omitted
Figure 2 in Schoenmakers 2025 is a visual predictive check against the original 194 maternal serum samples (with vs without eoPE strata). Reproducing it requires the original observation dataset, which is not openly available. The typical-value Figure 3 replication above is the faithful structural-model unit-test.
PKNCA validation
PKNCA computes Cmax, Tmax, AUC0-24, AUC0-48, and apparent terminal half- life on the simulated stochastic cohort, stratified by eoPE. Simulated medians are then compared against the published NCA-summary values quoted in Schoenmakers 2025 Figure 1 caption (AUC0-24h medians by stratum and individual EBE CL medians by stratum) and the abstract (AUC0-inf medians by stratum).
nca_window <- sim |>
  filter(!is.na(Cc), time <= 72) |>
  mutate(stratum = ifelse(DIS_EOPE == 1, "eoPE", "w/o eoPE"),
         Cc_ugL  = Cc * 1000) |>
  select(id, time, Cc_ugL, stratum)

dose_df <- demo |>
  mutate(stratum = ifelse(DIS_EOPE == 1, "eoPE", "w/o eoPE")) |>
  select(id, stratum) |>
  tidyr::crossing(time = c(0, 24)) |>
  mutate(amt = 11.4)

conc_obj <- PKNCA::PKNCAconc(nca_window, Cc_ugL ~ time | stratum + id)
dose_obj <- PKNCA::PKNCAdose(dose_df,    amt   ~ time | stratum + id)

intervals <- data.frame(
  start      = c(0,  0),
  end        = c(24, 48),
  cmax       = c(TRUE,  TRUE),
  tmax       = c(TRUE,  TRUE),
  auclast    = c(TRUE,  TRUE),
  half.life  = c(FALSE, TRUE),
  aucinf.obs = c(FALSE, TRUE)
)

nca_data <- PKNCA::PKNCAdata(conc_obj, dose_obj, intervals = intervals)
nca_res  <- suppressMessages(suppressWarnings(PKNCA::pk.nca(nca_data)))
nca_summary <- summary(nca_res)
knitr::kable(nca_summary,
caption = "Single- and two-dose NCA on the simulated cohort by eoPE stratum (median dose 11.4 mg IM at t = 0 and t = 24 h; concentrations in ug/L).")| start | end | stratum | N | auclast | cmax | tmax | half.life | aucinf.obs |
|---|---|---|---|---|---|---|---|---|
| 0 | 24 | eoPE | 200 | 852 [19.2] | 80.4 [36.1] | 0.750 [0.250, 2.50] | . | . |
| 0 | 48 | eoPE | 200 | 1890 [18.3] | 91.8 [24.8] | 25.0 [0.250, 26.0] | 13.0 [6.15] | 2300 [20.2] |
| 0 | 24 | w/o eoPE | 200 | 625 [17.6] | 76.0 [32.9] | 0.750 [0.250, 1.50] | . | . |
| 0 | 48 | w/o eoPE | 200 | 1300 [18.8] | 81.2 [26.1] | 25.0 [0.250, 26.0] | 8.22 [2.63] | 1420 [21.8] |
Comparison against published NCA
Schoenmakers 2025 reports stratum-specific NCA medians in Figure 1 caption (AUC0-24h, individual EBE CL/F) and abstract (AUC0-inf). The simulated medians below are computed by stratum on the stochastic cohort.
per_subj <- sim |>
  mutate(stratum = ifelse(DIS_EOPE == 1, "eoPE", "w/o eoPE"),
         Cc_ugL  = Cc * 1000) |>
  filter(time > 0) |>
  group_by(id, stratum) |>
  summarise(
    cmax       = max(Cc_ugL, na.rm = TRUE),
    auc_0_24   = sum((time - lag(time)) *
                     (Cc_ugL + lag(Cc_ugL)) / 2 * (time <= 24 & lag(time) >= 0),
                     na.rm = TRUE),
    .groups = "drop"
  )

per_strat <- per_subj |>
  group_by(stratum) |>
  summarise(
    cmax_med  = median(cmax),
    auc_24_med = median(auc_0_24),
    n = dplyr::n(),
    .groups = "drop"
  )

# Reported numbers from the source.
src <- tibble::tribble(
  ~stratum,   ~src_cl,   ~src_auc24,                ~src_auc_inf,
  "w/o eoPE", "15.78",   "584 (range 394-751)",     "1114",
  "eoPE",     "9.35",    "709 (range 609-919)",     "1567"
)

tbl <- per_strat |>
  left_join(src, by = "stratum") |>
  transmute(
    Stratum                                 = stratum,
    `Source median CL/F (L/h)`              = src_cl,
    `Source median AUC0-24 (ng.h/mL)`       = src_auc24,
    `Source median AUC0-inf (ng.h/mL)`      = src_auc_inf,
    `Simulated median Cmax (ng/mL)`         = sprintf("%.1f", cmax_med),
    `Simulated median AUC0-24 (ng.h/mL)`    = sprintf("%.0f", auc_24_med)
  )

knitr::kable(tbl, caption = "Simulated stratum medians vs Schoenmakers 2025 Figure 1 / abstract NCA values. Source units are ng.h/mL == ug.h/L (paper plots in ug/L).")| Stratum | Source median CL/F (L/h) | Source median AUC0-24 (ng.h/mL) | Source median AUC0-inf (ng.h/mL) | Simulated median Cmax (ng/mL) | Simulated median AUC0-24 (ng.h/mL) |
|---|---|---|---|---|---|
| eoPE | 9.35 | 709 (range 609-919) | 1567 | 97.3 | 859 |
| w/o eoPE | 15.78 | 584 (range 394-751) | 1114 | 82.5 | 616 |
The simulated median AUC0-24 within each stratum should fall within ~20% of the source-paper Figure 1 medians. The published AUC0-inf is the extrapolated cumulative exposure of the full 2-dose regimen; see the Assumptions section for the bioavailability question that the source’s AUC0-inf vs (Dose / CL) ratio raises.
Assumptions and deviations
IIV-CV reporting convention. Schoenmakers 2025 Table 2 reports IIV-CL = 21.30% and IIV-Vc = 89.50% as percentages without an explicit conversion formula. The model file interprets these as approximate CV% on the natural (linear) parameter scale and converts to log-scale variance via the exact log-normal relation
omega^2 = log(1 + CV^2), givingetalcl ~ 0.0444(= log(1 + 0.213^2)) andetalvc ~ 0.5887(= log(1 + 0.895^2)). The alternative reading – treating the printed % values assqrt(omega^2) * 100directly – would giveetalcl ~ 0.0454andetalvc ~ 0.801. The difference is negligible for IIV-CL but substantial for IIV-Vc (omega^2 differs by ~36%). The reported IIV-Vc shrinkage of 20% (Table 2 final) is consistent with either reading. Users running parameter-recovery simulations against the source NONMEM run should be aware of this ambiguity.Residual-error reporting convention. Schoenmakers 2025 Table 2 reports “Residual variability: 0.224” with no unit annotation (whereas IIV values carry an explicit “%” sign). The model file interprets 0.224 as the SD of the proportional residual term (i.e.,
propSd = 0.224corresponds to a 22.4% CV), consistent with the most common NONMEM popPK reporting convention forCc ~ prop(propSd). Treating 0.224 as the variance instead would imply propSd ~ 47.3% CV, which is implausibly high for a validated LC-MS/MS betamethasone serum assay.Q/F unit annotation in Table 2. The Schoenmakers 2025 Table 2 row “Apparent intercompartmental clearance (Q/F; L)” prints the units as “L” (a volume). Q/F is necessarily a clearance (the row above for CL/F is “L/h”), so this is a publication unit-label typo. The model file declares
lq = log(99.8)with units L/h and the modelmodel()block uses it as a clearance in the rate equations.Body weight not in the structural model. Forward-inclusion at P < 0.05 retained body-weight covariates on CL and on Vc, but backward-elimination at P < 0.01 dropped all weight terms (Results 3.1: “keeping the weight-related covariates in the model did not result in a significantly better model and therefore was not added to the model”). The model file therefore has no
WTcovariate;covariateDatacontains onlyDIS_EOPE. The virtual cohort samples body weight only for descriptive reporting.AUC0-inf vs (Dose / CL) discrepancy. The published abstract median AUC0-inf is 1114 ng.h/mL (non-eoPE) and 1567 ng.h/mL (eoPE). A single-dose forward calculation gives AUC0-inf = Dose * F / CL. With F = 1 and the published CL medians (15.78 and 9.35 L/h), single-dose AUC0-inf = 723 and 1219 ng.h/mL, respectively. For two doses the cumulative AUC0-inf would be 1445 and 2438 ng.h/mL. The reported 1114 / 1567 falls between these. The paper does not state whether AUC0-inf is one-dose or two-dose, nor whether F is treated as < 1; the cited Foissac 2020 and Della Torre 2020 references report AUC0-24 only and do not resolve the gap. The vignette compares AUC0-24 instead (which is reported unambiguously in Figure 1 caption) and flags this gap rather than tuning bio- availability to match.
Metabolites not modelled. Schoenmakers 2025 reports half-lives of 0.5 h for 11-keto-betamethasone and 2.4 h for 6-beta-hydroxybetamethasone (Table S3 in the supplementary information). The supplement is not on disk for this extraction; the metabolite parameters are therefore not represented in the model. Adding the metabolite compartments would require the supplement’s Tables S2/S3 plus the figure-S5 metabolite VPC for validation.
DIS_EOPE canonical covariate ratified with this extraction. Early-onset pre-eclampsia (eoPE; pre-eclampsia diagnosed < 34 weeks gestation) is registered as a new canonical covariate name in
inst/references/covariate-columns.mdalongside this model. Future models that enrol mixed early-/late-onset cohorts should register a separate canonical (e.g.,PREECLfor any-onset PE,LOPEfor late-onset PE) rather than reusingDIS_EOPEwith relaxed semantics.Virtual cohort sized for stable medians. The vignette uses 200 women per stratum (400 total), substantially larger than the source cohort (23 + 5 = 28). The larger size gives stable NCA medians while keeping the vignette under the 5-minute pkgdown gate.
Single-centre cohort generalisability. All 28 women in the source study were enrolled at a single Dutch tertiary centre between January and October 2021 (MEC-2019-0650). Generalisability to non-Dutch obstetric populations or to second-trimester (very early) pre-eclampsia is not established by the source data.
Author correction notice on the source PDF. The source PDF carries an authorship-correction note dated 21 March 2025. The correction is to the authorship metadata only (shared first and last authorship designations) and does NOT revise any parameter value or equation; the model and the values in this vignette are unchanged by the correction.