Cefepime-enmetazobactam (Vollmer 2023)
Source:vignettes/articles/Vollmer_2023_cefepime_enmetazobactam.Rmd
Vollmer_2023_cefepime_enmetazobactam.Rmd
library(nlmixr2lib)
library(rxode2)
library(PKNCA)
library(dplyr)
library(ggplot2)

rxode2::rxSetSeed(20231014)  # IDWeek presentation date; common random numbers
The model
Vollmer_2023_cefepime_enmetazobactam is the joint
population PK model for the fixed-ratio (4:1) cefepime-enmetazobactam
combination EXBLIFEP, pooled across three Phase 1 studies, one Phase 2
study and the Phase 3 ALLIUM trial. Each drug gets its own
two-compartment intravenous disposition; the two are tied together by a
four-way OMEGA block whose cross-drug correlations exceed 0.93.
mod <- nlmixr2lib::modellib("Vollmer_2023_cefepime_enmetazobactam")
typ <- rxode2::zeroRe(mod)   # typical-value (all etas zero) version
#> ℹ parameter labels from comments will be replaced by 'label()'
#> Warning: some etas defaulted to non-mu referenced, possible parsing error: etalcl_enm_hlth, etalvc_enm_hlth, etalcl_hlth
#> as a work-around try putting the mu-referenced expression on a simple line
#> Warning: some etas defaulted to non-mu referenced, possible parsing error: etalcl_enm_hlth, etalvc_enm_hlth, etalcl_hlth
#> as a work-around try putting the mu-referenced expression on a simple line
mod
#> function() {
#>   description <- paste(
#>     "Simultaneous four-compartment (two compartments per drug) population PK",
#>     "model for the fixed-ratio (4:1) cefepime-enmetazobactam combination",
#>     "(EXBLIFEP), fitted jointly to 5,070 cefepime plasma samples from 588",
#>     "subjects and 6,342 enmetazobactam plasma samples from 649 subjects",
#>     "pooled across three Phase 1 studies, one Phase 2 study and the Phase 3",
#>     "ALLIUM trial in adults with complicated urinary tract infection or acute",
#>     "pyelonephritis (Vollmer 2023). Both drugs are given as zero-order",
#>     "intravenous infusions with linear clearance from their own central",
#>     "compartment. De-indexed (absolute) eGFR is a power covariate on the",
#>     "clearance of both drugs with an exponent near 1, consistent with",
#>     "glomerular filtration being the dominant elimination route; age and body",
#>     "weight are power covariates on both central volumes; enmetazobactam",
#>     "additionally carries a cUTI-infection effect on its central volume and",
#>     "sex plus de-indexed eGFR effects on its peripheral volume. Both",
#>     "inter-compartmental clearances are FIXED to the Phase 1+2 analysis",
#>     "because the sparse Phase 3 sampling could not characterise distribution.",
#>     "Inter-individual variability is stratified by infection status (healthy",
#>     "volunteer versus infected patient) and is markedly larger in patients;",
#>     "a four-way OMEGA block across cefepime and enmetazobactam CL and Vc in",
#>     "infected subjects carries cross-drug correlations of 0.93 (CL) and 0.96",
#>     "(Vc). Cefepime is the unsuffixed parent; enmetazobactam carries the",
#>     "sibling-drug suffix _enm throughout."
#>   )
#>   reference <- paste(
#>     "Vollmer J, Belley A, Velicitat P, Machacek M. 2529. Population",
#>     "pharmacokinetic models for cefepime and enmetazobactam derived from",
#>     "pooled Phase 1 to Phase 3 clinical studies. Open Forum Infect Dis.",
#>     "2023;10(Suppl 2):ofad500.2147 (IDWeek 2023, Session 241, abstract 2529).",
#>     "doi:10.1093/ofid/ofad500.2147.",
#>     "The IDWeek abstract publishes the typical values for a 70 kg cUTI",
#>     "patient and their %CV but not the covariate coefficients, correlations",
#>     "or residual error, so the complete final-model parameter set encoded",
#>     "here is transcribed from the two regulatory reproductions of the same",
#>     "Allecra population PK study report AAI101-PK-21-01: US FDA NDA 216165",
#>     "(EXBLIFEP) Integrated Review, 22 February 2024, Table 101 'Parameter",
#>     "Estimates (RSE) and Median (%CV) for the Applicant's Final Model'",
#>     "(sponsor page 135, reproducing study-report Table 12); and EMA EPAR",
#>     "EMA/63929/2024 for Exblifep, Tables 5 and 6 (assessment-report pages",
#>     "47-48, reproducing study-report Tables 19 and 20). The EMA report is",
#>     "also the only source that states the reference individual: 'a body",
#>     "weight of 70 kg, de-indexed eGFR of 100 mL/min, and an age of 50 years'",
#>     "(page 46), with Sex = Female and Infection = healthy for enmetazobactam",
#>     "(Table 6 note).",
#>     sep = " "
#>   )
#>   vignette <- "Vollmer_2023_cefepime_enmetazobactam"
#>   units <- list(time = "h", dosing = "mg", concentration = "mg/L")
#>
#>   # Inter-individual variability is stratified by infection status, so the
#>   # canonical etalcl / etalvc slots consumed by the individual-parameter
#>   # expressions are multiplexed inside model() from stratum-specific ini()
#>   # magnitudes. Same construction as the study-phase-stratified residual SDs
#>   # in Xie_2025_aztreonam_avibactam and Cammarata_2024_sulbactam_durlobactam,
#>   # applied to the random effects instead of the residuals. Cefepime Vc has
#>   # no healthy-stratum eta (FDA Table 101 prints "-" for both the estimate
#>   # and its RSE), so only three of the four multiplexed slots have two arms.
#>   paper_specific_etas <- c(
#>     "etalcl_inf",
#>     "etalcl_hlth",
#>     "etalvc_inf",
#>     "etalcl_enm_inf",
#>     "etalcl_enm_hlth",
#>     "etalvc_enm_inf",
#>     "etalvc_enm_hlth"
#>   )
#>
#>   # Issue #482: what each ODE state holds, in what amount units, in what
#>   # biological matrix. Doses are in mg and volumes in L, so concentrations
#>   # are mg/L (= ug/mL, the unit the FDA label reports).
#>   compartmentData <- list(
#>     central = list(analyte = "cefepime", units = "mg", specimen = "plasma", verified = TRUE),
#>     peripheral1 = list(analyte = "cefepime", units = "mg", specimen = "plasma", verified = TRUE),
#>     central_enm = list(analyte = "enmetazobactam", units = "mg", specimen = "plasma", verified = TRUE),
#>     peripheral1_enm = list(analyte = "enmetazobactam", units = "mg", specimen = "plasma", verified = TRUE)
#>   )
#>
#>   dosing <- c("central", "central_enm")
#>
#>   covariateData <- list(
#>     WT = list(
#>       description = "Total body weight",
#>       units = "kg",
#>       type = "continuous",
#>       reference_category = NULL,
#>       notes = paste(
#>         "Power covariate on the CENTRAL volume of distribution of both",
#>         "drugs, normalised to the 70 kg reference individual named in EMA",
#>         "EPAR EMA/63929/2024 page 46. Exponents 0.802 (cefepime) and 0.618",
#>         "(enmetazobactam) - FDA Table 101 rows 'Body weight on FEP V1' and",
#>         "'Body weight on ENM V1'. NOTE that the EMA assessment-report PROSE",
#>         "on page 48 attributes 0.618 to cefepime and 0.802 to",
#>         "enmetazobactam, which contradicts its OWN Tables 5 and 6 on the two",
#>         "preceding pages as well as FDA Table 101; the two independent",
#>         "tables agree with each other and are used here. The 70 kg reference",
#>         "is independently confirmed by the IDWeek abstract, whose",
#>         "'typical values for a 70 kg cUTI patient' table prints cefepime Vc",
#>         "as 11.2 L - exactly the untransformed estimate, which can only hold",
#>         "if the weight reference is 70 kg. Neither drug carries a weight",
#>         "effect on clearance or on the peripheral volume. Time-fixed per",
#>         "subject; analysis-set mean 76.52 kg, range 45-135 kg (FDA Table",
#>         "100)."
#>       ),
#>       source_name = "BW"
#>     ),
#>     AGE = list(
#>       description = "Age at baseline",
#>       units = "years",
#>       type = "continuous",
#>       reference_category = NULL,
#>       notes = paste(
#>         "Power covariate on the CENTRAL volume of distribution of both",
#>         "drugs, normalised to the 50-year reference individual (EMA EPAR",
#>         "EMA/63929/2024 page 46: 'an age of 50 years'). Exponents 0.176",
#>         "(cefepime) and 0.146 (enmetazobactam) - FDA Table 101 rows 'Age on",
#>         "FEP V1' and 'Age on ENM V1'. Age was tested on cefepime clearance",
#>         "and NOT retained (EMA Table 5 prints '-' for 'Age on Cl'). The FDA",
#>         "reviewer concluded the age effect is not clinically meaningful and",
#>         "requires no dose adjustment (FDA Table 98). Time-fixed per subject;",
#>         "analysis-set mean 51.62 years, range 17-94 years (FDA Table 100)."
#>       ),
#>       source_name = "AGE"
#>     ),
#>     CRCL = list(
#>       description = paste(
#>         "DE-INDEXED (absolute) estimated glomerular filtration rate in",
#>         "mL/min - i.e. the MDRD eGFR multiplied back up by BSA/1.73, NOT the",
#>         "BSA-normalised mL/min/1.73 m^2 form"
#>       ),
#>       units = "mL/min",
#>       type = "continuous",
#>       reference_category = NULL,
#>       notes = paste(
#>         "RAW, NON-BSA-NORMALISED renal function, in mL/min. This is the",
#>         "un-normalised member of the CRCL family (same normalisation as",
#>         "Delattre_2010_amikacin and Chen_2023_nemonoxacin); supplying a",
#>         "BSA-normalised mL/min/1.73 m^2 value instead would silently",
#>         "mis-scale every clearance. The de-indexed form is what the FDA",
#>         "reviewer specifically requested: BSA-indexed eGFR underestimates",
#>         "measured GFR in subjects whose BSA exceeds 1.73 m^2, so an",
#>         "information request of 15 September 2023 asked the applicant to",
#>         "redo the renal-impairment simulations on de-indexed eGFR (FDA",
#>         "Integrated Review, sponsor page 138). Power covariate on the",
#>         "clearance of both drugs, normalised to 100 mL/min (EMA EPAR",
#>         "EMA/63929/2024 page 46), with exponents 0.834 (cefepime) and 0.898",
#>         "(enmetazobactam); the abstract reads exponents this close to 1 as",
#>         "evidence that 'renal filtration is the predominant clearance",
#>         "mechanism'. Enmetazobactam ALSO carries a de-indexed eGFR power",
#>         "term of 0.259 on its peripheral volume (FDA Table 101 row",
#>         "'De-indexed eGFR on ENM V2'); cefepime does not (EMA Table 5 prints",
#>         "'-' for 'De-indexed eGFR on V2'). Renal function is the only",
#>         "covariate that drives a labelled dose adjustment. Time-fixed per",
#>         "subject in the source analysis; analysis-set mean 87.98 mL/min,",
#>         "range 5.21-195.84 mL/min (FDA Table 100)."
#>       ),
#>       source_name = "de-indexed eGFR"
#>     ),
#>     SEXF = list(
#>       description = "Sex, 1 = female, 0 = male",
#>       units = "(binary)",
#>       type = "binary",
#>       reference_category = "1 (female) - the published reference individual is FEMALE, so the enmetazobactam V2 estimate of 5.28 L is the female value and males carry the multiplicative shift",
#>       notes = paste(
#>         "Enmetazobactam PERIPHERAL volume only, as exp(0.198) = 1.219 in",
#>         "males (FDA Table 101 row 'Gender on ENM V2', parameter",
#>         "beta_ENM,V2_GENDER_Male = 0.198). Because the coefficient is",
#>         "carried by the MALE level while the canonical column codes FEMALE",
#>         "as 1, the model() term is written on (1 - SEXF) and the ini()",
#>         "parameter is named e_sexmale_vp_enm rather than the usual e_sexf_*",
#>         "- the name follows the level that carries the effect, as in",
#>         "e_race_chinese_vc_avi of Xie_2025_aztreonam_avibactam. Sex was NOT",
#>         "a significant covariate on any cefepime parameter (EMA EPAR page",
#>         "46: 'sex was not identified as a significant covariate on cefepime",
#>         "PK and thus, was not used in defining a reference individual').",
#>         "Analysis set 310 female (47%) / 353 male (53%) (FDA Table 100)."
#>       ),
#>       source_name = "GENDER"
#>     ),
#>     DIS_CUTI = list(
#>       description = "Infected patient indicator, 1 = complicated urinary tract infection or acute pyelonephritis, 0 = healthy volunteer",
#>       units = "(binary)",
#>       type = "binary",
#>       reference_category = "0 (healthy Phase 1 volunteer)",
#>       notes = paste(
#>         "SINGLE POOLED infection indicator: the source analysis carries one",
#>         "coefficient for the whole infected cohort rather than separate cUTI",
#>         "and acute-pyelonephritis levels, so per the DIS_CUTI register entry",
#>         "this column is used ALONE and DIS_AP is deliberately not paired",
#>         "with it. Set it to 1 for every cUTI or AP patient and to 0 only for",
#>         "healthy volunteers. FDA Table 100 splits the 663-subject analysis",
#>         "set into 132 healthy (20%) and 531 infected - 252 acute",
#>         "pyelonephritis (38%), 17 cUTI (3%), 111 cUTI with a removable",
#>         "source (17%) and 151 cUTI without a removable source but with other",
#>         "risk factors (23%). This column does TWO things in the model. (1) A",
#>         "fixed effect on the enmetazobactam central volume only, as",
#>         "exp(0.145) = 1.156 (FDA Table 101 row 'cUTI infection on ENM V1'),",
#>         "which takes the reference 13.2 L to the 15.3 L that both the EMA",
#>         "report (page 47, 'For infected subjects, the estimated central",
#>         "volume of distribution was slightly larger with 15.3 L') and the",
#>         "IDWeek abstract print for an infected patient - this agreement is",
#>         "what pins the effect to the exponential form exp(beta) rather than",
#>         "the proportional form (1 + beta), which would give 15.1 L. (2) It",
#>         "SWITCHES the inter-individual variances: every IIV except the two",
#>         "peripheral-volume terms has a separate healthy-volunteer and",
#>         "infected-patient magnitude, and the infected magnitudes are two- to",
#>         "nine-fold larger, matching the abstract's 'Variability was higher",
#>         "in cUTI patients although differences in mean ENM or FEP exposures",
#>         "between healthy subjects and cUTI patients were negligible'."
#>       ),
#>       source_name = "INFECTION_cUTI"
#>     )
#>   )
#>
#>   # Screened in the source covariate analysis and NOT retained in the final
#>   # model, so they carry no coefficient and are documented rather than
#>   # declared (FDA Integrated Review, sponsor page 134, 'Covariate Analysis':
#>   # "BSA, body mass index, creatinine clearance, albumin, bilirubin and race
#>   # were not identified as statistically significant covariates in the
#>   # cefepime-enmetazobactam population PK model.").
#>   covariatesDataExcluded <- list(
#>     BSA = list(
#>       description = "Body surface area",
#>       units = "m^2",
#>       type = "continuous",
#>       notes = "Formally evaluated, not retained. Analysis-set mean 1.89 m^2, range 1.37-2.63 (FDA Table 100)."
#>     ),
#>     BMI = list(
#>       description = "Body mass index",
#>       units = "kg/m^2",
#>       type = "continuous",
#>       notes = "Formally evaluated, not retained. Analysis-set mean 26.54 kg/m^2, range 16.9-45.9 (FDA Table 100)."
#>     ),
#>     ALB = list(
#>       description = "Serum albumin",
#>       units = "g/L",
#>       type = "continuous",
#>       notes = "Formally evaluated, not retained. EMA Table 5 explicitly prints '-' for 'Albumin level on V2' of cefepime. Analysis-set mean 40.38 g/L, range 21-51 (FDA Table 100)."
#>     ),
#>     BILI = list(
#>       description = "Total bilirubin",
#>       units = "umol/L",
#>       type = "continuous",
#>       notes = "Formally evaluated, not retained. Analysis-set mean 11.03 umol/L, range 3-51.5 (FDA Table 100)."
#>     ),
#>     RACE_WHITE = list(
#>       description = "White race indicator",
#>       units = "(binary)",
#>       type = "binary",
#>       notes = paste(
#>         "Race COULD NOT BE TESTED rather than merely being rejected: FDA",
#>         "Table 98 records that 'Race could not be tested as a predictor of",
#>         "IIV in the population PK analyses because 97% of the population was",
#>         "White', and the US label states there was insufficient information",
#>         "to evaluate the effect of race. Analysis set 641/663 White (97%)."
#>       )
#>     )
#>   )
#>
#>   population <- list(
#>     species = "human",
#>     n_subjects = "663 in the analysis set; 588 contributed 5,070 cefepime plasma observations and 649 contributed 6,342 enmetazobactam plasma observations",
#>     n_studies = 5,
#>     studies = "AT-101, AT-102 and AT-103 (Phase 1, n = 83 / 30 / 19), AT-201 (Phase 2, n = 43) and AT-301 / ALLIUM (Phase 3, n = 488)",
#>     age_range = "17-94 years (mean 51.62)",
#>     weight_range = "45-135 kg (mean 76.52)",
#>     sex_female_pct = 47,
#>     race_ethnicity = "97% White (641/663); 4 Asian, 3 American Indian or Alaska Native, 1 Black or African American, 14 other",
#>     disease_state = "complicated urinary tract infection or acute pyelonephritis (531/663, 80%) and healthy volunteers (132/663, 20%)",
#>     renal_function = "de-indexed eGFR mean 87.98 mL/min, range 5.21-195.84 mL/min; BSA-indexed eGFR mean 81.03 mL/min/1.73 m^2, range 4.4-166",
#>     dose_range = "cefepime 1-2 g with enmetazobactam 0.25-1 g as 2-hour or 4-hour intravenous infusions, q8h to q24h depending on renal function; the approved adult regimen is 2 g cefepime / 0.5 g enmetazobactam q8h over 2 hours",
#>     route = "intravenous infusion",
#>     notes = paste(
#>       "Cefepime and enmetazobactam are co-formulated in a fixed 4:1 mass",
#>       "ratio and were fitted SIMULTANEOUSLY, which is what makes the",
#>       "cross-drug random-effect correlations estimable; the abstract",
#>       "highlights that 'clearances and volumes of distribution were strongly",
#>       "correlated within individuals between the two compounds (correlation",
#>       "coefficients > 0.9)'. Plasma protein binding is 20% for cefepime and",
#>       "negligible for enmetazobactam (US label Table 5), so the free",
#>       "concentrations that the PK/PD targets are defined on are 0.80 x Cc",
#>       "and 1.00 x Cc_enm. The model was written in Mlxtran and estimated by",
#>       "SAEM in Monolix."
#>     )
#>   )
#>
#>   ini({
#>     # =====================================================================
#>     # REFERENCE INDIVIDUAL for every fixed effect below: body weight 70 kg,
#>     # de-indexed eGFR 100 mL/min, age 50 years, Sex = Female, Infection =
#>     # healthy (EMA EPAR EMA/63929/2024 pages 46-48, notes to Tables 5 and
#>     # 6). The IDWeek abstract's table instead reports "typical values for a
#>     # 70 kg cUTI patient", which differ from these estimates for exactly
#>     # one parameter - enmetazobactam Vc, 15.3 L there versus the 13.2 L
#>     # reference value here, the ratio being the exp(0.145) cUTI effect.
#>     #
#>     # CEFEPIME structural parameters (FDA NDA 216165 Integrated Review
#>     # Table 101, "Fixed effects"; EMA EPAR Table 5). Cefepime is the
#>     # unsuffixed parent.
#>     # =====================================================================
#>     lcl <- log(5.95); label("Cefepime clearance at de-indexed eGFR = 100 mL/min (L/h)")                  # Table 101: Cl_FEP = 5.95 L/h (RSE 1%)
#>     lvc <- log(11.2); label("Cefepime central volume of distribution at WT = 70 kg, AGE = 50 y (L)")     # Table 101: V1_FEP = 11.2 L (RSE 2.2%)
#>     lq  <- fixed(log(7.22)); label("Cefepime inter-compartmental clearance (L/h)")                       # Table 101: Q_FEP = 7.22 L/h, RSE column reads "fixed"
#>     lvp <- log(5.7);  label("Cefepime peripheral volume of distribution (L)")                            # Table 101: V2_FEP = 5.7 L (RSE 2.8%)
#>
#>     # =====================================================================
#>     # ENMETAZOBACTAM structural parameters (FDA Table 101; EMA Table 6).
#>     # =====================================================================
#>     lcl_enm <- log(7.68); label("Enmetazobactam clearance at de-indexed eGFR = 100 mL/min (L/h)")                     # Table 101: Cl_ENM = 7.68 L/h (RSE 1.1%)
#>     lvc_enm <- log(13.2); label("Enmetazobactam central volume of distribution at WT = 70 kg, AGE = 50 y, healthy (L)") # Table 101: V1_ENM = 13.2 L (RSE 2.1%)
#>     lq_enm  <- fixed(log(7.16)); label("Enmetazobactam inter-compartmental clearance (L/h)")                          # Table 101: Q_ENM = 7.16 L/h, RSE column reads "fixed"
#>     lvp_enm <- log(5.28); label("Enmetazobactam peripheral volume of distribution at de-indexed eGFR = 100 mL/min, female (L)") # Table 101: V2_ENM = 5.28 L (RSE 3.3%)
#>
#>     # Both inter-compartmental clearances are FIXED, not estimated. EMA EPAR
#>     # page 46: "The sparse sampling in AT-301 did not allow to characterise
#>     # the distribution into the peripheral compartment. The estimate of Q
#>     # was therefore fixed to the final estimate from the phase I+II
#>     # analysis." Consistent with FDA Table 101, whose RSE column prints the
#>     # literal word "fixed" for both Q rows and "(-)" for their %CV.
#>
#>     # =====================================================================
#>     # COVARIATE COEFFICIENTS (FDA Table 101, "Covariate coefficients"; EMA
#>     # Tables 5 and 6).
#>     #
#>     # FUNCTIONAL FORM. The analysis was run in Monolix, where a covariate
#>     # effect enters a log-normally distributed parameter additively on the
#>     # log scale. Continuous covariates are entered log-transformed (the FDA
#>     # parameter names carry the transform marker, e.g. beta_FEP,CL_teGFR
#>     # and beta_ENM,V1_tAGE), which makes each of those a POWER model on the
#>     # covariate/reference ratio; categorical covariates enter as an
#>     # indicator, which makes each a multiplicative exp(beta). Three
#>     # independent facts confirm this reading rather than a proportional
#>     # (1 + beta) one:
#>     #   (i)  the cUTI effect on enmetazobactam Vc reproduces the separately
#>     #        published infected value exactly - 13.2 * exp(0.145) = 15.26,
#>     #        printed as 15.3 L by both the EMA report and the abstract,
#>     #        whereas 13.2 * (1 + 0.145) = 15.1 L does not;
#>     #   (ii) the abstract reads the ~0.83-0.90 eGFR coefficients as showing
#>     #        "renal filtration is the predominant clearance mechanism",
#>     #        which is a statement about a near-proportional POWER exponent;
#>     #        under a linear model 0.834 would mean +83% clearance per
#>     #        mL/min, which is absurd;
#>     #   (iii) inverting the power form on FDA Table 104's simulated
#>     #        steady-state AUCs recovers a de-indexed eGFR reference of
#>     #        ~100 mL/min, which is the value the EMA report states.
#>     # =====================================================================
#>     e_crcl_cl     <- 0.834; label("Cefepime de-indexed eGFR power exponent on CL, (CRCL/100) (unitless)")             # Table 101: beta_FEP,CL_teGFR = 0.834 (RSE 2.1%, p < 2.2e-16)
#>     e_age_vc      <- 0.176; label("Cefepime age power exponent on Vc, (AGE/50) (unitless)")                           # Table 101: beta_FEP,V1_tAGE = 0.176 (RSE 19%, p = 1.4e-07)
#>     e_wt_vc       <- 0.802; label("Cefepime body-weight power exponent on Vc, (WT/70) (unitless)")                    # Table 101: beta_FEP,V1_tBW = 0.802 (RSE 8.8%, p < 2.2e-16)
#>
#>     e_crcl_cl_enm <- 0.898; label("Enmetazobactam de-indexed eGFR power exponent on CL, (CRCL/100) (unitless)")       # Table 101: beta_ENM,CL_teGFR = 0.898 (RSE 2%, p < 2.2e-16)
#>     e_age_vc_enm  <- 0.146; label("Enmetazobactam age power exponent on Vc, (AGE/50) (unitless)")                     # Table 101: beta_ENM,V1_tAGE = 0.146 (RSE 20%, p = 3.8e-07)
#>     e_wt_vc_enm   <- 0.618; label("Enmetazobactam body-weight power exponent on Vc, (WT/70) (unitless)")              # Table 101: beta_ENM,V1_tBW = 0.618 (RSE 9.6%, p < 2.2e-16)
#>     e_cuti_vc_enm <- 0.145; label("Enmetazobactam log-scale shift in Vc for an infected (cUTI or AP) patient (unitless)") # Table 101: beta_ENM,V1_INFECTION_cUTI = 0.145 (RSE 17%, p = 3.8e-09)
#>     e_crcl_vp_enm <- 0.259; label("Enmetazobactam de-indexed eGFR power exponent on Vp, (CRCL/100) (unitless)")       # Table 101: beta_ENM,V2_teGFR = 0.259 (RSE 21%, p = 3.2e-06)
#>     e_sexmale_vp_enm <- 0.198; label("Enmetazobactam log-scale shift in Vp for a male subject (unitless)")            # Table 101: beta_ENM,V2_GENDER_Male = 0.198 (RSE 19%, p = 7.9e-08)
#>
#>     # =====================================================================
#>     # INTER-INDIVIDUAL VARIABILITY (FDA Table 101, "Standard deviations" and
#>     # "Correlations").
#>     #
#>     # SCALE OF THE PRINTED COLUMN. Table 101 gives BOTH the Monolix omega
#>     # (an SD on the log scale, under "Standard deviations") and a %CV
#>     # (in parentheses beside each fixed effect), so the scale is not a
#>     # judgement call - it is over-determined nine times over. Every one of
#>     # the nine estimated omegas reproduces its printed %CV under the
#>     # log-normal identity CV = sqrt(exp(omega^2) - 1): 0.15 -> 15%,
#>     # 0.356 -> 37%, 0.0549 -> 5%, 0.474 -> 50%, 0.0593 -> 6%, 0.161 -> 16%,
#>     # 0.297 -> 30%, 0.42 -> 44%, 0.195 -> 20%. The variances below are
#>     # therefore omega^2 with the printed omegas taken verbatim.
#>     #
#>     # STRATIFICATION BY INFECTION STATUS. Cefepime and enmetazobactam CL and
#>     # enmetazobactam Vc each have a separate healthy and infected variance;
#>     # cefepime Vc has an infected variance only (Table 101 prints "-" for
#>     # both the estimate and the RSE of omega_FEP,V1_healthy); the two
#>     # peripheral volumes have one variance spanning both strata (Table 101
#>     # labels them "FEP V2 in healthy and infected" and "ENM V2 in healthy
#>     # and infected"). The etas are multiplexed on DIS_CUTI in model().
#>     #
#>     # INFECTED BLOCK: a full 4x4 across cefepime CL, cefepime Vc,
#>     # enmetazobactam CL and enmetazobactam Vc. All six correlations are
#>     # printed, so the block is complete.
#>     #
#>     # POSITIVE-DEFINITENESS REPAIR. The 4x4 built from the correlations
#>     # EXACTLY as printed to three decimals is very slightly INDEFINITE
#>     # (smallest eigenvalue -1.72e-04), so chol() fails and rxSolve() cannot
#>     # sample from it. This is a rounding artifact, not a contradiction: each
#>     # printed correlation sits within 0.0005 - i.e. inside its own rounding
#>     # interval - of the feasible region, so the unrounded Monolix matrix was
#>     # positive definite and three-decimal rounding is what broke it. The
#>     # covariances below use the NEAREST positive-definite correlation matrix
#>     # (Higham projection, Matrix::nearPD with corr = TRUE, keepDiag = TRUE),
#>     # which moves no correlation by more than 6.7e-05 - an order of
#>     # magnitude INSIDE the +/-0.0005 rounding interval - so every repaired
#>     # correlation rounds back to the published three-decimal value exactly.
#>     # The repaired correlations are 0.260949, 0.931950, 0.261058, 0.339056,
#>     # 0.954933 and 0.437934 against printed 0.261, 0.932, 0.261, 0.339,
#>     # 0.955 and 0.438. The vignette re-derives this and asserts both the
#>     # round-trip and positive-definiteness.
#>     #
#>     # Order of the block: etalcl_inf, etalvc_inf, etalcl_enm_inf,
#>     # etalvc_enm_inf. Diagonals are omega^2 from the printed omegas:
#>     #   omega_FEP,CL_infected = 0.297 -> 0.088209   (RSE 3.4%)
#>     #   omega_FEP,V1_infected = 0.42  -> 0.1764     (RSE 4.5%)
#>     #   omega_ENM,CL_infected = 0.356 -> 0.126736   (RSE 3.3%)
#>     #   omega_ENM,V1_infected = 0.474 -> 0.224676   (RSE 3.9%)
#>     # Off-diagonals are repaired-correlation x SD x SD, from Table 101 rows:
#>     #   "CEF V1, FEP Cl in infected"  0.261 (RSE 19)  -> 0.03255083
#>     #   "ENM CL, FEP Cl in infected"  0.932 (RSE 1.1) -> 0.09853692
#>     #   "ENM CL, FEP V1 in infected"  0.339 (RSE 15)  -> 0.05069571
#>     #   "ENM V1, FEP Cl in infected"  0.261 (RSE 19)  -> 0.03675124
#>     #   "ENM V1, FEP V1 in infected"  0.955 (RSE 2.4) -> 0.19010800
#>     #   "ENM V1, ENM Cl in infected"  0.438 (RSE 9.3) -> 0.07389876
#>     # (The two rows printed as 0.261 with RSE 19 are the cefepime
#>     # within-drug Vc-CL correlation and the enmetazobactam-Vc/cefepime-CL
#>     # cross-drug correlation. EMA Table 5 independently prints the first as
#>     # "V1, Cl in cUTI = 0.261"; the second is cross-drug and so appears only
#>     # in the FDA table, where it is reported with the identical value.)
#>     # =====================================================================
#>     etalcl_inf + etalvc_inf + etalcl_enm_inf + etalvc_enm_inf ~
#>       c(0.08820900,
#>         0.03255083, 0.17640000,
#>         0.09853692, 0.05069571, 0.12673600,
#>         0.03675124, 0.19010800, 0.07389876, 0.22467600)
#>
#>     # HEALTHY BLOCK: enmetazobactam CL and Vc, correlation 0.983 (Table 101
#>     # row "ENM V1, ENM Cl in healthy", RSE 42; EMA Table 6 "V1, Cl in
#>     # healthy"). Positive definite as printed (eigenvalues 2.54e-02 and
#>     # 8.99e-05), so no repair is applied here.
#>     #   omega_ENM,CL_healthy = 0.15    -> 0.0225      (RSE 7.6%)
#>     #   omega_ENM,V1_healthy = 0.0549  -> 0.00301401  (RSE 59%)
#>     #   covariance = 0.983 * 0.15 * 0.0549            -> 0.00809505
#>     etalcl_enm_hlth + etalvc_enm_hlth ~
#>       c(0.02250000,
#>         0.00809505, 0.00301401)
#>
#>     # Cefepime CL in healthy volunteers carries no reported correlation with
#>     # anything, so it is an independent eta.
#>     etalcl_hlth ~ 0.02592100   # omega_FEP,CL_healthy = 0.161 -> 0.161^2 (RSE 11%)
#>
#>     # Peripheral-volume IIV, one variance each spanning BOTH strata.
#>     etalvp     ~ 0.03802500   # omega_FEP,V2 = 0.195   -> 0.195^2   (RSE 14%)
#>     etalvp_enm ~ 0.00351649   # omega_ENM,V2 = 0.0593  -> 0.0593^2  (RSE 72%)
#>
#>     # NO eta on either inter-compartmental clearance: both Q values are
#>     # fixed, and Table 101 lists no omega_Q row for either drug.
#>     #
#>     # NO healthy-stratum eta on cefepime Vc: Table 101 row "FEP V1 in
#>     # healthy" prints "-" in both the estimate and the RSE column. Healthy
#>     # volunteers therefore take the typical cefepime central volume.
#>
#>     # =====================================================================
#>     # RESIDUAL VARIABILITY (FDA Table 101, "Observational error"; EMA
#>     # Tables 5 and 6). Monolix's combined error model is
#>     # y = f + (a + b*f)*eps, so a is an additive SD in concentration units
#>     # and b is a proportional SD.
#>     #
#>     # UNIT CONVERSION. Table 101 reports the enmetazobactam constant error
#>     # in ng/mL (a_ENM = 40.9 ng/mL) because the analysis dataset held
#>     # concentrations in ng/mL - the same units as the FDA's Figure 14 axis
#>     # label, "Observed Versus Population Predicted ... Plasma Concentrations
#>     # in ng/mL". This model works in mg/L (= ug/mL), so the additive SD is
#>     # 40.9 ng/mL / 1000 = 0.0409 mg/L. The proportional terms are unitless
#>     # and carry over unchanged.
#>     # =====================================================================
#>     propSd     <- 0.253;  label("Cefepime proportional residual SD (fraction)")            # Table 101: b_FEP = 0.253 (RSE 1.2%)
#>     propSd_enm <- 0.236;  label("Enmetazobactam proportional residual SD (fraction)")      # Table 101: b_ENM = 0.236 (RSE 1.1%)
#>     addSd_enm  <- 0.0409; label("Enmetazobactam additive residual SD (mg/L)")              # Table 101: a_ENM = 40.9 ng/mL (RSE 12%) = 0.0409 mg/L
#>
#>     # Cefepime has NO additive residual component: Table 101 lists a
#>     # constant error for enmetazobactam only, and EMA Table 5 prints "-"
#>     # for the cefepime "Constant error" row. Its error model is purely
#>     # proportional.
#>   })
#>
#>   model({
#>     # ------------------------------------------------------------------
#>     # 1. Infection-stratum multiplexing of the random effects.
#>     #
#>     # Each of these selects the healthy or the infected eta for the subject
#>     # via the 0/1 DIS_CUTI indicator, rather than through a branch, so the
#>     # expression stays smooth and finite. Cefepime Vc has no healthy-arm
#>     # eta, so an uninfected subject takes the typical value exactly.
#>     # ------------------------------------------------------------------
#>     infected <- DIS_CUTI
#>     healthy  <- 1 - DIS_CUTI
#>
#>     eta_cl     <- etalcl_inf     * infected + etalcl_hlth     * healthy
#>     eta_vc     <- etalvc_inf     * infected
#>     eta_cl_enm <- etalcl_enm_inf * infected + etalcl_enm_hlth * healthy
#>     eta_vc_enm <- etalvc_enm_inf * infected + etalvc_enm_hlth * healthy
#>
#>     # ------------------------------------------------------------------
#>     # 2. Cefepime individual PK parameters. Every covariate enters on the
#>     #    log scale (power terms on the log-transformed continuous
#>     #    covariates), so each exp() argument is the Monolix individual
#>     #    log-parameter.
#>     # ------------------------------------------------------------------
#>     cl <- exp(lcl + eta_cl) * (CRCL / 100)^e_crcl_cl
#>     vc <- exp(lvc + eta_vc) * (WT / 70)^e_wt_vc * (AGE / 50)^e_age_vc
#>     q  <- exp(lq)
#>     vp <- exp(lvp + etalvp)
#>
#>     # ------------------------------------------------------------------
#>     # 3. Enmetazobactam individual PK parameters. The cUTI effect on Vc and
#>     #    the male effect on Vp are categorical, so they are exp(beta)
#>     #    multipliers; the male term is written on (1 - SEXF) because the
#>     #    published reference individual is FEMALE.
#>     # ------------------------------------------------------------------
#>     cl_enm <- exp(lcl_enm + eta_cl_enm) * (CRCL / 100)^e_crcl_cl_enm
#>
#>     vc_enm <- exp(lvc_enm + eta_vc_enm) *
#>       (WT / 70)^e_wt_vc_enm *
#>       (AGE / 50)^e_age_vc_enm *
#>       exp(e_cuti_vc_enm * DIS_CUTI)
#>
#>     q_enm  <- exp(lq_enm)
#>
#>     vp_enm <- exp(lvp_enm + etalvp_enm) *
#>       (CRCL / 100)^e_crcl_vp_enm *
#>       exp(e_sexmale_vp_enm * (1 - SEXF))
#>
#>     # ------------------------------------------------------------------
#>     # 4. Micro-constants.
#>     # ------------------------------------------------------------------
#>     kel <- cl / vc
#>     k12 <- q  / vc
#>     k21 <- q  / vp
#>
#>     kel_enm <- cl_enm / vc_enm
#>     k12_enm <- q_enm  / vc_enm
#>     k21_enm <- q_enm  / vp_enm
#>
#>     # ------------------------------------------------------------------
#>     # 5. Four-compartment system: two independent two-compartment IV
#>     #    dispositions. Cefepime and enmetazobactam are co-formulated in one
#>     #    vial at a fixed 4:1 mass ratio and infused together, but they do
#>     #    not interconvert and neither inhibits the other's disposition, so
#>     #    each takes its own dose into its own central compartment as a
#>     #    zero-order infusion.
#>     # ------------------------------------------------------------------
#>     d/dt(central)     <- -(kel + k12) * central + k21 * peripheral1
#>     d/dt(peripheral1) <-   k12 * central        - k21 * peripheral1
#>
#>     d/dt(central_enm)     <- -(kel_enm + k12_enm) * central_enm + k21_enm * peripheral1_enm
#>     d/dt(peripheral1_enm) <-   k12_enm * central_enm            - k21_enm * peripheral1_enm
#>
#>     # ------------------------------------------------------------------
#>     # 6. Observations. Doses in mg and volumes in L give concentrations in
#>     #    mg/L (= ug/mL). These are TOTAL plasma concentrations; multiply by
#>     #    the unbound fractions 0.80 (cefepime, 20% protein bound) and 1.00
#>     #    (enmetazobactam, binding negligible) to obtain the free
#>     #    concentrations that the %fT > MIC and %fT > CT targets are defined
#>     #    on. See population$notes.
#>     # ------------------------------------------------------------------
#>     Cc     <- central     / vc
#>     Cc_enm <- central_enm / vc_enm
#>
#>     Cc     ~ prop(propSd)
#>     Cc_enm ~ add(addSd_enm) + prop(propSd_enm)
#>   })
#> }
#> <environment: 0x55679e23bba0>
Population
The analysis set is 663 adults contributing 5,070 cefepime plasma observations (588 subjects) and 6,342 enmetazobactam plasma observations (649 subjects) across five studies: AT-101, AT-102 and AT-103 (Phase 1; n = 83, 30, 19), AT-201 (Phase 2; n = 43) and AT-301 / ALLIUM (Phase 3; n = 488). Twenty percent of the analysis set (132/663) are healthy volunteers and 80% are patients with a complicated urinary tract infection or acute pyelonephritis.
knitr::kable(
  tibble::tribble(
    ~Characteristic,                ~`Mean (range) or n (%)`,
    "Age (years)",                  "51.62 (17-94)",
    "Body weight (kg)",             "76.52 (45-135)",
    "Body mass index (kg/m^2)",     "26.54 (16.9-45.9)",
    "Body surface area (m^2)",      "1.89 (1.37-2.63)",
    "eGFR (mL/min/1.73 m^2)",       "81.03 (4.4-166)",
    "De-indexed eGFR (mL/min)",     "87.98 (5.21-195.84)",
    "Female",                       "310 (47%)",
    "White",                        "641 (97%)",
    "Acute pyelonephritis",         "252 (38%)",
    "Complicated UTI (all subtypes)", "279 (42%)",
    "Healthy volunteer",            "132 (20%)"
  ),
  caption = "Baseline demographics of the population PK analysis set (FDA NDA 216165 Integrated Review Table 100)."
)| Characteristic | Mean (range) or n (%) |
|---|---|
| Age (years) | 51.62 (17-94) |
| Body weight (kg) | 76.52 (45-135) |
| Body mass index (kg/m^2) | 26.54 (16.9-45.9) |
| Body surface area (m^2) | 1.89 (1.37-2.63) |
| eGFR (mL/min/1.73 m^2) | 81.03 (4.4-166) |
| De-indexed eGFR (mL/min) | 87.98 (5.21-195.84) |
| Female | 310 (47%) |
| White | 641 (97%) |
| Acute pyelonephritis | 252 (38%) |
| Complicated UTI (all subtypes) | 279 (42%) |
| Healthy volunteer | 132 (20%) |
Race could not be tested as a covariate at all: 97% of the analysis
set was White, and the US label states there was insufficient
information to evaluate a race effect. Body-surface area, body-mass
index, creatinine clearance, albumin and bilirubin were formally
screened and not retained; they are documented in the model’s
covariatesDataExcluded rather than declared as
covariates.
Source trace
The IDWeek abstract is the paper of record, but it publishes only the typical values for a 70 kg cUTI patient and their %CV. The complete parameter set comes from the two regulatory reproductions of the same sponsor study report, AAI101-PK-21-01, which agree with each other value for value.
knitr::kable(
  tibble::tribble(
    ~Quantity, ~Source,
    "Structural model (2 compartments per drug, linear CL, IV infusion)", "EMA EPAR EMA/63929/2024 p.46; FDA Integrated Review Figure 13",
    "Cl, V1, Q, V2 for both drugs", "FDA Table 101 'Fixed effects'; EMA Tables 5 and 6",
    "Q fixed, not estimated", "EMA EPAR p.46; FDA Table 101 RSE column reads 'fixed'",
    "Reference individual: 70 kg, eGFR 100 mL/min, age 50 y, female, healthy", "EMA EPAR p.46 and Table 6 note",
    "Covariate coefficients (9)", "FDA Table 101 'Covariate coefficients'; EMA Tables 5 and 6",
    "IIV standard deviations (9, stratified by infection)", "FDA Table 101 'Standard deviations'",
    "Random-effect correlations (7)", "FDA Table 101 'Correlations'; EMA Tables 5 and 6 for the within-drug ones",
    "Residual error (3)", "FDA Table 101 'Observational error'; EMA Tables 5 and 6",
    "Typical values for a 70 kg cUTI patient; terminal half-lives 2.2 / 2.0 h", "Vollmer 2023 IDWeek abstract 2529, embedded table",
    "Baseline demographics", "FDA Integrated Review Table 100",
    "Simulated steady-state exposures by renal function", "FDA Integrated Review Table 104",
    "Observed steady-state NCA at the approved regimen", "US EXBLIFEP label (NDA 216165) Table 5"
  ),
  caption = "Where every model element comes from."
)| Quantity | Source |
|---|---|
| Structural model (2 compartments per drug, linear CL, IV infusion) | EMA EPAR EMA/63929/2024 p.46; FDA Integrated Review Figure 13 |
| Cl, V1, Q, V2 for both drugs | FDA Table 101 ‘Fixed effects’; EMA Tables 5 and 6 |
| Q fixed, not estimated | EMA EPAR p.46; FDA Table 101 RSE column reads ‘fixed’ |
| Reference individual: 70 kg, eGFR 100 mL/min, age 50 y, female, healthy | EMA EPAR p.46 and Table 6 note |
| Covariate coefficients (9) | FDA Table 101 ‘Covariate coefficients’; EMA Tables 5 and 6 |
| IIV standard deviations (9, stratified by infection) | FDA Table 101 ‘Standard deviations’ |
| Random-effect correlations (7) | FDA Table 101 ‘Correlations’; EMA Tables 5 and 6 for the within-drug ones |
| Residual error (3) | FDA Table 101 ‘Observational error’; EMA Tables 5 and 6 |
| Typical values for a 70 kg cUTI patient; terminal half-lives 2.2 / 2.0 h | Vollmer 2023 IDWeek abstract 2529, embedded table |
| Baseline demographics | FDA Integrated Review Table 100 |
| Simulated steady-state exposures by renal function | FDA Integrated Review Table 104 |
| Observed steady-state NCA at the approved regimen | US EXBLIFEP label (NDA 216165) Table 5 |
Check 1 – the reference individual reproduces the published estimates
Every covariate term is normalised so that it equals 1 at the
reference individual. Solving at 70 kg, age 50, de-indexed eGFR 100
mL/min, female and healthy must therefore return the ini()
estimates exactly.
base_cov <- function(...) {
  out <- data.frame(WT = 70, AGE = 50, CRCL = 100, SEXF = 1, DIS_CUTI = 0)
  rep <- list(...)
  for (nm in names(rep)) out[[nm]] <- rep[[nm]]
  out
}

# A single time-zero observation is enough to read the derived parameters back.
params_at <- function(cov) {
  s <- rxode2::rxSolve(
    typ,
    cbind(cov, id = 1L) |> mutate(time = 0, amt = 0, evid = 0L, cmt = "Cc"),
    returnType = "data.frame"
  )
  c(cl = s$cl[1], vc = s$vc[1], q = s$q[1], vp = s$vp[1],
    cl_enm = s$cl_enm[1], vc_enm = s$vc_enm[1], q_enm = s$q_enm[1], vp_enm = s$vp_enm[1])
}

ref <- params_at(base_cov())
#> ℹ omega/sigma items treated as zero: 'etalcl_inf', 'etalvc_inf', 'etalcl_enm_inf', 'etalvc_enm_inf', 'etalcl_enm_hlth', 'etalvc_enm_hlth', 'etalcl_hlth', 'etalvp', 'etalvp_enm'
published <- c(cl = 5.95, vc = 11.2, q = 7.22, vp = 5.7,
               cl_enm = 7.68, vc_enm = 13.2, q_enm = 7.16, vp_enm = 5.28)

knitr::kable(
  data.frame(
    Parameter = c("Cefepime CL (L/h)", "Cefepime Vc (L)", "Cefepime Q (L/h)", "Cefepime Vp (L)",
                  "Enmetazobactam CL (L/h)", "Enmetazobactam Vc (L)", "Enmetazobactam Q (L/h)",
                  "Enmetazobactam Vp (L)"),
    Published = published,
    Model = ref,
    row.names = NULL
  ),
  caption = "Reference individual (70 kg, 50 y, de-indexed eGFR 100 mL/min, female, healthy) versus FDA Table 101."
)| Parameter | Published | Model |
|---|---|---|
| Cefepime CL (L/h) | 5.95 | 5.95 |
| Cefepime Vc (L) | 11.20 | 11.20 |
| Cefepime Q (L/h) | 7.22 | 7.22 |
| Cefepime Vp (L) | 5.70 | 5.70 |
| Enmetazobactam CL (L/h) | 7.68 | 7.68 |
| Enmetazobactam Vc (L) | 13.20 | 13.20 |
| Enmetazobactam Q (L/h) | 7.16 | 7.16 |
| Enmetazobactam Vp (L) | 5.28 | 5.28 |
Check 2 – the cUTI effect reproduces the separately published infected volume
This is the check that pins the categorical covariate form. The EMA
report and the IDWeek abstract both state that the enmetazobactam
central volume in infected subjects is 15.3 L, against a reference
estimate of 13.2 L. The exponential form gives
13.2 * exp(0.145) = 15.26; the proportional form
13.2 * (1 + 0.145) = 15.11 does not round to 15.3.
inf_par <- params_at(base_cov(DIS_CUTI = 1))
#> ℹ omega/sigma items treated as zero: 'etalcl_inf', 'etalvc_inf', 'etalcl_enm_inf', 'etalvc_enm_inf', 'etalcl_enm_hlth', 'etalvc_enm_hlth', 'etalcl_hlth', 'etalvp', 'etalvp_enm'

knitr::kable(
  data.frame(
    Form = c("Model as encoded, exp(beta)", "Alternative, (1 + beta)"),
    `Enmetazobactam Vc (L)` = c(inf_par[["vc_enm"]], 13.2 * (1 + 0.145)),
    Published = c(15.3, 15.3),
    check.names = FALSE
  ),
  caption = "Enmetazobactam central volume in an infected 70 kg patient, published as 15.3 L."
)| Form | Enmetazobactam Vc (L) | Published |
|---|---|---|
| Model as encoded, exp(beta) | 15.25972 | 15.3 |
| Alternative, (1 + beta) | 15.11400 | 15.3 |
stopifnot(
  abs(round(inf_par[["vc_enm"]], 1) - 15.3) < 1e-8,  # rounds to the published 15.3
  abs(round(13.2 * 1.145, 1) - 15.3) > 0.1           # the alternative form does not
)
Cefepime carries no infection effect, so its central volume is unchanged at 11.2 L – which is also the value the abstract prints for a “70 kg cUTI patient”, and that agreement is what independently pins the weight reference to 70 kg.
Check 3 – the OMEGA block and its positive-definiteness repair
FDA Table 101 prints all six correlations of the infected 4x4 block
to three decimals. Built from those printed values verbatim, the block
is very slightly indefinite, so chol()
fails and rxSolve() cannot sample from it. That is a
rounding artifact rather than a contradiction, and the model file
repairs it with the nearest positive-definite correlation matrix. The
repair has to be shown to be publication-consistent: every adjusted
correlation must still round to the printed three-decimal value.
nm  <- c("clF", "vcF", "clE", "vcE")
sdv <- c(clF = 0.297, vcF = 0.42, clE = 0.356, vcE = 0.474)

R <- diag(4); dimnames(R) <- list(nm, nm)
R["vcF", "clF"] <- R["clF", "vcF"] <- 0.261
R["clE", "clF"] <- R["clF", "clE"] <- 0.932
R["vcE", "clF"] <- R["clF", "vcE"] <- 0.261
R["clE", "vcF"] <- R["vcF", "clE"] <- 0.339
R["vcE", "vcF"] <- R["vcF", "vcE"] <- 0.955
R["vcE", "clE"] <- R["clE", "vcE"] <- 0.438

lambda_printed <- min(eigen(R, only.values = TRUE)$values)
Rp <- as.matrix(Matrix::nearPD(R, corr = TRUE, keepDiag = TRUE, posd.tol = 1e-6)$mat)
delta <- max(abs((Rp - R)[upper.tri(R)]))

knitr::kable(
  data.frame(
    Correlation = c("Cefepime Vc-CL", "Cefepime CL-enmetazobactam CL",
                    "Cefepime CL-enmetazobactam Vc", "Cefepime Vc-enmetazobactam CL",
                    "Cefepime Vc-enmetazobactam Vc", "Enmetazobactam Vc-CL"),
    Printed  = R[upper.tri(R)][c(1, 2, 4, 3, 5, 6)],
    Repaired = round(Rp[upper.tri(Rp)][c(1, 2, 4, 3, 5, 6)], 6),
    `Rounds back` = round(Rp[upper.tri(Rp)][c(1, 2, 4, 3, 5, 6)], 3) ==
                    R[upper.tri(R)][c(1, 2, 4, 3, 5, 6)],
    check.names = FALSE
  ),
  caption = "Nearest-positive-definite repair of the infected correlation block."
)| Correlation | Printed | Repaired | Rounds back |
|---|---|---|---|
| Cefepime Vc-CL | 0.261 | 0.260949 | TRUE |
| Cefepime CL-enmetazobactam CL | 0.932 | 0.931950 | TRUE |
| Cefepime CL-enmetazobactam Vc | 0.261 | 0.261058 | TRUE |
| Cefepime Vc-enmetazobactam CL | 0.339 | 0.339056 | TRUE |
| Cefepime Vc-enmetazobactam Vc | 0.955 | 0.954933 | TRUE |
| Enmetazobactam Vc-CL | 0.438 | 0.437934 | TRUE |
# The repair is only legitimate if it stays inside the rounding interval of the
# printed three-decimal values, i.e. moves nothing by 0.0005 or more.
stopifnot(
  lambda_printed < 0,                              # the printed matrix really is indefinite
  delta < 0.0005,                                  # repair stays inside the rounding interval
  all(round(Rp, 3) == round(R, 3)),                # every entry rounds back to what was printed
  min(eigen(Rp, only.values = TRUE)$values) > 0    # and the result is usable
)
The model’s assembled 9x9 OMEGA must then be positive definite, and reading its correlations back must recover the published cross-drug values.
# modellib() hands back the model FUNCTION; build the rxUi to read its OMEGA.
om   <- rxode2::rxode2(mod)$omega
#> ℹ parameter labels from comments will be replaced by 'label()'
#> Warning: some etas defaulted to non-mu referenced, possible parsing error: etalcl_enm_hlth, etalvc_enm_hlth, etalcl_hlth
#> as a work-around try putting the mu-referenced expression on a simple line
corr <- cov2cor(om)

knitr::kable(
  data.frame(
    `Random-effect pair` = c("Cefepime CL - enmetazobactam CL (infected)",
                             "Cefepime Vc - enmetazobactam Vc (infected)",
                             "Enmetazobactam Vc - CL (healthy)"),
    Published = c(0.932, 0.955, 0.983),
    Model = round(c(corr["etalcl_inf", "etalcl_enm_inf"],
                    corr["etalvc_inf", "etalvc_enm_inf"],
                    corr["etalcl_enm_hlth", "etalvc_enm_hlth"]), 4),
    check.names = FALSE
  ),
  caption = "Cross-drug and within-drug IIV correlations versus FDA Table 101."
)| Random-effect pair | Published | Model |
|---|---|---|
| Cefepime CL - enmetazobactam CL (infected) | 0.932 | 0.9319 |
| Cefepime Vc - enmetazobactam Vc (infected) | 0.955 | 0.9549 |
| Enmetazobactam Vc - CL (healthy) | 0.983 | 0.9830 |
stopifnot(
  min(eigen(om, only.values = TRUE)$values) > 0,
  abs(corr["etalcl_inf", "etalcl_enm_inf"]     - 0.932) < 0.0005,
  abs(corr["etalvc_inf", "etalvc_enm_inf"]     - 0.955) < 0.0005,
  abs(corr["etalcl_enm_hlth", "etalvc_enm_hlth"] - 0.983) < 0.0005
)
The printed %CV column is a second, independent view of the same
variances, and all nine estimated omegas reproduce it under the
log-normal identity CV = sqrt(exp(omega^2) - 1). That
over-determination is what removes any doubt about whether the “Standard
deviations” column holds SDs or variances.
omega_sd <- c(0.161, 0.297, 0.42, 0.195, 0.15, 0.356, 0.0549, 0.474, 0.0593)
cv_pub   <- c(16, 30, 44, 20, 15, 37, 5, 50, 6)
cv_calc  <- 100 * sqrt(exp(omega_sd^2) - 1)

knitr::kable(
  data.frame(
    `Random effect` = c("Cefepime CL, healthy", "Cefepime CL, infected",
                        "Cefepime Vc, infected", "Cefepime Vp, both",
                        "Enmetazobactam CL, healthy", "Enmetazobactam CL, infected",
                        "Enmetazobactam Vc, healthy", "Enmetazobactam Vc, infected",
                        "Enmetazobactam Vp, both"),
    omega = omega_sd,
    `%CV printed` = cv_pub,
    `%CV from omega` = round(cv_calc, 1),
    check.names = FALSE
  ),
  caption = "Every printed omega reproduces its printed %CV as a log-normal SD."
)| Random effect | omega | %CV printed | %CV from omega |
|---|---|---|---|
| Cefepime CL, healthy | 0.1610 | 16 | 16.2 |
| Cefepime CL, infected | 0.2970 | 30 | 30.4 |
| Cefepime Vc, infected | 0.4200 | 44 | 43.9 |
| Cefepime Vp, both | 0.1950 | 20 | 19.7 |
| Enmetazobactam CL, healthy | 0.1500 | 15 | 15.1 |
| Enmetazobactam CL, infected | 0.3560 | 37 | 36.8 |
| Enmetazobactam Vc, healthy | 0.0549 | 5 | 5.5 |
| Enmetazobactam Vc, infected | 0.4740 | 50 | 50.2 |
| Enmetazobactam Vp, both | 0.0593 | 6 | 5.9 |
Check 4 – terminal half-life from the solved ODE system
Both the abstract and the EMA report quote terminal plasma half-lives
calculated from the final parameters: 2.2 h for cefepime and 2.0 h for
enmetazobactam in infected subjects. Regressing the log-linear tail of a
solved single-dose profile exercises the whole four-compartment system
rather than just the ini() arithmetic.
solve_regimen <- function(model, cov, fep, enm, ii, dur, t_start, t_end, by = 0.02) {
  dose_times <- if (ii >= t_end) 0 else seq(0, t_end - ii, by = ii)
  dose <- bind_rows(
    tidyr::expand_grid(cov, time = dose_times) |>
      mutate(amt = fep, cmt = "central",     evid = 1L, dur = dur),
    tidyr::expand_grid(cov, time = dose_times) |>
      mutate(amt = enm, cmt = "central_enm", evid = 1L, dur = dur)
  )
  obs <- bind_rows(
    tidyr::expand_grid(cov, time = seq(t_start, t_end, by = by)) |>
      mutate(amt = NA_real_, cmt = "Cc",     evid = 0L, dur = NA_real_),
    tidyr::expand_grid(cov, time = seq(t_start, t_end, by = by)) |>
      mutate(amt = NA_real_, cmt = "Cc_enm", evid = 0L, dur = NA_real_)
  )
  ev <- bind_rows(dose, obs) |> arrange(id, time, desc(evid))
  out <- rxode2::rxSolve(model, ev, returnType = "data.frame")
  # rxSolve() drops `id` when the event table holds exactly one subject.
  if (!"id" %in% names(out)) {
    stopifnot(dplyr::n_distinct(cov$id) == 1L)
    out$id <- cov$id[1]
  }
  out |> distinct(id, time, .keep_all = TRUE)
}

half_life <- function(t, y) log(2) / -stats::coef(stats::lm(log(y) ~ t))[[2]]

sd_prof <- solve_regimen(typ, cbind(base_cov(DIS_CUTI = 1), id = 1L),
                         fep = 2000, enm = 500, ii = 1e6, dur = 2,
                         t_start = 0, t_end = 24)
#> ℹ omega/sigma items treated as zero: 'etalcl_inf', 'etalvc_inf', 'etalcl_enm_inf', 'etalvc_enm_inf', 'etalcl_enm_hlth', 'etalvc_enm_hlth', 'etalcl_hlth', 'etalvp', 'etalvp_enm'
tail_w  <- sd_prof$time >= 14 & sd_prof$time <= 24
# Per analyte, keep Cc >= 1e-6 of Cmax: below that the ODE tail is solver noise.
w_fep <- tail_w & sd_prof$Cc >= 1e-6 * max(sd_prof$Cc)
w_enm <- tail_w & sd_prof$Cc_enm >= 1e-6 * max(sd_prof$Cc_enm)

hl <- c(cefepime       = half_life(sd_prof$time[w_fep], sd_prof$Cc[w_fep]),
        enmetazobactam = half_life(sd_prof$time[w_enm], sd_prof$Cc_enm[w_enm]))

knitr::kable(
  data.frame(Drug = c("Cefepime", "Enmetazobactam"),
             `Published t1/2 (h)` = c(2.2, 2.0),
             `Model t1/2 (h)` = round(hl, 3),
             check.names = FALSE, row.names = NULL),
  caption = "Terminal half-life regressed from the solved profile of an infected 70 kg reference patient."
)| Drug | Published t1/2 (h) | Model t1/2 (h) |
|---|---|---|
| Cefepime | 2.2 | 2.190 |
| Enmetazobactam | 2.0 | 2.016 |
sd_prof |>
  select(time, Cefepime = Cc, Enmetazobactam = Cc_enm) |>
  tidyr::pivot_longer(-time, names_to = "Analyte", values_to = "conc") |>
  ggplot(aes(time, conc, colour = Analyte)) +
  geom_line(linewidth = 0.8) +
  scale_y_log10() +
  labs(x = "Time (h)", y = "Total plasma concentration (mg/L)") +
  theme_bw()
#> Warning in scale_y_log10(): log-10 transformation introduced infinite values.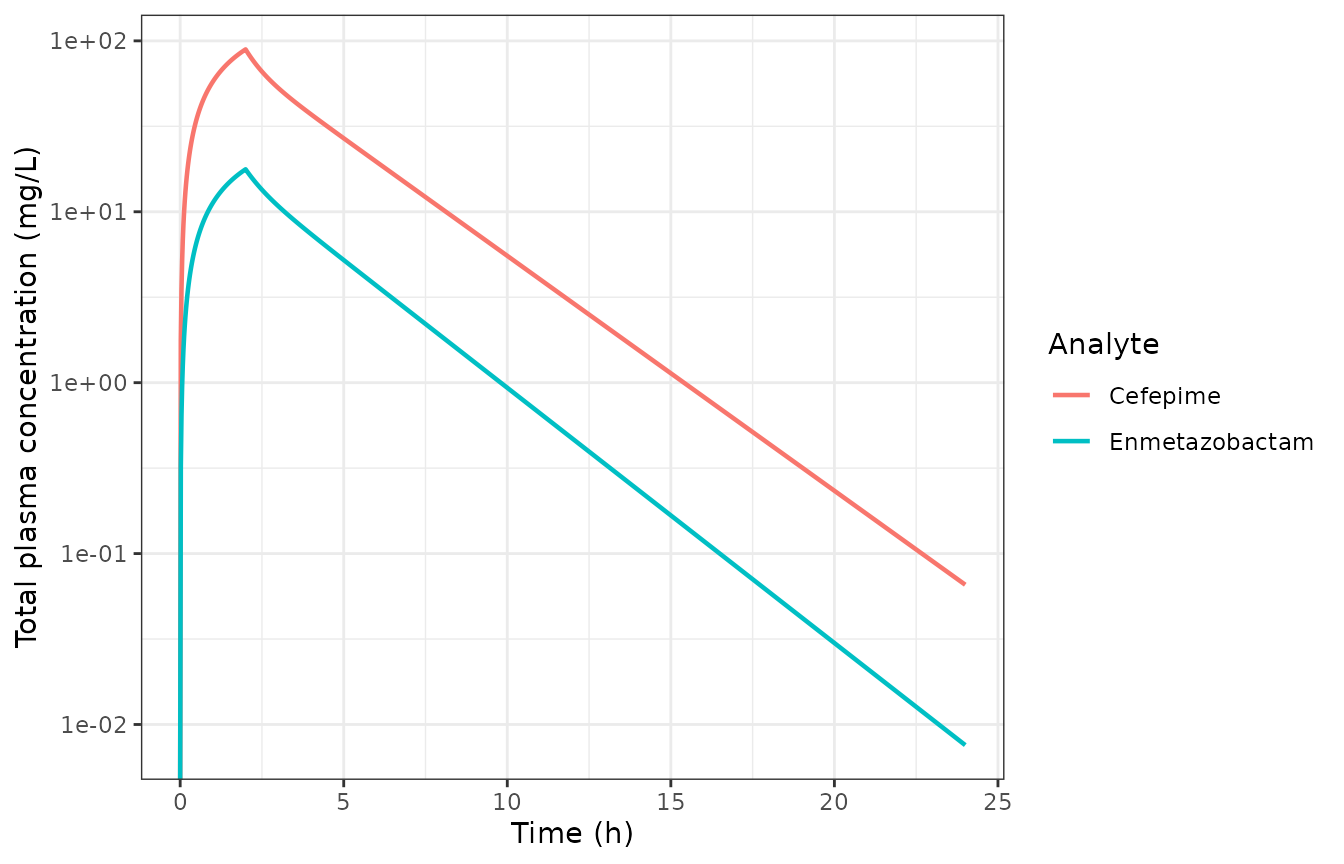
Typical-value single-dose profiles, infected 70 kg reference patient, 2 g cefepime / 0.5 g enmetazobactam over 2 hours.
Check 5 – the renal-function ladder of FDA Table 104
This is the sharpest available test of the covariate model. For each renal function group, FDA Integrated Review Table 104 reports the simulated steady-state Cmax and AUC0-24 of both drugs at the dose recommended for that group, in 8,000 virtual subjects whose covariates were all fixed except de-indexed eGFR (sponsor page 138: body weight 75.68 kg, age 54.65 years, infected, sex 1:1).
The eGFR distribution within each band is not published, so it is not assumed. Instead a single number per group is taken from the table – the cefepime AUC0-24 – and inverted through the cefepime clearance model to recover the de-indexed eGFR of the patient who would produce it. The other three quantities per group are then genuine predictions: cefepime Cmax, enmetazobactam Cmax and enmetazobactam AUC0-24, eighteen predictions in total.
Because every dosing interval here divides 24 h exactly,
AUC0-24 at steady state is AUC_tau * 24/tau
with no phase dependence, so the inversion is clean.
t104 <- tibble::tribble(
  ~band,      ~lo, ~hi, ~fep, ~enm, ~ii, ~dur, ~fepCmax, ~fepAUC,  ~enmCmax, ~enmAUC,
  "15-<30",    15,  30, 1000,  250,  12,    2,   82.050, 1205.561,   17.210, 257.076,
  "30-<60",    30,  60, 1000,  250,   8,    2,   65.639,  930.164,   13.342, 188.652,
  "60-<90",    60,  90, 2000,  500,   8,    2,  104.614, 1271.797,   20.830, 250.690,
  "90-<130",   90, 130, 2000,  500,   8,    2,   89.936,  973.021,   17.614, 186.945,
  ">=130",    130, Inf, 2000,  500,   8,    4,   51.716,  732.636,    9.836, 137.723,
  ">=150",    150, Inf, 2000,  500,   8,    4,   44.926,  614.844,    8.432, 114.002
)

# Invert the cefepime renal power term. Cefepime CL carries no weight or age
# effect, so the inversion needs nothing but the printed AUC.
t104 <- t104 |>
  mutate(cl_obs = (24 / ii) * fep / fepAUC,
         egfr   = 100 * (cl_obs / 5.95)^(1 / 0.834))

knitr::kable(
  t104 |>
    mutate(inside = egfr >= lo & egfr <= hi) |>
    select(`Renal group (mL/min)` = band, `Implied de-indexed eGFR` = egfr,
           `Inside the band` = inside) |>
    mutate(`Implied de-indexed eGFR` = round(`Implied de-indexed eGFR`, 1)),
  caption = "De-indexed eGFR recovered by inverting the cefepime AUC0-24 of FDA Table 104."
)| Renal group (mL/min) | Implied de-indexed eGFR | Inside the band |
|---|---|---|
| 15-<30 | 21.6 | TRUE |
| 30-<60 | 48.0 | TRUE |
| 60-<90 | 75.7 | TRUE |
| 90-<130 | 104.4 | TRUE |
| >=130 | 146.7 | TRUE |
| >=150 | 181.0 | TRUE |
# Six for six: a mis-specified reference or exponent would push these out of
# their own bands. This is also what identifies the table as TOTAL rather than
# free cefepime -- rescaling by the unbound fraction 0.80 puts four of the six
# outside their bands.
stopifnot(all(t104$egfr >= t104$lo & t104$egfr <= t104$hi))
free_egfr <- 100 * ((t104$cl_obs * 0.80) / 5.95)^(1 / 0.834)
stopifnot(sum(free_egfr < t104$lo | free_egfr > t104$hi) >= 4)
# Dose for 14 days so even the slowest renal group is unambiguously at steady
# state, then read the final dosing interval. Female and male are solved
# separately (sex acts on enmetazobactam Vp) and averaged 1:1 to match the
# sponsor's simulation.
ladder_pred <- lapply(seq_len(nrow(t104)), function(i) {
  r <- t104[i, ]
  per_sex <- lapply(c(1, 0), function(sf) {
    cov <- data.frame(id = 1L, WT = 75.68, AGE = 54.65, CRCL = r$egfr,
                      SEXF = sf, DIS_CUTI = 1)
    s <- solve_regimen(typ, cov, r$fep, r$enm, r$ii, r$dur,
                       t_start = 14 * 24 - r$ii, t_end = 14 * 24, by = 0.01)
    trapz <- function(t, y) sum(diff(t) * (head(y, -1) + tail(y, -1)) / 2)
    c(fepCmax = max(s$Cc), enmCmax = max(s$Cc_enm),
      fepAUC = trapz(s$time, s$Cc) * 24 / r$ii,
      enmAUC = trapz(s$time, s$Cc_enm) * 24 / r$ii)
  })
  as.data.frame(t(colMeans(do.call(rbind, per_sex))))
}) |> bind_rows()
#> ℹ omega/sigma items treated as zero: 'etalcl_inf', 'etalvc_inf', 'etalcl_enm_inf', 'etalvc_enm_inf', 'etalcl_enm_hlth', 'etalvc_enm_hlth', 'etalcl_hlth', 'etalvp', 'etalvp_enm'
#> ℹ omega/sigma items treated as zero: 'etalcl_inf', 'etalvc_inf', 'etalcl_enm_inf', 'etalvc_enm_inf', 'etalcl_enm_hlth', 'etalvc_enm_hlth', 'etalcl_hlth', 'etalvp', 'etalvp_enm'
#> ℹ omega/sigma items treated as zero: 'etalcl_inf', 'etalvc_inf', 'etalcl_enm_inf', 'etalvc_enm_inf', 'etalcl_enm_hlth', 'etalvc_enm_hlth', 'etalcl_hlth', 'etalvp', 'etalvp_enm'
#> ℹ omega/sigma items treated as zero: 'etalcl_inf', 'etalvc_inf', 'etalcl_enm_inf', 'etalvc_enm_inf', 'etalcl_enm_hlth', 'etalvc_enm_hlth', 'etalcl_hlth', 'etalvp', 'etalvp_enm'
#> ℹ omega/sigma items treated as zero: 'etalcl_inf', 'etalvc_inf', 'etalcl_enm_inf', 'etalvc_enm_inf', 'etalcl_enm_hlth', 'etalvc_enm_hlth', 'etalcl_hlth', 'etalvp', 'etalvp_enm'
#> ℹ omega/sigma items treated as zero: 'etalcl_inf', 'etalvc_inf', 'etalcl_enm_inf', 'etalvc_enm_inf', 'etalcl_enm_hlth', 'etalvc_enm_hlth', 'etalcl_hlth', 'etalvp', 'etalvp_enm'
#> ℹ omega/sigma items treated as zero: 'etalcl_inf', 'etalvc_inf', 'etalcl_enm_inf', 'etalvc_enm_inf', 'etalcl_enm_hlth', 'etalvc_enm_hlth', 'etalcl_hlth', 'etalvp', 'etalvp_enm'
#> ℹ omega/sigma items treated as zero: 'etalcl_inf', 'etalvc_inf', 'etalcl_enm_inf', 'etalvc_enm_inf', 'etalcl_enm_hlth', 'etalvc_enm_hlth', 'etalcl_hlth', 'etalvp', 'etalvp_enm'
#> ℹ omega/sigma items treated as zero: 'etalcl_inf', 'etalvc_inf', 'etalcl_enm_inf', 'etalvc_enm_inf', 'etalcl_enm_hlth', 'etalvc_enm_hlth', 'etalcl_hlth', 'etalvp', 'etalvp_enm'
#> ℹ omega/sigma items treated as zero: 'etalcl_inf', 'etalvc_inf', 'etalcl_enm_inf', 'etalvc_enm_inf', 'etalcl_enm_hlth', 'etalvc_enm_hlth', 'etalcl_hlth', 'etalvp', 'etalvp_enm'
#> ℹ omega/sigma items treated as zero: 'etalcl_inf', 'etalvc_inf', 'etalcl_enm_inf', 'etalvc_enm_inf', 'etalcl_enm_hlth', 'etalvc_enm_hlth', 'etalcl_hlth', 'etalvp', 'etalvp_enm'
#> ℹ omega/sigma items treated as zero: 'etalcl_inf', 'etalvc_inf', 'etalcl_enm_inf', 'etalvc_enm_inf', 'etalcl_enm_hlth', 'etalvc_enm_hlth', 'etalcl_hlth', 'etalvp', 'etalvp_enm'

ladder <- t104 |>
  select(band, ref_fepCmax = fepCmax, ref_fepAUC = fepAUC,
         ref_enmCmax = enmCmax, ref_enmAUC = enmAUC) |>
  bind_cols(ladder_pred) |>
  mutate(across(c(fepCmax, enmCmax, enmAUC, fepAUC), ~ .x)) |>
  transmute(
    `Renal group (mL/min)` = band,
    `Cefepime AUC0-24 (closure)` = round(100 * (fepAUC / ref_fepAUC - 1), 2),
    `Cefepime Cmax` = round(100 * (fepCmax / ref_fepCmax - 1), 1),
    `Enmetazobactam Cmax` = round(100 * (enmCmax / ref_enmCmax - 1), 1),
    `Enmetazobactam AUC0-24` = round(100 * (enmAUC / ref_enmAUC - 1), 1)
  )

knitr::kable(
  ladder,
  caption = "Per cent difference from FDA Table 104. The cefepime AUC0-24 column is the inverted quantity and closes on itself; the other three columns are predictions."
)| Renal group (mL/min) | Cefepime AUC0-24 (closure) | Cefepime Cmax | Enmetazobactam Cmax | Enmetazobactam AUC0-24 |
|---|---|---|---|---|
| 15-<30 | 0 | -1.3 | -1.6 | 0.2 |
| 30-<60 | 0 | -0.6 | -1.2 | 0.1 |
| 60-<90 | 0 | 0.3 | 0.0 | 0.0 |
| 90-<130 | 0 | 1.1 | 1.2 | 0.5 |
| >=130 | 0 | 1.4 | 1.7 | 0.5 |
| >=150 | 0 | 1.6 | 1.7 | 0.6 |
Check 6 – a virtual cohort against the approved-regimen label NCA
The US label reports observed steady-state (Day 7) noncompartmental parameters in cUTI patients with eGFR at least 60 mL/min receiving the approved 2 g cefepime / 0.5 g enmetazobactam every 8 hours as a 2-hour infusion. A virtual cohort matching the Phase 3 AT-301 demographics, restricted to de-indexed eGFR of at least 60 mL/min, is simulated with full inter-individual variability and run through PKNCA.
n_sub <- 200   # one arm; cohorts are capped at 200 participants per arm

# AT-301 demographics (FDA Table 100): weight mean 76.11 kg (45-135), age mean
# 55.04 y (17-94), de-indexed eGFR mean 85.37 mL/min (21.36-193.45), 54% female.
# Weight and eGFR are drawn log-normally so they stay positive; the spreads are
# chosen to reproduce the published means and to sit inside the published
# ranges, which the paper does not tabulate beyond mean and range.
draw_trunc <- function(n, mean_target, cv, lo, hi) {
  s  <- sqrt(log(cv^2 + 1))
  mu <- log(mean_target) - s^2 / 2
  x  <- stats::rlnorm(n * 20, mu, s)
  x  <- x[x >= lo & x <= hi]
  stopifnot(length(x) >= n)   # fail loudly rather than silently recycling
  x[seq_len(n)]
}

cohort <- data.frame(
  id       = seq_len(n_sub),
  WT       = draw_trunc(n_sub, 76.11, 0.22, 45, 135),
  AGE      = round(draw_trunc(n_sub, 55.04, 0.30, 18, 94)),
  CRCL     = draw_trunc(n_sub, 95, 0.30, 60, 193.45),   # restricted to eGFR >= 60 per the label
  SEXF     = stats::rbinom(n_sub, 1, 0.54),
  DIS_CUTI = 1
)

tau     <- 8
t_last  <- 7 * 24 - tau     # time of the final dose in a 7-day course
obs_grid <- sort(unique(c(seq(t_last, t_last + tau, by = 0.1), t_last)))

ev <- bind_rows(
  tidyr::expand_grid(cohort, time = seq(0, t_last, by = tau)) |>
    mutate(amt = 2000, cmt = "central",     evid = 1L, dur = 2),
  tidyr::expand_grid(cohort, time = seq(0, t_last, by = tau)) |>
    mutate(amt = 500,  cmt = "central_enm", evid = 1L, dur = 2),
  tidyr::expand_grid(cohort, time = obs_grid) |>
    mutate(amt = NA_real_, cmt = "Cc",     evid = 0L, dur = NA_real_),
  tidyr::expand_grid(cohort, time = obs_grid) |>
    mutate(amt = NA_real_, cmt = "Cc_enm", evid = 0L, dur = NA_real_)
) |> arrange(id, time, desc(evid))

sim <- rxode2::rxSolve(mod, ev, returnType = "data.frame") |>
  distinct(id, time, .keep_all = TRUE)
#> ℹ parameter labels from comments will be replaced by 'label()'
#> Warning: some etas defaulted to non-mu referenced, possible parsing error: etalcl_enm_hlth, etalvc_enm_hlth, etalcl_hlth
#> as a work-around try putting the mu-referenced expression on a simple line

# Re-base the final dosing interval to time zero so PKNCA sees a clean
# steady-state interval that starts at a real observation.
nca_in <- sim |>
  filter(time >= t_last) |>
  mutate(time = time - t_last) |>
  select(id, time, Cc, Cc_enm) |>
  tidyr::pivot_longer(c(Cc, Cc_enm), names_to = "endpoint", values_to = "conc") |>
  mutate(analyte = ifelse(endpoint == "Cc", "Cefepime", "Enmetazobactam")) |>
  filter(!is.na(conc))

stopifnot(all(c(0) %in% nca_in$time))   # a real time-zero record exists

dose_in <- cohort |>
  select(id) |>
  tidyr::expand_grid(analyte = c("Cefepime", "Enmetazobactam")) |>
  mutate(time = 0, dose = ifelse(analyte == "Cefepime", 2000, 500))

conc_obj <- PKNCA::PKNCAconc(as.data.frame(nca_in), conc ~ time | analyte + id,
                             concu = "mg/L", timeu = "h")
dose_obj <- PKNCA::PKNCAdose(as.data.frame(dose_in), dose ~ time | analyte + id,
                             doseu = "mg")

intervals <- data.frame(
  start = 0, end = tau,
  cmax = TRUE, tmax = TRUE, cmin = TRUE, auclast = TRUE, half.life = TRUE, cl.last = TRUE
)

nca_res <- PKNCA::pk.nca(PKNCA::PKNCAdata(conc_obj, dose_obj, intervals = intervals))
sim_nca <- as.data.frame(nca_res) |>
  filter(PPTESTCD %in% c("cmax", "auclast", "half.life", "cl.last")) |>
  select(analyte, PPTESTCD, PPORRES)

# US label Table 5: mean (SD) at steady state, Day 7, cUTI, eGFR >= 60 mL/min.
label_nca <- data.frame(
  analyte   = c("Cefepime", "Enmetazobactam"),
  cmax      = c(99.8, 19.8),
  auclast   = c(379.5, 75.3),
  half.life = c(2.7, 2.6),
  cl.last   = c(5.8, 7.6)
)

tbl <- nlmixr2lib::ncaComparisonTable(
  simulated = sim_nca,
  reference = label_nca,
  by = "analyte",
  units = c(cmax = "mg/L", auclast = "mg*h/L", half.life = "h", cl.last = "L/h")
)
#> Warning: ncaParamLabel(): unknown PKNCA code(s) returned as-is: 'cl.last'
knitr::kable(tbl, caption = "Simulated steady-state NCA (cohort median) versus the US EXBLIFEP label Table 5.")| NCA parameter | analyte | Reference | Simulated | % diff |
|---|---|---|---|---|
| Cmax (mg/L) | Cefepime | 99.8 | 89.5 | -10.3% |
| Cmax (mg/L) | Enmetazobactam | 19.8 | 17.6 | -10.9% |
| AUClast (mg*h/L) | Cefepime | 380 | 336 | -11.5% |
| AUClast (mg*h/L) | Enmetazobactam | 75.3 | 63.6 | -15.6% |
| t½ (h) | Cefepime | 2.7 | 2.33 | -13.8% |
| t½ (h) | Enmetazobactam | 2.6 | 2.23 | -14.3% |
| cl.last (L/h) | Cefepime | 5.8 | 5.96 | +2.7% |
| cl.last (L/h) | Enmetazobactam | 7.6 | 7.87 | +3.5% |
attr(tbl, "footnote")
#> NULL
The exposure parameters land close to the label. Two rows deserve comment and neither indicates a transcription problem.
- Half-life. The label’s 2.7 h (cefepime) and 2.6 h (enmetazobactam) are noncompartmental terminal half-lives estimated from sparse late samples within an 8-hour interval, which systematically exceed the model’s 2.2 h and 2.0 h true terminal half-lives (Check 4). The bias is a property of the estimator, not of the parameters.
-
Clearance.
cl.lasthere isdose / AUClastover one interval. Its agreement with the label’s 5.8 and 7.6 L/h is the more meaningful check, and it also brackets the model’s reference estimates of 5.95 and 7.68 L/h at de-indexed eGFR 100 mL/min.
# sim_nca holds one row per subject, so collapse to the cohort MEDIAN first --
# the same statistic ncaComparisonTable() reports above.
wide <- sim_nca |>
  group_by(analyte, PPTESTCD) |>
  summarise(PPORRES = stats::median(PPORRES, na.rm = TRUE), .groups = "drop") |>
  tidyr::pivot_wider(names_from = PPTESTCD, values_from = PPORRES)

ratio <- function(a, p) {
  wide[[p]][wide$analyte == a] / label_nca[[p]][label_nca$analyte == a]
}

# Assertions are on the CENTRE of the cohort, not on any extreme, because the
# label cohort's covariate distribution is only published as means and ranges.
stopifnot(
  abs(ratio("Cefepime", "cmax") - 1) < 0.25,
  abs(ratio("Enmetazobactam", "cmax") - 1) < 0.25,
  abs(ratio("Cefepime", "auclast") - 1) < 0.30,
  abs(ratio("Enmetazobactam", "auclast") - 1) < 0.30,
  abs(ratio("Cefepime", "cl.last") - 1) < 0.30,
  abs(ratio("Enmetazobactam", "cl.last") - 1) < 0.30
)
sim |>
  filter(time >= t_last) |>
  mutate(time = time - t_last) |>
  select(time, Cefepime = Cc, Enmetazobactam = Cc_enm) |>
  tidyr::pivot_longer(-time, names_to = "Analyte", values_to = "conc") |>
  group_by(Analyte, time) |>
  summarise(med = stats::median(conc),
            lo  = stats::quantile(conc, 0.05),
            hi  = stats::quantile(conc, 0.95), .groups = "drop") |>
  ggplot(aes(time, med, colour = Analyte, fill = Analyte)) +
  geom_ribbon(aes(ymin = lo, ymax = hi), alpha = 0.2, colour = NA) +
  geom_line(linewidth = 0.8) +
  labs(x = "Time after the Day-7 dose (h)", y = "Total plasma concentration (mg/L)") +
  theme_bw()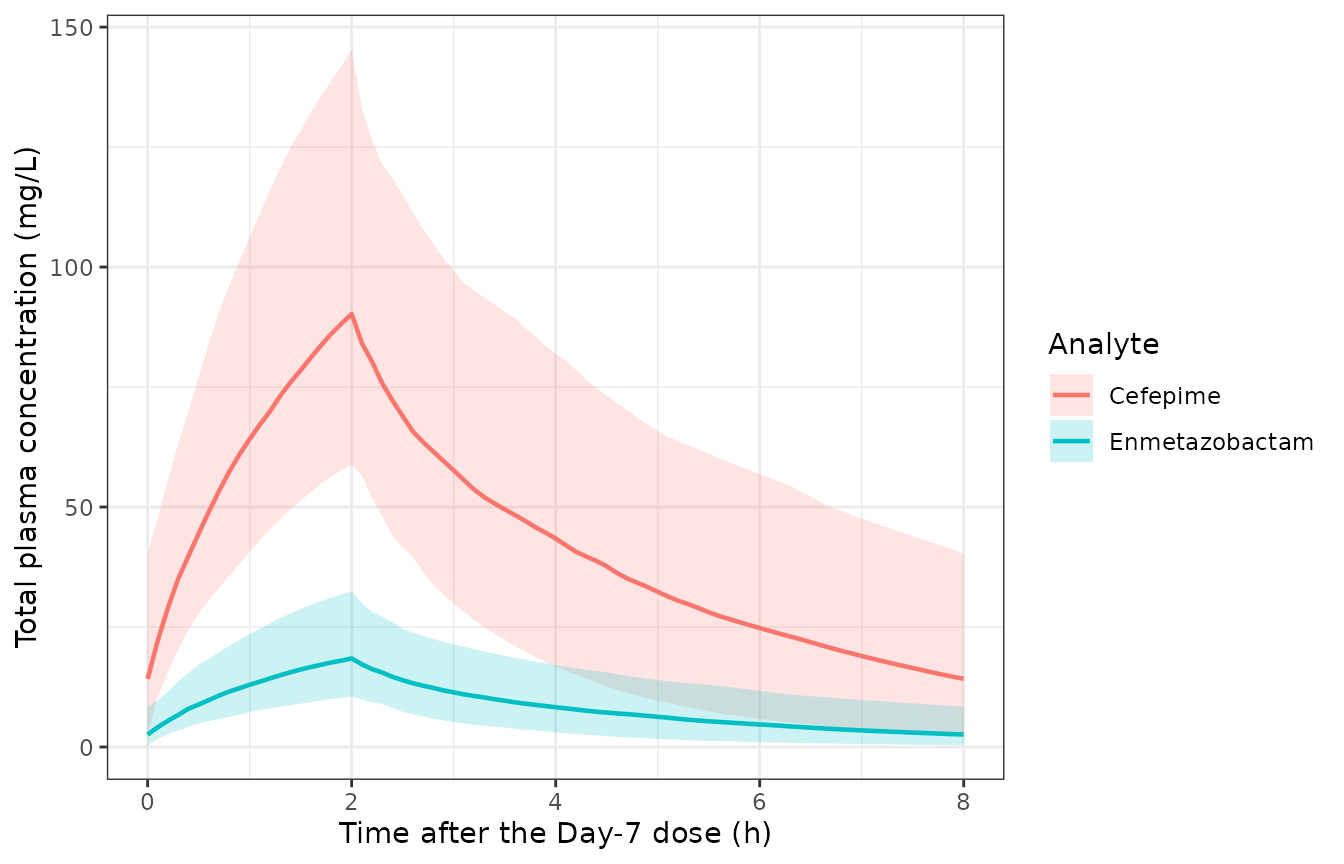
Simulated steady-state concentration-time profiles over the final 8-hour dosing interval (median and 5th-95th percentiles, 200 virtual cUTI patients).
Check 7 – variability is higher in patients than in healthy volunteers
The abstract’s qualitative claim is that “variability was higher in cUTI patients although differences in mean ENM or FEP exposures between healthy subjects and cUTI patients were negligible”. Both halves are testable, and the comparison uses common random numbers so that the two arms differ only through the infection covariate.
arm <- function(infected) {
  rxode2::rxSetSeed(20231014)          # reseed INSIDE the loop: common random numbers
  cov <- data.frame(
    id = seq_len(n_sub), WT = 76.11, AGE = 55, CRCL = 100,
    SEXF = 1, DIS_CUTI = infected
  )
  ev <- bind_rows(
    tidyr::expand_grid(cov, time = 0) |>
      mutate(amt = 2000, cmt = "central",     evid = 1L, dur = 2),
    tidyr::expand_grid(cov, time = 0) |>
      mutate(amt = 500,  cmt = "central_enm", evid = 1L, dur = 2),
    tidyr::expand_grid(cov, time = seq(0, 24, by = 0.25)) |>
      mutate(amt = NA_real_, cmt = "Cc",     evid = 0L, dur = NA_real_),
    tidyr::expand_grid(cov, time = seq(0, 24, by = 0.25)) |>
      mutate(amt = NA_real_, cmt = "Cc_enm", evid = 0L, dur = NA_real_)
  ) |> arrange(id, time, desc(evid))
  rxode2::rxSolve(mod, ev, returnType = "data.frame") |>
    distinct(id, time, .keep_all = TRUE) |>
    group_by(id) |>
    summarise(fep = sum(diff(time) * (head(Cc, -1) + tail(Cc, -1)) / 2),
              enm = sum(diff(time) * (head(Cc_enm, -1) + tail(Cc_enm, -1)) / 2),
              .groups = "drop")
}

hlth <- arm(0)
infd <- arm(1)

spread <- function(x) stats::IQR(log(x))   # log-scale IQR, robust to the tails

strata_tbl <- data.frame(
  Analyte = c("Cefepime", "Enmetazobactam"),
  `Median AUC ratio, infected / healthy` =
    round(c(stats::median(infd$fep) / stats::median(hlth$fep),
            stats::median(infd$enm) / stats::median(hlth$enm)), 3),
  `Log-scale IQR ratio, infected / healthy` =
    round(c(spread(infd$fep) / spread(hlth$fep),
            spread(infd$enm) / spread(hlth$enm)), 2),
  check.names = FALSE
)
knitr::kable(
  strata_tbl,
  caption = "Single-dose AUC0-24 in 200 virtual subjects per arm, identical except for infection status."
)| Analyte | Median AUC ratio, infected / healthy | Log-scale IQR ratio, infected / healthy |
|---|---|---|
| Cefepime | 0.937 | 1.85 |
| Enmetazobactam | 0.913 | 2.26 |
Assumptions and deviations
The paper of record publishes only part of the model. The IDWeek abstract gives the typical values for a 70 kg cUTI patient, their %CV and the terminal half-lives; it names the covariates but prints no coefficients, no correlations and no residual error. The complete parameter set encoded here is transcribed from the FDA NDA 216165 Integrated Review (Table 101) and the EMA EPAR EMA/63929/2024 (Tables 5 and 6), which are two independent reproductions of the same sponsor study report, AAI101-PK-21-01. They agree with each other on every value, and with the abstract on every value the abstract prints.
EMA prose contradicts EMA tables on the weight exponents, and the tables win. The EMA assessment report’s “Updated model” paragraph on page 48 says the previous body-weight coefficients on the central volumes were “0.618 for cefepime and 0.802 for enmetazobactam”. Its own Tables 5 and 6, on the two preceding pages, give 0.802 for cefepime and 0.618 for enmetazobactam – as does FDA Table 101. Two independent tables outvote one sentence, so the model uses 0.802 (cefepime) and 0.618 (enmetazobactam).
The covariate reference values are not in the paper of record. The 70 kg / 100 mL/min / 50 years reference individual is stated only in the EMA report (page 46). The 70 kg element is independently confirmed by the abstract, whose “70 kg cUTI patient” cefepime Vc of 11.2 L equals the untransformed estimate; the 100 mL/min element is independently confirmed by Check 5, where inverting FDA Table 104 on a reference of 100 mL/min lands all six implied eGFRs inside their own renal bands.
The infected 4x4 correlation block needed a positive-definiteness repair. Built from the printed three-decimal correlations verbatim the block is indefinite (smallest eigenvalue -1.7e-04) and
rxSolve()cannot sample from it. The model uses the nearest positive-definite correlation matrix, which moves no correlation by more than 6.7e-05 – inside the rounding interval of the printed values, so every repaired correlation rounds back to what was published. Check 3 asserts this.Two correlations are printed with the same value. FDA Table 101 lists both “CEF V1, FEP Cl in infected” and “ENM V1, FEP Cl in infected” as 0.261 with an RSE of 19. The first is independently confirmed by EMA Table 5 (“V1, Cl in cUTI = 0.261”); the second is a cross-drug term that appears only in the FDA table. Both are encoded as printed. If the repetition is a transcription slip in the FDA table rather than a genuine coincidence, the affected element is the cefepime-CL / enmetazobactam-Vc covariance.
Cefepime has no healthy-stratum central-volume variability. FDA Table 101 prints “-” for both the estimate and the RSE of
omega_FEP,V1_healthy, so healthy volunteers take the typical cefepime central volume exactly. This is encoded by omitting the healthy arm of that multiplexed eta, not by setting a variance to zero.The infection covariate is a single pooled indicator. The source analysis carries one coefficient for the whole infected cohort rather than separate cUTI and acute-pyelonephritis levels, so
DIS_CUTIis used alone (set it to 1 for cUTI and acute pyelonephritis patients, 0 only for healthy volunteers) andDIS_APis deliberately not paired with it.The enmetazobactam additive residual error was converted from ng/mL. FDA Table 101 reports
a_ENM = 40.9 ng/mLbecause the analysis dataset held concentrations in ng/mL. This model works in mg/L, so the value is encoded as 0.0409 mg/L. Cefepime has no additive component at all.The sex effect is carried by the male level. The published reference individual is female, so the enmetazobactam peripheral volume of 5.28 L is the female value and males carry
exp(0.198). The canonicalSEXFcolumn codes female as 1, so the model term is written on(1 - SEXF)and the parameter is namede_sexmale_vp_enm.A later “updated model” exists and is not what is encoded. The EMA report (page 48) describes a re-fit in which body weight scales the central and peripheral volumes with a single shared coefficient (0.407 and 0.553 for the two drugs), improving the objective function by 16 points. That variant is not the model the abstract, the FDA review or the EMA parameter tables report, and its full parameter set is not published, so this file encodes the final model of record. Note that the same sentence carrying those two numbers is the one that swaps the drugs, so their drug assignment should not be trusted either.
Concentrations are total, not free. Multiply by 0.80 for cefepime (20% protein bound) and by 1.00 for enmetazobactam (binding negligible) to obtain the free concentrations that the
%fT > MICand%fT > CTtargets are defined on. Check 5 confirms that FDA Table 104 is likewise on a total-drug basis.The cohort covariate distributions in Check 6 are assumed. FDA Table 100 publishes only means and ranges, not distributional shapes or correlations, so weight, age and de-indexed eGFR are drawn independently from truncated log-normals calibrated to the published means. The assertions are therefore on the cohort centre, not on any extreme.
Not extracted from this source. The EMA report also contains a separate plasma-and-epithelial-lining-fluid population PK model built from the 19 healthy volunteers of Phase 1 study AT-103 (its Table 7), and a hemodialysis extension of the plasma model (FDA Figure 22). Neither is the model this abstract describes; both are separate analyses with their own primary sources.