COX-2 inhibitor PGE2 decrease and pain relief (Thiel 2018)
Source:vignettes/articles/Thiel_2018_cox2_pge2_painrelief.Rmd
Thiel_2018_cox2_pge2_painrelief.RmdModel and source
- Citation: Thiel C, Smit I, Baier V, Cordes H, Fabry B, Blank LM, Kuepfer L. (2018). Using quantitative systems pharmacology to evaluate the drug efficacy of COX-2 and 5-LOX inhibitors in therapeutic situations. npj Systems Biology and Applications 4:28. doi:10.1038/s41540-018-0062-3. Observed pain relief: Hersh EV et al. Dose-ranging analgesic study of Prosorb diclofenac potassium in postsurgical dental pain. Clin Ther 2004;26:1215-1227.
- Article: https://doi.org/10.1038/s41540-018-0062-3 (open access; npj Systems Biology and Applications 4:28)
- Supplementary information (Tables S1-S4, Figures S1-S3): linked from the article page.
Thiel et al. (2018) coupled PK-Sim whole-body PBPK models of celecoxib, diclofenac, licofelone, zileuton and rifampicin to two published cellular network models: the arachidonic-acid metabolism network of Yang et al. (2007, PLoS Comput Biol 3:e55) and the rifampicin / PXR CYP3A4 induction model of Yamashita et al. (2013, PLoS One 8:e70330). The paper then related the predicted decrease in prostaglandin E2 (PGE2) to the pain relief observed in two post-oral-surgery trials, one of diclofenac and one of celecoxib, with a sigmoid Hill equation per drug.
This package holds those two exposure-response models:
mod_dfn <- readModelDb("Thiel_2018_diclofenac_painrelief")
mod_cel <- readModelDb("Thiel_2018_celecoxib_painrelief")- Diclofenac: Exposure-response model linking the predicted decrease in prostaglandin E2 (PGE2) to placebo-adjusted mean pain relief after oral diclofenac in adults with acute pain after oral (dental) surgery (Thiel 2018). Direct sigmoid Hill model without baseline: score = emax * x^hill / (ec50^hill + x^hill), where x = -PGE2_DELTA is the PGE2 decrease (umol/L) relative to the drug-free scenario and score is the mean pain relief score minus the placebo mean at the same time. Fit by least squares to arm-mean data pooled over 25, 50 and 100 mg and the 0-6 h time course (33 points); residual SD is the fit RMSE. The driver is supplied as a time-varying covariate: in the source it is the output of the Yang 2007 arachidonic-acid network model driven by a PK-Sim whole-body PBPK prediction of diclofenac in venous blood cells, and neither of those layers is part of this model. Arm-mean simulator; no inter-individual variability was estimated.
- Celecoxib: Exposure-response model linking the predicted decrease in prostaglandin E2 (PGE2) to placebo-adjusted mean pain relief after a single oral 400 mg dose of celecoxib in adults with acute pain after oral (dental) surgery (Thiel 2018). Direct sigmoid Hill model without baseline: score = emax * x^hill / (ec50^hill + x^hill), where x = -PGE2_DELTA is the PGE2 decrease (umol/L) relative to the drug-free scenario and score is the mean pain relief score minus the placebo mean at the same time. Fit by least squares to the arm-mean 0-6 h time course (11 points); residual SD is the fit RMSE. The driver is supplied as a time-varying covariate: in the source it is the output of the Yang 2007 arachidonic-acid network model driven by a PK-Sim whole-body PBPK prediction of celecoxib in venous blood cells, and neither of those layers is part of this model. Arm-mean simulator; no inter-individual variability was estimated.
The PBPK models and the cellular network are not part of this
package. The PBPK models were built in PK-Sim, whose organ volumes,
blood flows, tissue partition coefficients and enzyme abundances come
from the software’s database rather than from the paper; the cellular
network is the Yang 2007 model used unchanged. The pain-relief models
therefore take the PGE2 change as an input, the time-varying covariate
PGE2_DELTA (drug-treated minus drug-free PGE2, umol/L,
negative for a decrease). Inside the model the paper’s
positive-for-suppression axis is recovered as
pge2_decr <- -PGE2_DELTA.
Population
The PGE2 trajectories were simulated for one PBPK reference individual, a European man of 73 kg aged 30 years, after a dissolved oral dose (Thiel 2018 Methods). The pain relief data came from two trials in moderate-to-severe pain after oral (dental) surgery (Thiel 2018 Methods, Correlation of predicted decrease in prostaglandin formation with pain relief):
- Diclofenac potassium 25, 50 and 100 mg single oral doses, 197 patients (n = 63, 68 and 66), Hersh et al. 2004 (Thiel 2018 reference 27).
- Celecoxib 400 mg single oral dose, 57 patients, Cheung et al. 2007 (Thiel 2018 reference 26).
Each fit used the arm-mean pain relief score at 0, 0.25, 0.5, 0.75, 1, 1.5, 2, 3, 4, 5 and 6 h minus the placebo-arm mean at the same time. The models are arm-mean models; no between-subject variability was estimated.
str(mod_dfn()$population)
#> List of 6
#>  $ species      : chr "human"
#>  $ n_subjects   : int 197
#>  $ n_studies    : int 1
#>  $ disease_state: chr "Moderate-to-severe acute pain after oral (dental) surgery"
#>  $ dose_range   : chr "Single oral dose of diclofenac potassium 25, 50 or 100 mg (Prosorb dissolved formulation in the PBPK simulation)"
#>  $ notes        : chr "Pain relief data from Hersh 2004 (Thiel 2018 ref 27): 25 mg n = 63, 50 mg n = 68, 100 mg n = 66 (Thiel 2018 Met"| __truncated__
str(mod_cel()$population)
#> List of 6
#>  $ species      : chr "human"
#>  $ n_subjects   : int 57
#>  $ n_studies    : int 1
#>  $ disease_state: chr "Moderate-to-severe acute pain after oral (dental) surgery"
#>  $ dose_range   : chr "Single oral dose of celecoxib 400 mg"
#>  $ notes        : chr "Pain relief data from Cheung 2007 (Thiel 2018 ref 26): n = 57 on celecoxib (Thiel 2018 Methods). Arm-mean pain "| __truncated__
Source trace
| Equation / parameter | Diclofenac | Celecoxib | Source location |
|---|---|---|---|
score = emax * x^hill / (ec50^hill + x^hill) |
n/a | n/a | Results, Correlation of predicted decrease in prostaglandin formation with pain relief: “the Hill equation ((a*xb)/(cb + x^b))” |
x = pge2_decr = -PGE2_DELTA (umol/L) |
n/a | n/a | Figure 5 x-axis “PGE2 decrease [umol/l]”; Methods “difference of PGE2 concentrations between the drug-free treatment and the drug-treated case” |
score = placebo-adjusted mean pain relief |
n/a | n/a | Figure 5 y-axis “Delta(mean pain relief score, placebo)”; Methods “difference between mean pain relief scores … and the respective placebo effects” |
emax (a) |
2.8 (95% CI 2.0-3.5) | 2 (1.9-2.1) | Results, same paragraph |
hill (b) |
4.4 (2.6-6.3) | 5.7 (3.7-7.8) | Results, same paragraph |
ec50 (c, umol/L) |
37.2 (31.9-42.5) | 43.4 (40.6-46.1) | Results, same paragraph; units from Figure 5 |
addSd (score units) |
0.21 | 0.10 | Supplementary Table S4, rows ‘DFN (6h) Hill (3)’ and ‘CEL (6h) Hill (3)’, RMSE |
Supplementary Table S4 also prints the fit SSE (diclofenac 1.30, celecoxib 0.08), which the checks below use.
Digitised Figure 5 data
The observed points and the PGE2 driver were digitised from Figure 5 of the article. Each point of the bottom panels is one (PGE2 decrease, placebo-adjusted pain relief) pair. The time of each point was assigned by matching its PGE2 value to the PGE2 curve of the top panel and confirmed against the raw pain relief and placebo markers of the same panel. The three diclofenac arms and the celecoxib arm each have 11 points (33 and 11 in total), which matches the residual degrees of freedom implied by Table S4 (SSE / RMSE^2 = 29.5 and 8, i.e. about 32 and 11 points for a three-parameter fit).
fig5 <- tibble::tribble(
  ~arm, ~time, ~pge2_decr, ~dscore,
  "DFN 25 mg",  0.00,  0.0, 0.000,
  "DFN 25 mg",  0.25, 14.5, 0.104,
  "DFN 25 mg",  0.50, 27.4, 0.469,
  "DFN 25 mg",  0.75, 34.6, 1.323,
  "DFN 25 mg",  1.00, 39.1, 1.661,
  "DFN 25 mg",  1.50, 41.4, 2.042,
  "DFN 25 mg",  2.00, 39.8, 1.948,
  "DFN 25 mg",  3.00, 35.6, 1.490,
  "DFN 25 mg",  4.00, 32.3, 0.891,
  "DFN 25 mg",  5.00, 29.4, 0.792,
  "DFN 25 mg",  6.00, 27.6, 0.578,
  "DFN 50 mg",  0.00,  0.0, 0.000,
  "DFN 50 mg",  0.25, 15.3, 0.146,
  "DFN 50 mg",  0.50, 29.0, 0.599,
  "DFN 50 mg",  0.75, 37.1, 1.208,
  "DFN 50 mg",  1.00, 42.8, 1.734,
  "DFN 50 mg",  1.50, 48.0, 2.156,
  "DFN 50 mg",  2.00, 48.0, 2.250,
  "DFN 50 mg",  3.00, 45.1, 1.880,
  "DFN 50 mg",  4.00, 41.4, 1.536,
  "DFN 50 mg",  5.00, 38.4, 1.339,
  "DFN 50 mg",  6.00, 35.9, 1.036,
  "DFN 100 mg", 0.00,  0.0, 0.000,
  "DFN 100 mg", 0.25, 15.7, 0.167,
  "DFN 100 mg", 0.50, 29.6, 0.737,
  "DFN 100 mg", 0.75, 38.6, 1.583,
  "DFN 100 mg", 1.00, 44.5, 2.021,
  "DFN 100 mg", 1.50, 52.2, 2.458,
  "DFN 100 mg", 2.00, 55.3, 2.667,
  "DFN 100 mg", 3.00, 55.1, 2.396,
  "DFN 100 mg", 4.00, 52.5, 2.052,
  "DFN 100 mg", 5.00, 49.5, 1.719,
  "DFN 100 mg", 6.00, 46.8, 1.458,
  "CEL 400 mg", 0.00,  0.0, 0.000,
  "CEL 400 mg", 0.25, 15.8, -0.032,
  "CEL 400 mg", 0.50, 29.9, 0.366,
  "CEL 400 mg", 0.75, 39.3, 0.636,
  "CEL 400 mg", 1.00, 45.5, 1.135,
  "CEL 400 mg", 1.50, 55.7, 1.552,
  "CEL 400 mg", 2.00, 63.6, 1.990,
  "CEL 400 mg", 3.00, 76.0, 1.940,
  "CEL 400 mg", 4.00, 85.9, 1.904,
  "CEL 400 mg", 5.00, 94.8, 2.017,
  "CEL 400 mg", 6.00, 102.6, 1.882
) |>
  mutate(
    drug = ifelse(startsWith(arm, "DFN"), "diclofenac", "celecoxib"),
    arm = factor(arm, levels = c("DFN 25 mg", "DFN 50 mg", "DFN 100 mg", "CEL 400 mg"))
  )
stopifnot(nrow(fig5) == 44L, all(table(fig5$arm) == 11L))
Simulation
The PGE2 change is passed as the time-varying covariate
PGE2_DELTA on observation rows; each arm is one simulated
subject. The model has no differential equations and no dosing
records.
make_events <- function(d) {
  d |>
    mutate(
      id = as.integer(arm),
      evid = 0L,
      PGE2_DELTA = -pge2_decr
    ) |>
    select(id, time, evid, PGE2_DELTA, arm) |>
    arrange(id, time)
}

ev_dfn <- make_events(filter(fig5, drug == "diclofenac"))
ev_cel <- make_events(filter(fig5, drug == "celecoxib"))

sim_dfn <- rxode2::rxSolve(mod_dfn, events = ev_dfn, keep = "arm", returnType = "data.frame")
#> Warning: multi-subject simulation without without 'omega'
sim_cel <- rxode2::rxSolve(mod_cel, events = ev_cel, keep = "arm", returnType = "data.frame")

pred <- bind_rows(sim_dfn, sim_cel) |>
  select(arm, time, pge2_decr, score) |>
  mutate(arm = factor(as.character(arm), levels = levels(fig5$arm))) |>
  left_join(fig5, by = c("arm", "time", "pge2_decr"))
stopifnot(nrow(pred) == 44L, !anyNA(pred$dscore), !anyNA(pred$score))
The curves below are the model evaluated over a grid of PGE2 decrease values.
grid_events <- function(xmax) {
  data.frame(id = 1L, time = seq(0, 1, length.out = 201), evid = 0L) |>
    mutate(PGE2_DELTA = -seq(0, xmax, length.out = 201))
}
curve_dfn <- rxode2::rxSolve(mod_dfn, events = grid_events(60), returnType = "data.frame") |>
  mutate(drug = "diclofenac")
curve_cel <- rxode2::rxSolve(mod_cel, events = grid_events(110), returnType = "data.frame") |>
  mutate(drug = "celecoxib")
curves <- bind_rows(curve_dfn, curve_cel)
Replicate published figures
ggplot() +
  geom_line(data = curves, aes(pge2_decr, score)) +
  geom_point(data = fig5, aes(pge2_decr, dscore, colour = arm, shape = arm)) +
  facet_wrap(~ factor(drug, levels = c("diclofenac", "celecoxib")), scales = "free_x") +
  labs(
    x = "PGE2 decrease (umol/L)",
    y = "Mean pain relief score minus placebo",
    colour = NULL, shape = NULL,
    caption = "Replicates the bottom panels of Figure 5 of Thiel 2018 (points digitised)."
  ) +
  theme_bw()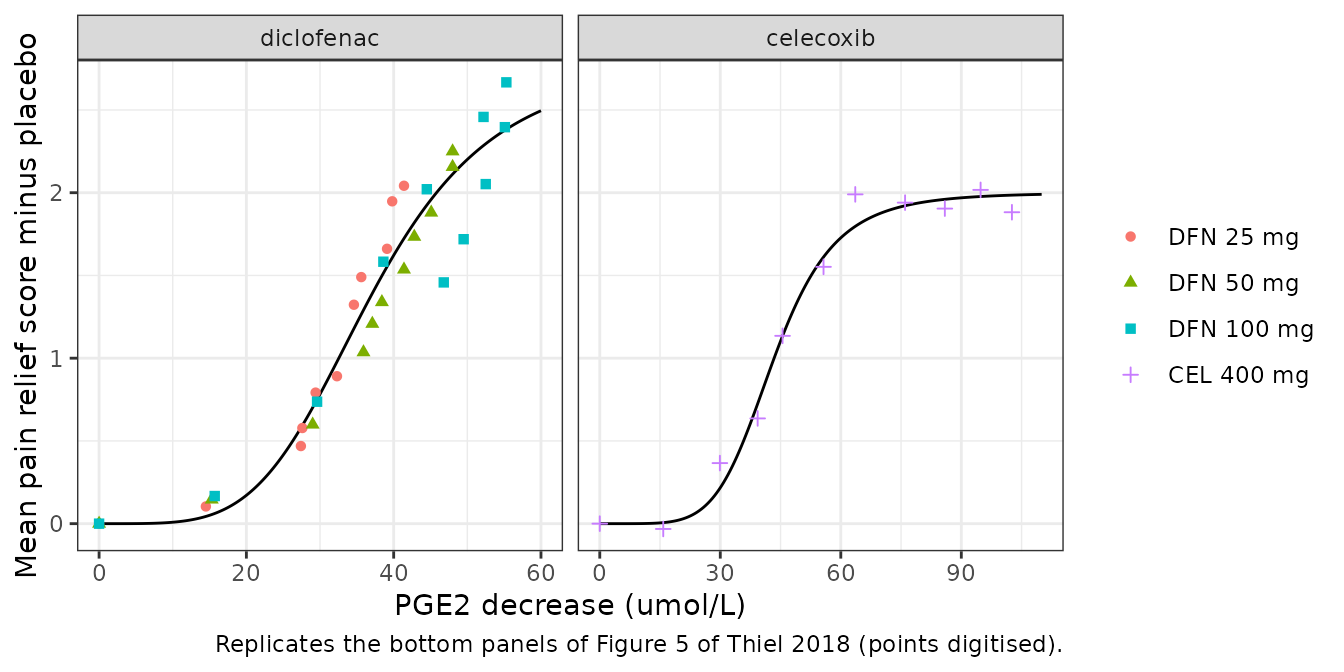
Driving the models with the digitised PGE2 time course gives the placebo-adjusted pain relief over time:
pred |>
  ggplot(aes(time)) +
  geom_line(aes(y = score, colour = "model")) +
  geom_point(aes(y = dscore, colour = "observed")) +
  facet_wrap(~arm) +
  labs(
    x = "Time (h)",
    y = "Mean pain relief score minus placebo",
    colour = NULL,
    caption = paste0(
      "Time course behind the top panels of Figure 5 of Thiel 2018,\n",
      "placebo-adjusted (the paper plots raw scores beside placebo)."
    )
  ) +
  theme_bw()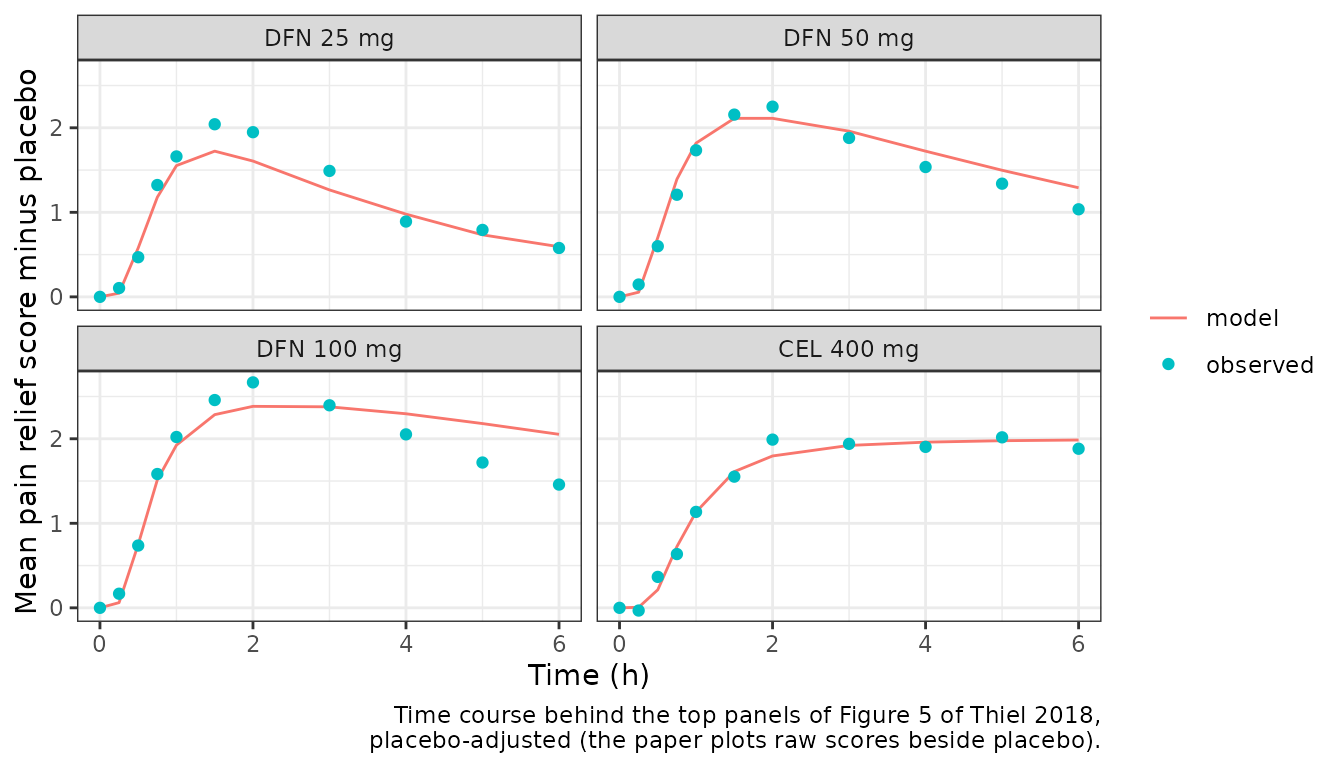
Checks
Hill anchors
Both sides of these checks use the same parameters, so the differences are round-off and the tolerances are tight.
anchor_events <- function(ec50) {
  data.frame(id = 1L, time = 0:2, evid = 0L, PGE2_DELTA = -c(0, ec50, 1e4))
}
a_dfn <- rxode2::rxSolve(mod_dfn, events = anchor_events(37.2), returnType = "data.frame")
a_cel <- rxode2::rxSolve(mod_cel, events = anchor_events(43.4), returnType = "data.frame")
stopifnot(
  # No PGE2 decrease, no drug effect.
  a_dfn$score[1] == 0, a_cel$score[1] == 0,
  # Half the maximal effect at x = ec50.
  abs(a_dfn$score[2] - 2.8 / 2) < 1e-10,
  abs(a_cel$score[2] - 2.0 / 2) < 1e-10,
  # The asymptote is emax.
  abs(a_dfn$score[3] / 2.8 - 1) < 1e-6,
  abs(a_cel$score[3] / 2.0 - 1) < 1e-6
)
Residual error against Supplementary Table S4
The paper’s fit statistics were computed on the points plotted in
Figure 5, so the packaged parameters evaluated on the digitised points
should give about the same SSE and RMSE (RMSE = sqrt(SSE / (n - 3)), the
MATLAB curve fitting toolbox definition, and the value carried as
addSd).
fit_stats <- pred |>
  group_by(drug) |>
  summarise(
    n = n(),
    sse = sum((dscore - score)^2),
    rmse = sqrt(sse / (n - 3)),
    .groups = "drop"
  ) |>
  mutate(
    sse_paper = ifelse(drug == "diclofenac", 1.30, 0.08),
    rmse_paper = ifelse(drug == "diclofenac", 0.21, 0.10)
  )

fit_stats |>
  rename(
    "Drug" = drug,
    "Points" = n,
    "SSE (digitised)" = sse,
    "SSE (Table S4)" = sse_paper,
    "RMSE (digitised)" = rmse,
    "RMSE (Table S4)" = rmse_paper
  ) |>
knitr::kable(digits = 3, caption = "Fit statistics on the digitised Figure 5 points.")| Drug | Points | SSE (digitised) | RMSE (digitised) | SSE (Table S4) | RMSE (Table S4) |
|---|---|---|---|---|---|
| celecoxib | 11 | 0.089 | 0.106 | 0.08 | 0.10 |
| diclofenac | 33 | 1.301 | 0.208 | 1.30 | 0.21 |
# Measured 0.208 vs 0.21 (diclofenac) and 0.106 vs 0.10 (celecoxib). A 10%
# error in ec50 or emax raises the RMSE to 0.27-0.34 (diclofenac) or
# 0.19-0.20 (celecoxib), and swapping the two drugs' parameter sets to
# 0.74-0.82, so the 0.02 bound fails on a transcription error.
stopifnot(all(abs(fit_stats$rmse - fit_stats$rmse_paper) < 0.02))
Refit to the digitised points
A least-squares refit of the Hill equation to the digitised points should land inside the 95% confidence intervals the paper prints.
hill_fn <- function(x, a, b, c) a * x^b / (c^b + x^b)
refit <- function(d, start) {
  stats::coef(stats::nls(dscore ~ hill_fn(pge2_decr, a, b, c), data = d, start = start))
}
est_dfn <- refit(filter(fig5, drug == "diclofenac"), list(a = 2.8, b = 4.4, c = 37.2))
est_cel <- refit(filter(fig5, drug == "celecoxib"), list(a = 2, b = 5.7, c = 43.4))

ci <- tibble::tribble(
  ~drug, ~param, ~paper, ~lower, ~upper,
  "diclofenac", "a (emax)", 2.8, 2.0, 3.5,
  "diclofenac", "b (hill)", 4.4, 2.6, 6.3,
  "diclofenac", "c (ec50)", 37.2, 31.9, 42.5,
  "celecoxib", "a (emax)", 2.0, 1.9, 2.1,
  "celecoxib", "b (hill)", 5.7, 3.7, 7.8,
  "celecoxib", "c (ec50)", 43.4, 40.6, 46.1
) |>
  mutate(refit = c(est_dfn, est_cel))

ci |>
  rename(
    "Drug" = drug, "Parameter" = param, "Paper" = paper,
    "95% CI lower" = lower, "95% CI upper" = upper, "Refit" = refit
  ) |>
knitr::kable(digits = 2, caption = "Refit to the digitised points against the published estimates.")| Drug | Parameter | Paper | 95% CI lower | 95% CI upper | Refit |
|---|---|---|---|---|---|
| diclofenac | a (emax) | 2.8 | 2.0 | 3.5 | 2.82 |
| diclofenac | b (hill) | 4.4 | 2.6 | 6.3 | 4.23 |
| diclofenac | c (ec50) | 37.2 | 31.9 | 42.5 | 37.55 |
| celecoxib | a (emax) | 2.0 | 1.9 | 2.1 | 2.00 |
| celecoxib | b (hill) | 5.7 | 3.7 | 7.8 | 5.75 |
| celecoxib | c (ec50) | 43.4 | 40.6 | 46.1 | 43.36 |
Assumptions and deviations
- The PGE2 change is an input. In the paper it is the output of the
Yang 2007 arachidonic-acid network (human polymorphonuclear leukocytes)
with competitive COX-2 inhibition (Ki 0.018 for diclofenac, 0.017 for
celecoxib, converted from literature IC50 values), driven by the PK-Sim
prediction of the unbound drug concentration in venous blood cells.
Neither layer is in this package, so the models cannot be dosed; a user
must supply
PGE2_DELTAfrom their own prediction of the network. Its umol/L scale is the network’s internal concentration scale, not a PGE2 immunoassay value. - The maintainers registered the covariate as the signed change
PGE2_DELTA(negative = decrease), matching the existingLDLC_DELTAbiomarker-change canonical, and recover the paper’s decrease inside the model. The models are defined for a decrease (PGE2_DELTA <= 0); a positive value makes the non-integer Hill power undefined and returnsNaN. - The fits are to arm means over time, pooled across doses for
diclofenac. The link is direct (no delay), as fitted. No between-subject
variability was estimated, and
addSdis the residual SD of the arm-mean fit, not a per-patient residual. - The Figure 5 points were digitised by the maintainers from the published raster at about 0.2 umol/L and 0.01 score units per pixel. They are used only for the checks above; no model value comes from them.
- Not included: the 24 h celecoxib fit (Supplementary Table S4 gives its fit statistics, RMSE 0.22, but the paper does not report its parameters); the drug efficacy score (Equation 1), which combines PGE2 and omega-hydroxy-LTB4 outputs of the network; and the licofelone and zileuton results, for which the paper had no time-resolved clinical data to relate to an outcome.
- No correction notice for the article was found (checked October 2026).