Lorenzo's oil (Ahmed 2016)
Source:vignettes/articles/Ahmed_2016_lorenzosOil.Rmd
Ahmed_2016_lorenzosOil.RmdModel and source
- Citation: Ahmed MA, Kartha RV, Brundage RC, Cloyd J, Basu C, Carlin BP, Jones RO, Moser AB, Fatemi A, Raymond GV. A model-based approach to assess the exposure-response relationship of Lorenzo’s oil in adrenoleukodystrophy. Br J Clin Pharmacol. 2016 Jun;81(6):1058-1065. doi:10.1111/bcp.12897
- Description: Population pharmacodynamic model of Lorenzo’s oil effect on plasma C26:0 in asymptomatic boys with X-linked adrenoleukodystrophy: inhibitory fractional Emax model relating observed plasma erucic acid concentration to plasma C26:0. The paper does not develop a PK model for erucic acid; observed erucic acid plasma concentration is supplied as a time-varying covariate.
- Article: https://doi.org/10.1111/bcp.12897
Ahmed and colleagues studied the effect of Lorenzo’s oil (LO; a mixture of glyceryl trierucate and glyceryl trioleate providing erucic acid (C22:1) and oleic acid in the diet) on plasma very-long-chain saturated fatty acid concentrations in asymptomatic boys with X-linked adrenoleukodystrophy (X-ALD). The pharmacodynamic readout is plasma C26:0 (hexacosanoic acid), which accumulates in X-ALD and is believed to drive the cerebral demyelination characteristic of childhood cerebral ALD. The structural model is a purely algebraic inhibitory fractional Emax expression with the observed plasma erucic acid concentration as predictor; the paper explicitly does not develop a PK model for erucic acid (only one determination per subject per visit was available and dosing / sampling times were not collected).
Population
The estimation dataset comprised 2384 paired C26:0 / erucic acid plasma observations from 104 asymptomatic X-ALD boys identified by screening at-risk relatives at the Johns Hopkins Research Hospital between 2000 and 2014 (ClinicalTrials.gov NCT02233257). Baseline median age was 2.79 years (range 0.068-8.92) and baseline median weight 14.90 kg (range 9.40-40.60); X-ALD is X-linked and the cohort is entirely male. Mean follow-up was 4.88 +/- 2.76 years. All participants received approximately 2-3 mg/kg/day of Lorenzo’s oil providing 20% of caloric intake, with platelet-mediated dose interruptions managed by temporary substitution of glyceryl trioleate at the same dosage. Of the 103 subjects retained for the time-to-event analyses, 10 developed a brain MRI abnormality during the observation window (Ahmed 2016 Table 1, Results).
The same information is available programmatically via the model’s
population metadata
(readModelDb("Ahmed_2016_lorenzosOil")$population).
Source trace
The per-parameter origin is recorded as an in-file comment next to
each ini() entry in
inst/modeldb/specificDrugs/Ahmed_2016_lorenzosOil.R. The
table below consolidates the source pointers for the structural model
and the parameter estimates.
| Equation / parameter | Value | Source location |
|---|---|---|
C26:0 = E0 * (1 - Emax * ER / (EC50 + ER)) |
n/a | Ahmed 2016 Methods, “Population PD model building” (unnumbered Emax equation, page 1060) |
le0 (E0) |
1.44 mg/L | Ahmed 2016 Table 2, fixed effects |
lemax (Emax) |
0.76 | Ahmed 2016 Table 2, fixed effects |
lec50 (EC50) |
0.734 mg/L | Ahmed 2016 Table 2, fixed effects |
| BSV CV% on E0 | 31.5% | Ahmed 2016 Table 2, random effects (CV% = sqrt(exp(omega^2) - 1)) |
| BSV CV% on Emax | 6.2% | Ahmed 2016 Table 2, random effects |
| BSV CV% on EC50 | 171.3% | Ahmed 2016 Table 2, random effects |
| corr(E0, EC50) | -0.877 | Ahmed 2016 Table 2; other correlations fixed to zero (Results) |
propSd |
0.276 | Ahmed 2016 Table 2 (proportional residual CV% 27.6%; footnote: CV% = sqrt(sigma^2)) |
CV%-to-variance conversion
(omega^2 = log(CV^2 + 1)):
| Parameter | CV% | omega^2 |
|---|---|---|
| E0 | 31.5 | 0.09464 |
| Emax | 6.2 | 0.003836 |
| EC50 | 171.3 | 1.36998 |
Covariance entry in the (etale0, etalec50) block:
cov = -0.877 * sqrt(0.09464 * 1.36998) = -0.31579.
Virtual cohort
Original observed data are not publicly available. The simulations below build a virtual cohort whose covariate distributions approximate the published trial demographics (Table 1) and exercise the model across the observed erucic acid plasma concentration range.
Simulation
mod <- readModelDb("Ahmed_2016_lorenzosOil")

# Stochastic VPC-style simulation with full random effects.
sim <- rxode2::rxSolve(mod, events = events, keep = c("CP_ER_MGL"))
#> ℹ parameter labels from comments will be replaced by 'label()'
For deterministic replication (the typical-value curve overlaid on Figure 1), zero out the random effects:
mod_typical <- mod |> rxode2::zeroRe()
#> ℹ parameter labels from comments will be replaced by 'label()'
sim_typical <- rxode2::rxSolve(mod_typical, events = events, keep = c("CP_ER_MGL"))
#> ℹ omega/sigma items treated as zero: 'etale0', 'etalec50', 'etalemax'
#> Warning: multi-subject simulation without without 'omega'
Replicate Figure 1 – pvcVPC of C26:0 vs. erucic acid
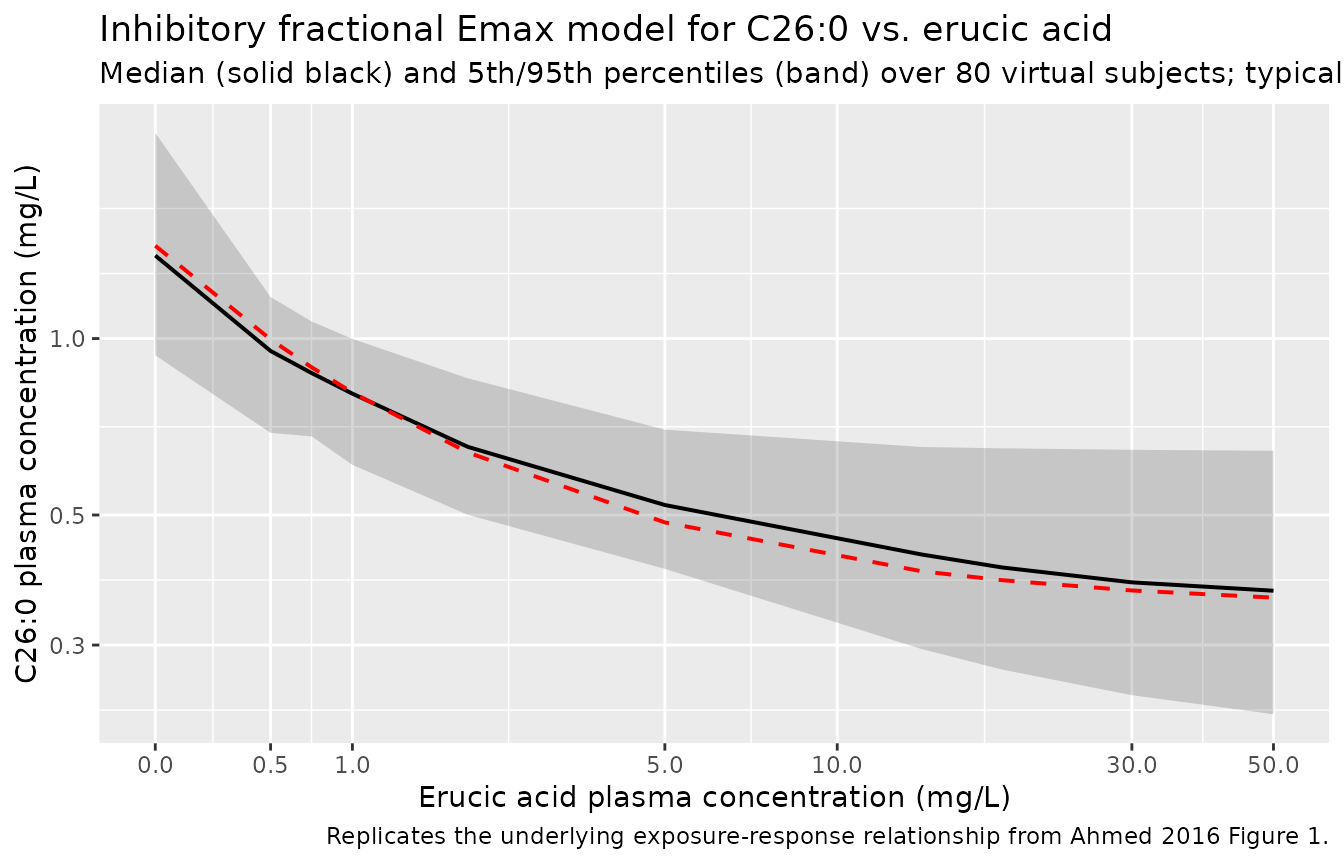
Figure 1 of Ahmed 2016 displays the prediction- and variability-corrected VPC (pvcVPC) of C26:0 versus erucic acid plasma concentration on a log scale, with observation percentiles overlaid on the 95% prediction intervals derived from 1000 simulated replicates. The pvcVPC normalisation removes between-subject variability and bin-to-bin differences in the predictor; the cleaner deterministic relationship from the same model (population mean as a function of ER) is shown below alongside the stochastic 5th / 50th / 95th percentile bands across the virtual cohort.
band <- sim |>
  dplyr::group_by(CP_ER_MGL) |>
  dplyr::summarise(
    Q05 = quantile(Cc26, 0.05, na.rm = TRUE),
    Q50 = quantile(Cc26, 0.50, na.rm = TRUE),
    Q95 = quantile(Cc26, 0.95, na.rm = TRUE),
    .groups = "drop"
  )

typical <- sim_typical |>
  dplyr::group_by(CP_ER_MGL) |>
  dplyr::summarise(Cc26 = mean(Cc26), .groups = "drop")

ggplot(band, aes(x = CP_ER_MGL)) +
  geom_ribbon(aes(ymin = Q05, ymax = Q95), alpha = 0.20) +
  geom_line(aes(y = Q50), linewidth = 0.7) +
  geom_line(data = typical, aes(y = Cc26),
            colour = "red", linetype = "dashed", linewidth = 0.7) +
  scale_x_continuous(trans = "log1p",
                     breaks = c(0, 0.5, 1, 5, 10, 30, 50)) +
  scale_y_log10() +
  labs(
    x = "Erucic acid plasma concentration (mg/L)",
    y = "C26:0 plasma concentration (mg/L)",
    title = "Inhibitory fractional Emax model for C26:0 vs. erucic acid",
    subtitle = "Median (solid black) and 5th/95th percentiles (band) over 80 virtual subjects; typical curve (red dashed)",
    caption = "Replicates the underlying exposure-response relationship from Ahmed 2016 Figure 1."
  )
Key landmark predictions
The paper reports three landmark predictions in the Results / Discussion:
- At pretreatment median ER = 0.5 mg/L, the model predicts C26:0 = 0.997 mg/L (Ahmed 2016 Discussion).
- At median LAUCER = 13.80 mg/L (Table 1; the Discussion text mis-quotes this as 13.08 – the value used in the prediction below is the Table 1 figure), the model predicts C26:0 = 0.404 mg/L.
- As ER -> infinity, C26:0 -> E0 * (1 - Emax) = 1.44 * 0.24 = 0.346 mg/L (the asymptotic floor; Ahmed 2016 Discussion).
landmark <- data.frame(
  scenario = c("Pretreatment median ER", "Median LAUCER", "ER -> infinity"),
  ER       = c(0.5, 13.80, 1e6)
) |>
  dplyr::mutate(
    cc26_pred  = with(list(e0 = 1.44, emax = 0.76, ec50 = 0.734),
                      e0 * (1 - emax * ER / (ec50 + ER))),
    cc26_paper = c(0.997, 0.404, 1.44 * (1 - 0.76))
  )

landmark |>
  dplyr::rename(
    "Scenario"               = scenario,
    "Erucic acid (mg/L)"     = ER,
    "C26:0 predicted (mg/L)" = cc26_pred,
    "C26:0 paper (mg/L)"     = cc26_paper
  ) |>
  knitr::kable(
    digits  = 3,
    caption = "Closed-form C26:0 predictions vs. paper-stated landmark values."
)| Scenario | Erucic acid (mg/L) | C26:0 predicted (mg/L) | C26:0 paper (mg/L) |
|---|---|---|---|
| Pretreatment median ER | 5.00e-01 | 0.997 | 0.997 |
| Median LAUCER | 1.38e+01 | 0.401 | 0.404 |
| ER -> infinity | 1.00e+06 | 0.346 | 0.346 |
The closed-form predictions match the paper’s narrative within
rounding, which confirms that the encoded ini() values
reproduce the paper’s published model.
Assumptions and deviations
No PK model for erucic acid. Ahmed 2016 explicitly states that only one erucic acid concentration was determined per subject per visit and that dosing and sampling times were not collected, so no PK model was developed. The nlmixr2lib model takes plasma erucic acid concentration as a time-varying covariate column (
CP_ER_MGL) supplied by the user from observed data or from an external assumption (e.g. the post-treatment median of 18.63 mg/L, Table 1). Downstream users who need a coupled PK-PD simulation must supply their own erucic acid PK trajectory.No ODE state. The model is a pure algebraic biomarker expression with no compartment, no dose event, and no time dynamics. PKNCA-based NCA validation is therefore not applicable; the landmark-predictions table above is the closed-form check.
Observation variable name
Cc26is paper-specific, not the canonicalCc.nlmixr2lib::checkModelConventions("Ahmed_2016_lorenzosOil")raises a warning that the single-output observationCc26is not the canonicalCc(the convention-defined drug-concentration observation name). The observation here is plasma C26:0 (hexacosanoic acid), a very-long-chain saturated fatty acid biomarker – not a drug concentration – and the paper-specific name is retained to keep the model’s output semantically honest. The same accepted deviation exists inWeber_1993_remikiren.R(outputAPR) where the observation is a PD endpoint rather than a drug concentration.-
Time-to-event analyses not extracted as a separate model file. Ahmed 2016 reports two parametric AFT-Weibull regressions in SAS PROC LIFEREG that related the per-subject time-weighted average erucic acid plasma concentration (LAUCER) and the per-subject time-weighted average C26:0 (LAUCC26:0) to the hazard of developing a brain MRI abnormality (Tables 3 and 4). Both associations were not statistically significant (P = 0.5344 and P = 0.1509 respectively) and the analyses use a per-subject summary statistic (LAUC) rather than a time-varying state, so they fall outside the scope of an nlmixr2 ODE / mixed-effects model. The AFT-Weibull point estimates are preserved here for reference:
Predictor Shape (r) Intercept (alpha) Slope (beta, AFT) Implied hazard ratio Source LAUCER (mg/L) 0.744 6.49 0.05 per (mg/L) 0.963 per (mg/L) Ahmed 2016 Table 3 LAUCC26:0 (mg/L) 0.828 8.19 -2.59 per (mg/L) 8.53 per (mg/L) Ahmed 2016 Table 4 Hazard ratio = exp(-beta_AFT * shape).
Sex distribution. X-ALD is X-linked and the trial enrolled only boys (Ahmed 2016 Methods);
population$sex_female_pct = 0. The original paper does not report race / ethnicity for the cohort.Erucic acid censoring rule. The paper censored ER > 30 mg/L in the time-to-event analyses (treating those values as transient peak post-dose concentrations rather than steady-state brain exposure proxies). The popPD fit used the full ER range. The packaged model places no upper bound on
CP_ER_MGL; downstream users who want to replicate the LAUC analyses should apply the same > 30 mg/L cap to their input data.