Model and source
- Citation: Choi S, Jeon S, Han S (2018). Population pharmacokinetic analysis of metformin administered as fixed-dose combination in Korean healthy adults. Transl Clin Pharmacol 26(1):25-31. doi:10.12793/tcp.2018.26.1.25.
- Description: Two-compartment population PK model for oral metformin in 36 healthy adult Korean men from a phase I single-dose 2-way crossover bioequivalence study comparing a single-agent metformin tablet against a metformin-containing fixed-dose combination (FDC) tablet (Choi 2018). The absorption process is parallel mixed-input: fraction F1 of the dose is absorbed first-order from the depot compartment (rate Ka), and fraction (1-F1) is absorbed zero-order directly into the central compartment over duration D2 with lag time ALAG2. Formulation enters as a binary covariate (FORM_FDC) with multiplicative power-style effects on Ka (Ka_FDC = 0.83 * Ka_single-agent) and on relative bioavailability F (F_FDC = 0.94 * F_single-agent = 0.94). IIV on CL/F, Vc/F (correlated, rho 0.225), and Ka; proportional residual error only.
- Article (open access): https://doi.org/10.12793/tcp.2018.26.1.25
Population
Thirty-six healthy adult Korean men aged 20-42 years (mean 23.9, SD 5.0) participated in a phase I, open-label, randomized, single-dose, 2-way crossover bioequivalence study at Seoul St. Mary’s Hospital, Catholic University of Korea (IRB approval KC14MDSF0913). Mean height was 176.0 cm (SD 3.5; range 169.1-183.5) and mean body weight was 70.9 kg (SD 7.9). Each subject received both a single-agent metformin tablet (reference) and a metformin-containing fixed-dose-combination (FDC) tablet (test) across two periods separated by a 1-week wash-out, administered with 150 mL of water after 10 h of fasting. Plasma metformin was sampled at 0 (predose), 0.25, 0.5, 0.75, 1, 1.5, 2, 3, 4, 6, 8, 12, and 24 h after each administration, and assayed by LC-MS/MS (Choi 2018 Methods).
The published Choi 2018 Table 1 reports the demographic summary, but
the row labels for Weight (kg) and Height (cm)
are swapped: the mean +/- SD pairs printed against
Weight (kg) (176.0; range 169.1-183.5) are actually the
height values, and those printed against Height (cm) (23.9;
range 20.0-42.0) are actually the age values. The correct pairs
reproduced in the paragraph above are taken from the Results “Dataset”
prose narrative. Additionally, the prose narrative prints the weight
units as “cm” rather than “kg”; this is a paper typo since the Table 1
column header clearly states “Weight (kg)”.
The same information is available programmatically via
rxode2::rxode(readModelDb("Choi_2018_metformin"))$population.
Source trace
The per-parameter origin is recorded as an in-file comment next to
each ini() entry in
inst/modeldb/specificDrugs/Choi_2018_metformin.R. The table
below collects them in one place for review.
| Equation / parameter | Value | Source location |
|---|---|---|
lcl (apparent CL/F) |
log(76.7 L/h) | Choi 2018 Table 3 |
lvc (apparent Vc/F) |
log(180 L) | Choi 2018 Table 3 |
lq (apparent Q/F) |
log(21.3 L/h) | Choi 2018 Table 3 |
lvp (apparent Vp/F) |
log(109 L) | Choi 2018 Table 3 |
lka (1st-order Ka, single-agent ref) |
log(1.19 /h) | Choi 2018 Table 3 (Ka1) |
ld2 (zero-order duration D2) |
log(4.49 h) | Choi 2018 Table 3 (D2) |
lalag2 (zero-order lag ALAG2) |
log(0.250 h) | Choi 2018 Table 3 (ALAG2) |
logitf1 (fraction first-order) |
qlogis(0.289) | Choi 2018 Table 3 (F1) |
e_form_fdc_ka (Ka shift for FDC) |
0.830 | Choi 2018 Table 3 (Influence of formulation on Ka) |
e_form_fdc_f (F shift for FDC) |
0.940 | Choi 2018 Table 3 (Influence of formulation on F) |
etalcl (omega^2) |
log(1 + 0.198^2) = 0.03845 | Choi 2018 Table 3: CV% CL/F = 19.8 |
etalvc (omega^2) |
log(1 + 0.328^2) = 0.10215 | Choi 2018 Table 3: CV% Vc/F = 32.8 |
etalka (omega^2) |
log(1 + 0.636^2) = 0.33967 | Choi 2018 Table 3: CV% Ka = 63.6 |
cov(etalcl, etalvc) |
0.225 * sqrt(0.03845 * 0.10215) = 0.01411 | Choi 2018 Table 3: rho(CL/F, Vc/F) = 0.225 |
propSd (proportional residual SD) |
0.259 | Choi 2018 Table 3 (sigma_prop) |
| Parallel mixed absorption (1st-order via depot + zero-order direct to central with lag) | n/a | Choi 2018 Figure 2 / Methods “Population Pharmacokinetic Analysis” |
| Formulation effect: theta_test = theta_ref * X^formulation | n/a | Choi 2018 Methods Eq. 2 |
| Reference category: formulation = 0 = single-agent metformin tablet | n/a | Choi 2018 Methods Eq. 2 |
Virtual cohort
Original observed data are not publicly available. The figures below use a virtual population matched to the Choi 2018 study design (36 subjects each receiving both single-agent and FDC formulations in a 2-way crossover), replicated to give a stable VPC envelope. The single-dose strength is not stated in the paper; 1000 mg is used here as a representative metformin dose used in commercially marketed metformin FDC products (e.g. metformin 1000 mg + sitagliptin 50 mg Janumet 50/1000); the choice scales the simulated concentrations proportionally but does not affect the AUC and Cmax ratios between formulations since both formulation arms receive the same dose strength.
set.seed(2018)

n_per_arm <- 100L
dose_mg   <- 1000

arm_def <- tibble::tribble(
  ~treatment,        ~FORM_FDC,
  "single-agent",    0L,
  "FDC",             1L
)

make_cohort <- function(arm_row, id_offset) {
  ids <- id_offset + seq_len(n_per_arm)

  # First-order arm: dose to depot with no special rate.
  dose_first <- expand.grid(id = ids, KEEP.OUT.ATTRS = FALSE,
                            stringsAsFactors = FALSE)
  dose_first$time <- 0
  dose_first$amt  <- dose_mg
  dose_first$evid <- 1L
  dose_first$cmt  <- "depot"
  dose_first$rate <- NA_real_

  # Zero-order arm: dose to central with rate = -2 to invoke the
  # modelled duration dur(central) = D2 (Choi 2018 zero-order arm of
  # duration 4.49 h with 0.25 h lag).
  dose_zero <- dose_first
  dose_zero$cmt  <- "central"
  dose_zero$rate <- -2

  # Observation grid: extends through 36 h to capture the terminal
  # phase beyond the paper's 24 h sampling. Dense early sampling
  # captures the first-order peak; the zero-order infusion ends at
  # ALAG2 + D2 = 4.74 h. Include t = 0 so PKNCA can integrate AUC
  # from the dose time.
  obs_grid <- c(0, 0.05, 0.1, 0.15, 0.25, 0.5, 0.75,
                seq(1, 6, by = 0.25),
                seq(6.5, 12, by = 0.5),
                seq(13, 36, by = 1))
  obs_pk <- expand.grid(id = ids, time = obs_grid,
                        KEEP.OUT.ATTRS = FALSE, stringsAsFactors = FALSE)
  obs_pk$amt  <- NA_real_
  obs_pk$evid <- 0L
  obs_pk$cmt  <- NA_character_
  obs_pk$rate <- NA_real_

  cohort <- dplyr::bind_rows(dose_first, dose_zero, obs_pk)
  cohort$treatment <- arm_row$treatment
  cohort$FORM_FDC  <- arm_row$FORM_FDC
  cohort
}

events <- dplyr::bind_rows(
  make_cohort(arm_def[1, ], id_offset = 0L),
  make_cohort(arm_def[2, ], id_offset = n_per_arm)
)

# Disjoint IDs across cohorts (mandatory).
stopifnot(!anyDuplicated(unique(events[, c("id", "time", "evid")])))
Simulation
mod <- rxode2::rxode(readModelDb("Choi_2018_metformin"))
#> ℹ parameter labels from comments will be replaced by 'label()'
sim <- rxode2::rxSolve(mod, events = events,
                       keep = c("treatment", "FORM_FDC")) |>
  as.data.frame()
sim$treatment <- factor(sim$treatment, levels = c("single-agent", "FDC"))
For a typical-value comparison (no between-subject variability, matching the structural model’s typical-value profile), zero the omegas:
mod_typical <- rxode2::zeroRe(mod, which = "omega")
sim_typical <- rxode2::rxSolve(mod_typical, events = events,
                               keep = c("treatment", "FORM_FDC")) |>
  as.data.frame()
#> ℹ omega/sigma items treated as zero: 'etalcl', 'etalvc', 'etalka'
#> Warning: multi-subject simulation without without 'omega'
sim_typical$treatment <- factor(sim_typical$treatment,
                                levels = c("single-agent", "FDC"))
Replicate published figures
Figure 1 – Individual plasma concentration vs time
Choi 2018 Figure 1 shows individual plasma concentration-versus-time profiles for (A) single-agent metformin and (B) the FDC, with the median overlaid in bold red. The simulated profiles below reproduce the median and 5th-95th percentile envelope by formulation.
# Replicates Figure 1 of Choi 2018: individual plasma metformin
# concentration profiles by formulation; bold line = median.
sim |>
  dplyr::filter(!is.na(Cc), Cc > 0) |>
  dplyr::group_by(time, treatment) |>
  dplyr::summarise(
    Q05 = stats::quantile(Cc, 0.05, na.rm = TRUE),
    Q50 = stats::quantile(Cc, 0.50, na.rm = TRUE),
    Q95 = stats::quantile(Cc, 0.95, na.rm = TRUE),
    .groups = "drop"
  ) |>
  ggplot2::ggplot(ggplot2::aes(time, Q50, colour = treatment, fill = treatment)) +
  ggplot2::geom_ribbon(ggplot2::aes(ymin = Q05, ymax = Q95),
                       alpha = 0.20, colour = NA) +
  ggplot2::geom_line(linewidth = 0.8) +
  ggplot2::facet_wrap(~ treatment) +
  ggplot2::labs(x = "Time after dose (h)",
                y = "Plasma metformin (mg/L)",
                title = "Figure 1 -- Plasma metformin profile by formulation",
                caption = "Replicates Figure 1 of Choi 2018 (1000 mg single dose).")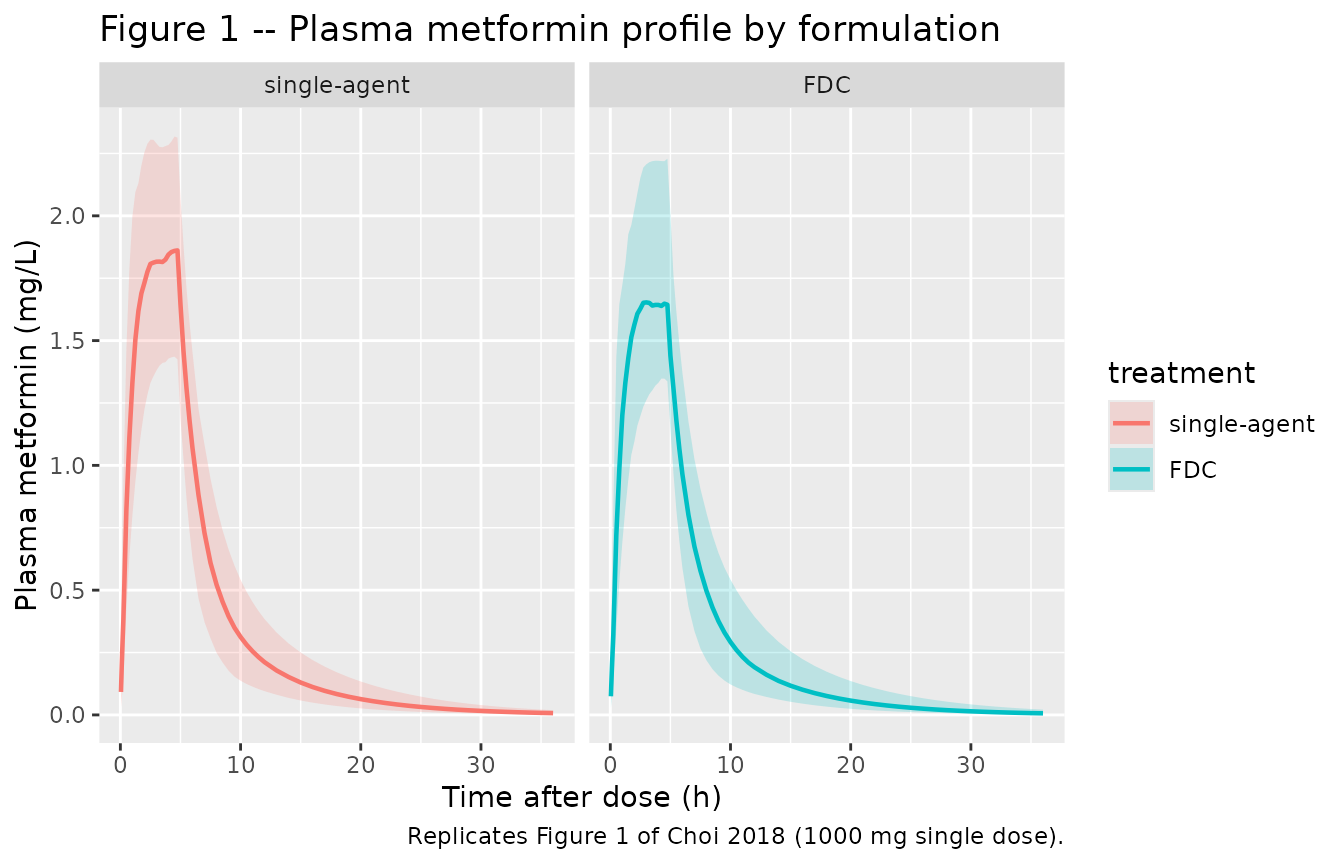
Figure 4 – Visual predictive check by formulation
Choi 2018 Figure 4 shows VPCs of plasma metformin concentration for (A) the single-agent arm and (B) the FDC arm. The dashed line and grey shading represent the median and 90% prediction interval of the simulated concentrations, with observed data overlaid.
# Replicates Figure 4 of Choi 2018: VPC (median + 90% PI) of plasma
# metformin by formulation arm. Observed circles are not reproduced
# here because the underlying subject-level concentrations are not
# distributed with the paper.
sim |>
  dplyr::filter(!is.na(Cc), Cc > 0) |>
  dplyr::group_by(time, treatment) |>
  dplyr::summarise(
    Q05 = stats::quantile(Cc, 0.05, na.rm = TRUE),
    Q50 = stats::quantile(Cc, 0.50, na.rm = TRUE),
    Q95 = stats::quantile(Cc, 0.95, na.rm = TRUE),
    .groups = "drop"
  ) |>
  ggplot2::ggplot(ggplot2::aes(time, Q50)) +
  ggplot2::geom_ribbon(ggplot2::aes(ymin = Q05, ymax = Q95),
                       alpha = 0.25, fill = "grey50") +
  ggplot2::geom_line(linetype = "dashed", linewidth = 0.7) +
  ggplot2::facet_wrap(~ treatment) +
  ggplot2::scale_y_log10() +
  ggplot2::labs(x = "Time after dose (h)",
                y = "Plasma metformin (mg/L, log scale)",
                title = "Figure 4 -- Plasma metformin VPC by formulation",
                caption = "Replicates Figure 4 of Choi 2018 (1000 mg single dose).")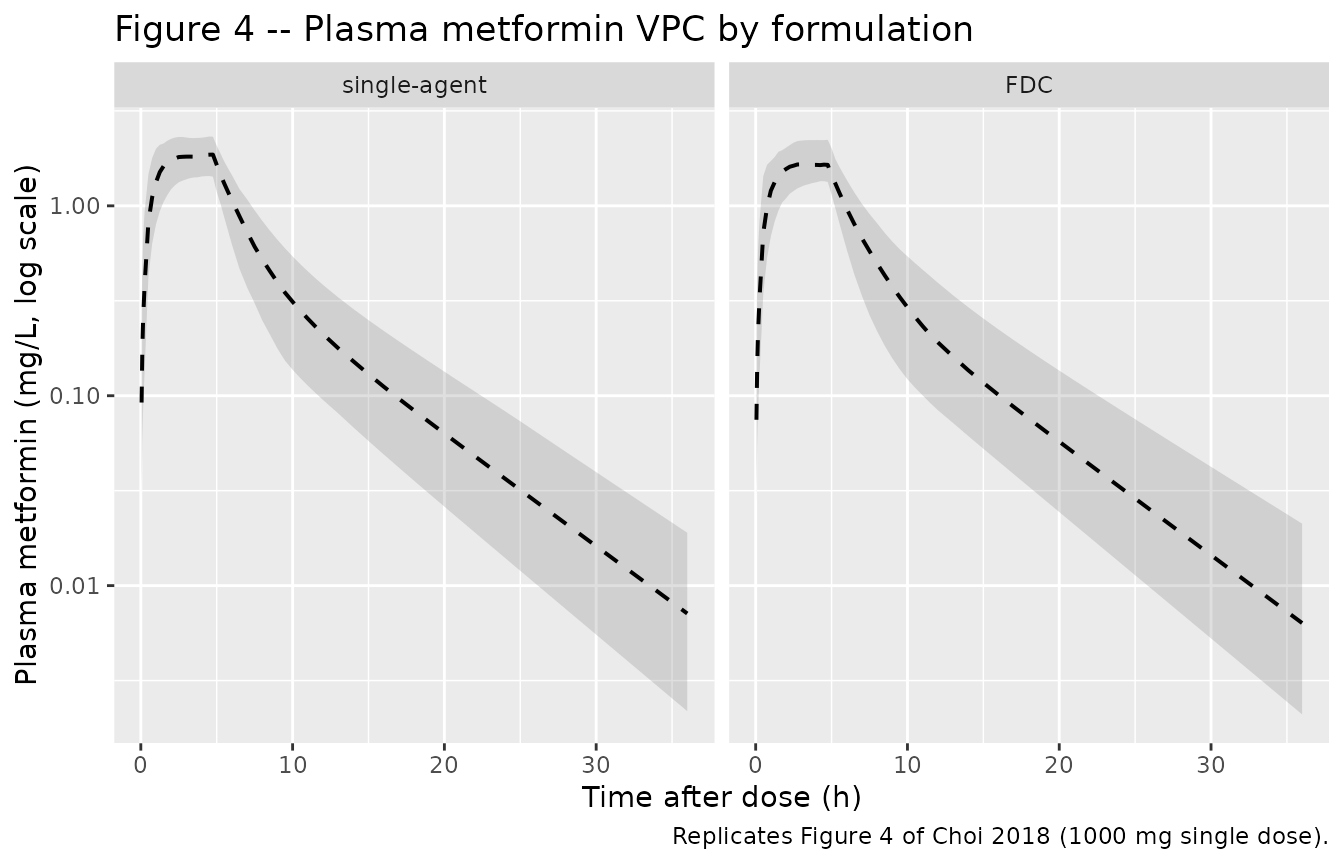
Typical-value profiles (no IIV)
sim_typical |>
  dplyr::filter(!is.na(Cc)) |>
  ggplot2::ggplot(ggplot2::aes(time, Cc, colour = treatment)) +
  ggplot2::geom_line(linewidth = 0.8) +
  ggplot2::labs(x = "Time after dose (h)",
                y = "Plasma metformin (mg/L)",
                title = "Typical-value profile by formulation",
                caption = "Typical-value (zero-IIV) prediction at 1000 mg single dose.")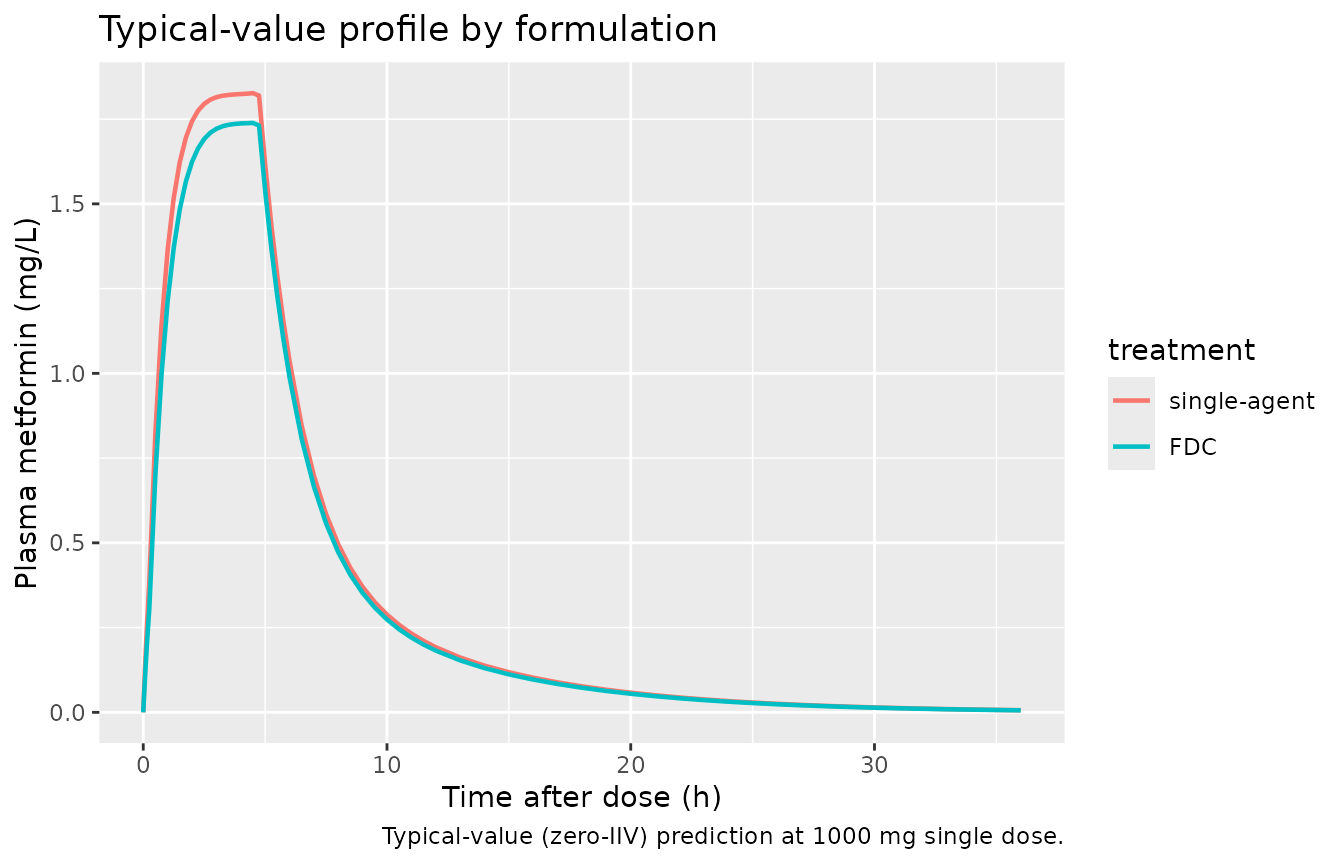
PKNCA validation
# Keep t = 0 with Cc = 0 so PKNCA can integrate AUC from the dose
# time; only filter NAs.
sim_nca <- sim |>
  dplyr::filter(!is.na(Cc)) |>
  dplyr::select(id, time, Cc, treatment) |>
  dplyr::distinct(id, time, .keep_all = TRUE) |>
  as.data.frame()

dose_df <- events |>
  dplyr::filter(evid == 1L, cmt == "depot") |>
  dplyr::select(id, time, amt) |>
  dplyr::left_join(events |> dplyr::select(id, treatment) |>
                     dplyr::distinct(id, treatment),
                   by = "id") |>
  as.data.frame()

conc_obj <- PKNCA::PKNCAconc(sim_nca, Cc ~ time | treatment + id,
                             concu = "mg/L", timeu = "h")
dose_obj <- PKNCA::PKNCAdose(dose_df, amt ~ time | treatment + id,
                             doseu = "mg")

intervals <- data.frame(
  start       = 0,
  end         = 24,
  cmax        = TRUE,
  tmax        = TRUE,
  auclast     = TRUE,
  aucinf.obs  = TRUE,
  half.life   = TRUE
)

nca_res <- suppressWarnings(
  PKNCA::pk.nca(PKNCA::PKNCAdata(conc_obj, dose_obj, intervals = intervals))
)

nca_tbl <- as.data.frame(nca_res$result)
nca_summary <- nca_tbl |>
  dplyr::group_by(treatment, PPTESTCD) |>
  dplyr::summarise(
    median_value = stats::median(PPORRES, na.rm = TRUE),
    q05          = stats::quantile(PPORRES, 0.05, na.rm = TRUE),
    q95          = stats::quantile(PPORRES, 0.95, na.rm = TRUE),
    .groups      = "drop"
  ) |>
  tidyr::pivot_wider(names_from = PPTESTCD,
                     values_from = c(median_value, q05, q95))

knitr::kable(nca_summary,
caption = "Simulated NCA parameters by formulation (median and 90% PI across 100 virtual subjects per arm).")| treatment | median_value_adj.r.squared | median_value_aucinf.obs | median_value_auclast | median_value_clast.obs | median_value_clast.pred | median_value_cmax | median_value_half.life | median_value_lambda.z | median_value_lambda.z.n.points | median_value_lambda.z.time.first | median_value_lambda.z.time.last | median_value_r.squared | median_value_span.ratio | median_value_tlast | median_value_tmax | q05_adj.r.squared | q05_aucinf.obs | q05_auclast | q05_clast.obs | q05_clast.pred | q05_cmax | q05_half.life | q05_lambda.z | q05_lambda.z.n.points | q05_lambda.z.time.first | q05_lambda.z.time.last | q05_r.squared | q05_span.ratio | q05_tlast | q05_tmax | q95_adj.r.squared | q95_aucinf.obs | q95_auclast | q95_clast.obs | q95_clast.pred | q95_cmax | q95_half.life | q95_lambda.z | q95_lambda.z.n.points | q95_lambda.z.time.first | q95_lambda.z.time.last | q95_r.squared | q95_span.ratio | q95_tlast | q95_tmax |
|---|---|---|---|---|---|---|---|---|---|---|---|---|---|---|---|---|---|---|---|---|---|---|---|---|---|---|---|---|---|---|---|---|---|---|---|---|---|---|---|---|---|---|---|---|---|
| FDC | 0.9999311 | 11.77236 | 11.55898 | 0.0329996 | 0.0329024 | 1.704277 | 4.933599 | 0.1404953 | 9 | 16 | 24 | 0.9999405 | 1.657120 | 24 | 4.5 | 0.9999005 | 9.292727 | 9.141886 | 0.0132229 | 0.0131617 | 1.374486 | 4.485303 | 0.1194147 | 6 | 11.5 | 24 | 0.9999141 | 0.9723874 | 24 | 1.25 | 0.9999560 | 16.90487 | 16.23595 | 0.0845698 | 0.0843389 | 2.230276 | 5.804637 | 0.1545374 | 14 | 19 | 24 | 0.9999604 | 2.732051 | 24 | 4.75 |
| single-agent | 0.9999315 | 13.56747 | 13.26974 | 0.0365602 | 0.0364473 | 1.901282 | 4.989245 | 0.1389283 | 9 | 16 | 24 | 0.9999389 | 1.676573 | 24 | 4.5 | 0.9999038 | 9.479661 | 9.401161 | 0.0139780 | 0.0138964 | 1.438393 | 4.428262 | 0.1241664 | 7 | 11.0 | 24 | 0.9999130 | 1.1157093 | 24 | 1.25 | 0.9999545 | 18.33756 | 17.65615 | 0.0828569 | 0.0825704 | 2.337367 | 5.582528 | 0.1565281 | 15 | 18 | 24 | 0.9999596 | 2.824724 | 24 | 4.75 |
Comparison against published exposure ratios
Choi 2018 does not tabulate per-arm mean Cmax / AUC values, but the Discussion notes that the geometric mean ratio of AUC_last from NCA (FDC / single-agent) was 0.9136. The popPK model’s formulation coefficient on relative bioavailability F is 0.940 (Table 3 row “Influence of formulation on bioavailability”). Both quantities describe the same biological effect (lower extent of absorption with the FDC formulation) and should agree within a few percent.
# Geometric mean ratio FDC vs single-agent for AUClast.
auc_arm <- nca_tbl |>
  dplyr::filter(PPTESTCD == "auclast", !is.na(PPORRES)) |>
  dplyr::mutate(treatment = as.character(treatment)) |>
  dplyr::group_by(treatment) |>
  dplyr::summarise(geomean_AUClast = exp(mean(log(PPORRES))),
                   .groups = "drop")

auc_lookup <- setNames(auc_arm$geomean_AUClast, auc_arm$treatment)
sim_ratio  <- unname(auc_lookup[["FDC"]] / auc_lookup[["single-agent"]])

ratio_table <- tibble::tibble(
  source                  = c("Choi 2018 NCA (Discussion)",
                              "Choi 2018 popPK (Table 3)",
                              "Simulated NCA"),
  AUC_ratio_FDC_vs_single = c(0.9136,
                              0.940,
                              sim_ratio)
)

knitr::kable(ratio_table,
             digits  = 3,
caption = "Geometric-mean AUC_last ratio (FDC / single-agent metformin) from published NCA, Choi 2018 popPK structural coefficient, and the simulated NCA on the packaged model.")| source | AUC_ratio_FDC_vs_single |
|---|---|
| Choi 2018 NCA (Discussion) | 0.914 |
| Choi 2018 popPK (Table 3) | 0.940 |
| Simulated NCA | 0.916 |
Assumptions and deviations
-
Mixed zero-and-first-order absorption requires two dose
records per administration. A single oral metformin dose enters
the data table as (a) one dose to compartment
depotwith norate(the first-order absorption arm, scaled byf(depot) = f_rel * F1) and- one dose to compartment
centralwithrate = -2(the zero-order absorption arm, scaled byf(central) = f_rel * (1 - F1)and infused overdur(central) = D2afterlag(central) = ALAG2). Therate = -2flag invokes rxode2’s modelled-duration mechanism; omitting it collapses the zero-order arm into an instantaneous bolus and produces an unrealistically early Cmax. Themake_cohort()helper above shows the canonical pattern.
- one dose to compartment
-
Reference category 0 = single-agent metformin tablet (Choi
2018 orientation). The canonical
FORM_FDCcolumn value semantics (1 = FDC, 0 = single-drug tablet) are preserved across all nlmixr2lib models, but the typical-value reference category is paper-defined. In Choi 2018 the structural Ka and the implicit F = 1.0 are anchored to the single-agent arm (FORM_FDC = 0), so the FDC arm (FORM_FDC = 1) introduces multiplicative shifts ka_FDC = 0.83 * ka_ref and F_FDC = 0.94. This orientation is the opposite of the antitubercular FDC precedent (Wilkins 2008 rifampicin, where the FDC arm is the typical-value reference and the single-drug-tablet SDC arm introduces shifts), but no transformation of the column values is needed – FORM_FDC = 1 always means “FDC tablet”. Documented in the canonical FORM_FDC entry ininst/references/covariate-columns.md(general-scope promotion on 2026-05-30 alongside this extraction). - Single dose strength not reported. Choi 2018 Methods describe “either a test or reference formulation” but do not state the per-occasion mg amount. The vignette uses 1000 mg as a representative dose strength of commercially marketed metformin FDC products in Korea. The choice of dose strength scales the simulated concentrations proportionally but does not affect the formulation AUC and Cmax ratios because both arms receive the same nominal amount and the popPK parameters are apparent-bioavailability scaled.
- Specific FDC co-formulant drug not named. The paper describes “metformin administered as fixed-dose combination” without naming the specific co-formulated antidiabetic. Korean metformin FDC products co-formulate with sitagliptin, glimepiride, vildagliptin, or dapagliflozin among others; the formulation-coefficient estimates Ka = 0.83 and F = 0.94 reflect whichever single FDC product was used in the Choi 2018 study and may not generalise to other metformin co-formulations.
-
Table 1 typographical errors. Choi 2018 Table 1
swaps the row labels for “Weight (kg)” and “Height (cm)” (the values
printed in the Weight row are the height values and vice-versa).
Additionally, the prose narrative “Mean height and weight were 176.0 +/-
3.5 cm and 70.9 +/- 7.9 cm” prints “cm” rather than “kg” for the weight
unit. The corrected values used in this vignette and in the packaged
populationmetadata are taken from the prose narrative, with the units corrected to the conventional kg for weight. -
No additive residual error. Choi 2018 Table 3
reports only a proportional residual error (sigma_prop = 0.259, RSE
2.73%); no additive component was retained in the final model. The
packaged model encodes only
propSd, matching the source. - Multiple peaks during absorption phase. Choi 2018 Discussion notes that the observed concentration profiles in many subjects showed multiple peaks during the absorption phase, attributed to solubility-limited / site-specific absorption, gastric emptying, and gastroduodenal reflux (metformin pharmacology, Choi 2018 refs [6,7,8]). The dual-arm absorption model (first-order + zero-order) captures the broad biexponential absorption envelope but does not attempt to reproduce subject-specific multi-peak features, which the paper acknowledges as “not well captured by the model”.
- No covariates other than formulation were retained. Choi 2018 Results “Covariate Analysis and Formulation Difference” reports that age, weight, height, and creatinine clearance were screened in stepwise selection but none reached significance at p < 0.05; the authors attribute the absence of size / renal-function effects to the narrow demographic range of the healthy-volunteer cohort.