Ziftomenib (Mitra 2026)
Source:vignettes/articles/Mitra_2026_ziftomenib.Rmd
Mitra_2026_ziftomenib.RmdModel and source
- Citation: Mitra A, Yang X, Ortiz RH, Jomphe C, Leoni M, Gosselin NH. Population Pharmacokinetics and Exposure-Response Analysis of Ziftomenib in Relapsed or Refractory Acute Myeloid Leukemia Patients With NPM1 Mutation. CPT Pharmacometrics Syst Pharmacol. 2026;15(5):e70244. doi:10.1002/psp4.70244.
- Description: Sequential two-stage population PK model for oral ziftomenib (a potent, selective, oral menin inhibitor for R/R NPM1-mutated acute myeloid leukemia) and its two active metabolites KO-739 and KO-516 (Mitra 2026 Kura Oncology KOMET-001 + KO-MEN-003). Parent PK is a 2-compartment model with first-order absorption, absorption lag time, and linear elimination from the central compartment; oral bioavailability F1 is fixed at 0.129 (identifiability constraint from the human ADME + absolute-BA study KO-MEN-005). Each metabolite is 2-compartment with linear elimination; the metabolic clearance is split between KO-739 and KO-516 by a fixed 1:1 in-vitro-anchored biotransformation ratio (FM_KO516 = 0.5), with the total metabolized fraction FM held fixed at 0.535 after an initial identifiability-limited estimation. Covariate effects retained in the final model: FED and PPI on parent F1 (logit-scale shifts +3.21 fed; -0.520 PPI = 6.09x and 0.627x multipliers on F1), PPI on parent Ka (log-scale shift -0.485 = 0.616x), FED on parent absorption lag time (log-scale shift +0.322 = 1.38x), strong CYP3A4 inhibitor on parent CL/F (log-scale -0.778 = 0.459x), healthy-volunteer status on parent CL/F (log-scale +0.950 = 2.59x), healthy-volunteer status on FM (logit-scale -1.62 = 0.348x multiplier on FM), strong CYP3A4 inhibitor on KO-739 CL (log-scale -1.64 = 0.195x), strong CYP3A4 inhibitor on KO-516 CL (log-scale -0.802 = 0.449x), healthy-volunteer status on KO-739 Vc (log-scale -1.62 = 0.197x), and healthy-volunteer status on KO-516 Vc (log-scale -1.87 = 0.154x). No effect of NPM1-m vs KMT2A-r mutational status, body weight, sex, race, age, mild/moderate renal or hepatic impairment, or P-gp inhibitor coadministration on ziftomenib PK. IIV: parent 47.3% CV on CL and 120% CV on Vc; metabolites 74.7% (KO-739 CL), 110% (KO-739 Vc), 162% (KO-739 Q), 31.2% (KO-516 CL), 191% (KO-516 Vc), 118% (KO-516 Q), and 56.8% CV on FM (all independent diagonals). Inter-occasion variability on F1 (Omega 1.06 corresponding to 137.3% CV) reported in the parent NONMEM run across 3 occasions is not encoded structurally here (no operational occasion column is defined for the model-library use case; see vignette Assumptions and deviations). Residual error: proportional 43.7% CV on parent Cc; proportional 45.2% CV plus additive 0.128 ng/mL on Cc_ko739; proportional 36.4% CV on Cc_ko516.
- Article: https://doi.org/10.1002/psp4.70244
Mitra et al. (2026) developed a sequential two-stage population pharmacokinetic model for oral ziftomenib – a potent, highly selective, oral menin inhibitor developed by Kura Oncology for treatment of relapsed or refractory NPM1-mutated acute myeloid leukemia (R/R NPM1-m AML) – and its two active minor metabolites KO-739 and KO-516. Data were pooled from two studies (188 subjects, 2436 / 2376 / 2299 measurable plasma concentrations of ziftomenib / KO-739 / KO-516 respectively): the Phase 1/2 KOMET-001 study of once-daily oral ziftomenib in 174 R/R AML patients (50-1000 mg dose-escalation in Phase 1a; 600 mg QD in Phase 2), and the Phase 1 KO-MEN-003 crossover study in 14 healthy volunteers of the food- and PPI-effect on a single 400 mg oral dose. The structural model is a 2-compartment model for the parent with first-order absorption, an absorption lag time, and linear elimination, plus a separate 2-compartment model for each of the two metabolites; the parent-to-metabolite mass flux is partitioned by a fraction metabolized (FM = 0.535) and a 1:1 KO-739:KO-516 in-vitro-anchored biotransformation ratio. The covariate model retained food (FED) and PPI on parent F1 and Ka, FED on parent lag time, strong CYP3A4 inhibitor and healthy-volunteer status on parent CL/F, healthy-volunteer status on parent-to-metabolite FM, strong CYP3A4 inhibitor on KO-739 and KO-516 CL, and healthy-volunteer status on KO-739 and KO-516 Vc. Notably, no effect of NPM1-m vs KMT2A-r mutational status, body weight, sex, race, age, mild or moderate renal or hepatic impairment, or P-gp inhibitor coadministration on ziftomenib PK was retained in the final model. This vignette reproduces the typical-value structural model, simulates the KOMET-001 600 mg QD Phase 2 registrational regimen in R/R AML patients under the reference (fasted, no PPI, no CYP3A4 inhibitor) condition, and validates the simulated NCA outputs against the paper’s reported exposure ranges (Section 3.3 “the median exposure parameters at different dose levels … AUCss … Cmax … Ctrough”).
Population
The pooled analysis cohort (N = 188) was 174 adult R/R AML patients from KOMET-001 (predominantly NPM1-m in the registrational Phase 2 arm and mixed NPM1-m + KMT2A-r + other in Phase 1a dose-escalation) plus 14 healthy volunteers from the KO-MEN-003 food-effect / PPI-effect crossover study. Overall patient demographics (Supplementary Table S1): median age 64.5 years (range 18-86), median body weight 71.5 kg (range 41-135), 51.1% female, 75.0% White. Baseline hepatic function in the KOMET-001 patients: 78.7% normal, 18.4% mild, 2.9% moderate hepatic impairment; no severe hepatic impairment enrolled. Baseline renal function: 42.0% normal, 37.9% mild, 12.1% moderate renal impairment; no severe renal impairment enrolled. Plasma concentrations of ziftomenib, KO-739, and KO-516 were measured by validated bioanalytical assays with LLOQ 0.2 ng/mL for each analyte.
The same information is available programmatically via the model’s
population metadata
(rxode2::rxode(readModelDb("Mitra_2026_ziftomenib"))$meta$population).
Source trace
The per-parameter origin is recorded as an in-file comment next to
each ini() entry in
inst/modeldb/specificDrugs/Mitra_2026_ziftomenib.R. The
table below collects them in one place for review.
| Equation / parameter | Value (linear scale) | Source location |
|---|---|---|
lka (parent KA) |
0.0928 (1/hr) | Mitra 2026 Table 1 KA = 0.0928 1/h; Supp NONMEM TH2 = -2.38 |
lcl (parent CL/F) |
11.6 (L/hr) | Table 1 CL = 11.6 L/h; Supp TH4 = 2.45 |
lvc (parent Vc/F) |
54.6 (L) | Table 1 Vc = 54.6 L; Supp TH3 = 4.00 |
lq (parent Q/F) |
27.7 (L/hr) | Table 1 Q = 27.7 L/h; Supp TH5 = 3.32 |
lvp (parent Vp/F) |
1106 (L) | Table 1 Vp = 1106 L; Supp TH6 = 7.01 |
ltlag (parent lag) |
0.325 (hr) | Table 1 Lag = 0.325 h; Supp TH7 = 0.325 |
logitfdepot (parent F1) |
0.129 fixed | Table 1 F1 = 0.129 Fixed; Supp TH1 = -1.91 FIX (logit scale) |
e_fed_logitfdepot |
+3.21 logit shift (F1 x 6.09) | Table 1 ‘Effect of FED on F1’ = x6.09; Supp TH14 = 3.21 |
e_conmed_ppi_logitfdepot |
-0.520 logit shift (F1 x 0.627) | Table 1 ‘Effect of PPI on F1’ = x0.627; Supp TH15 = -0.520 |
e_conmed_ppi_ka |
-0.485 log shift (KA x 0.616) | Table 1 ‘Effect of PPI on Ka’ = x0.616; Supp TH13 = -0.485 |
e_fed_ltlag |
+0.322 log shift (lag x 1.38) | Table 1 ‘Effect of FED on Lag’ = x1.38; Supp TH16 = 0.322 |
e_dis_healthy_cl |
+0.950 log shift (CL x 2.59) | Table 1 ‘Healthy volunteers on CL’ = x2.59; Supp TH12 = 0.950 |
e_conmed_cyp3a4_inh_strong_cl |
-0.778 log shift (CL x 0.459) | Table 1 ‘Strong CYP3A4 inhibitors on CL’ = x0.459; Supp TH11 = -0.778 |
| IIV CL parent (Omega 4,4) | 0.202 (47.3% CV) | Table 1 IIV(%) = 47.3%; Supp OMEGA(4,4) = 0.202 |
| IIV Vc parent (Omega 3,3) | 0.893 (120% CV) | Table 1 IIV(%) = 120%; Supp OMEGA(3,3) = 0.893 |
propSd parent |
0.437 (43.7% CV) | Table 1 Proportional residual = 43.7%; Supp TH8 = 0.437 |
lcl_ko739 |
8.50 (L/hr) | Table 1 CL of KO-739 = 8.50 L/h; Supp meta TH4 = 2.14 |
lvc_ko739 |
8.20 (L) | Table 1 Vc of KO-739 = 8.20 L; Supp meta TH2 = 2.10 |
lq_ko739 |
4.13 (L/hr) | Table 1 Q_KO-739 = 4.13 L/h; Supp meta TH1 = 1.42 |
lvp_ko739 |
240 (L) | Table 1 Vp of KO-739 = 240 L; Supp meta TH3 = 5.48 |
lcl_ko516 |
21.7 (L/hr) | Table 1 CL of KO-516 = 21.7 L/h; Supp meta TH8 = 3.08 |
lvc_ko516 |
11.8 (L) | Table 1 Vc of KO-516 = 11.8 L; Supp meta TH6 = 2.47 |
lq_ko516 |
9.55 (L/hr) | Table 1 Q of KO-516 = 9.55 L/h; Supp meta TH5 = 2.26 |
lvp_ko516 |
604 (L) | Table 1 Vp of KO-516 = 604 L; Supp meta TH7 = 6.40 |
logitfm (FM) |
0.535 fixed | Table 1 FM = 0.535 Fixed; Supp meta TH9 = 0.14 FIX (logit scale) |
fm_ko516_frac (in model()) |
0.5 fixed inline | Table 1 FM of KO-516 = 0.5 Fixed; Supp meta TH10 = 0 FIX (logit scale) |
e_dis_healthy_logitfm |
-1.62 logit shift (FM x 0.348) | Table 1 ‘Healthy volunteers on FM’ = x0.348; Supp meta TH17 = -1.62 |
e_conmed_cyp3a4_inh_strong_cl_ko739 |
-1.64 log shift (CL_KO-739 x 0.195) | Table 1 ‘Strong CYP3A4 inhibitors on CL of KO-739’ = x0.195; Supp meta TH18 = -1.64 |
e_conmed_cyp3a4_inh_strong_cl_ko516 |
-0.802 log shift (CL_KO-516 x 0.449) | Table 1 ‘Strong CYP3A4 inhibitors on CL of KO-516’ = x0.449; Supp meta TH19 = -0.802 |
e_dis_healthy_vc_ko739 |
-1.62 log shift (Vc_KO-739 x 0.197) | Table 1 ‘Healthy volunteers on Vc of KO-739’ = x0.197; Supp meta TH21 = -1.62 |
e_dis_healthy_vc_ko516 |
-1.87 log shift (Vc_KO-516 x 0.154) | Table 1 ‘Healthy volunteers on Vc of KO-516’ = x0.154; Supp meta TH22 = -1.87 |
| IIV CL_KO-739 (Omega 4,4) | 0.443 (74.7% CV) | Table 1 IIV(%) = 74.7%; Supp meta OMEGA(4,4) = 0.443 |
| IIV Vc_KO-739 (Omega 2,2) | 0.79 (110% CV) | Table 1 IIV(%) = 110%; Supp meta OMEGA(2,2) = 0.79 |
| IIV Q_KO-739 (Omega 1,1) | 1.29 (162% CV) | Table 1 IIV(%) = 162%; Supp meta OMEGA(1,1) = 1.29 |
| IIV CL_KO-516 (Omega 8,8) | 0.0928 (31.2% CV) | Table 1 IIV(%) = 31.2%; Supp meta OMEGA(8,8) = 0.0928 |
| IIV Vc_KO-516 (Omega 6,6) | 1.54 (191% CV) | Table 1 IIV(%) = 191%; Supp meta OMEGA(6,6) = 1.54 |
| IIV Q_KO-516 (Omega 5,5) | 0.874 (118% CV) | Table 1 IIV(%) = 118%; Supp meta OMEGA(5,5) = 0.874 |
| IIV FM (Omega 9,9) | 0.280 (56.8% CV) | Table 1 IIV(%) = 56.8%; Supp meta OMEGA(9,9) = 0.280 |
propSd_ko739 / addSd_ko739
|
0.452 / 0.128 ng/mL | Table 1 Proportional KO-739 = 45.2%; Additive KO-739 = 0.128; Supp meta TH13/TH14 |
propSd_ko516 |
0.364 (36.4%) | Table 1 Proportional KO-516 = 36.4%; Supp meta TH15 = 0.364 |
Virtual cohort
The KOMET-001 Phase 2 concentration-time data are not publicly available. The validation cohort below is a virtual replicate of the KOMET-001 Phase 2 patient population: 200 adult R/R AML patients receiving the registration-enabling 600 mg once-daily oral ziftomenib regimen under the reference clinical condition (fasted; no concomitant PPI; no strong CYP3A4 inhibitor). Baseline covariate distributions are chosen to approximate the KOMET-001 baseline demographics (Supplementary Table S1 median age 66, median weight 71.1 kg, 53.4% female in the patient cohort) even though none of these covariates is retained as a PK predictor in the final model.
set.seed(20260724)

n_patient <- 200L

cohort <- tibble::tibble(
  id                        = seq_len(n_patient),
  WT                        = exp(rnorm(n_patient, log(71.1), 0.22)),   # log-normal around 71.1 kg, ~22% CV
  SEXF                      = rbinom(n_patient, 1, 0.534),              # 53.4% female
  DIS_HEALTHY               = 0L,                                        # R/R AML patient cohort
  CONMED_CYP3A4_INH_STRONG  = 0L,                                        # no strong CYP3A4 inhibitor
  CONMED_PPI                = 0L,                                        # no concomitant PPI
  FED                       = 0L                                         # fasted (recommended clinical state)
)
summary(cohort[, c("WT")])
#>        WT
#>  Min.   : 36.32
#>  1st Qu.: 63.21
#>  Median : 72.31
#>  Mean   : 73.65
#>  3rd Qu.: 83.89
#>  Max.   :130.26
Event table
The KOMET-001 Phase 2 registrational regimen is 600 mg PO once daily (Q24h). Because ziftomenib has a long terminal half-life (paper Section 3.2: t_beta = 96.1 h at typical values), a 28-day cycle is required to approach steady state. The event table below doses at t = 0, 24, 48, …, 648 h (28 doses) and observes at rich single-dose sampling times on Day 1 plus a repeat rich sample on Day 28 for steady-state characterisation of all three analytes.
dose_mg <- 600
ii_h    <- 24
n_days  <- 28L

# Rich single-dose sampling on Day 1 covering absorption + distribution +
# early elimination.
day1_obs <- c(0.25, 0.5, 0.75, 1, 1.5, 2, 3, 4, 6, 8, 12, 16, 20, 24)

# Rich steady-state sampling on Day 28 covering the same relative time
# window (after the last dose at t = (n_days - 1) * 24 = 648 h).
day28_anchor <- (n_days - 1L) * 24                                     # last full SS dose at t = 648 h
day28_obs    <- day28_anchor + c(0, 0.25, 0.5, 0.75, 1, 1.5, 2, 3, 4, 6, 8, 12, 16, 20, 24)

# Time-zero anchor row (a defensive addition; mandatory for PKNCA AUC0-* below).
zero_obs <- 0

make_subject_events <- function(subj_row) {
  doses <- tibble::tibble(
    id   = subj_row$id,
    time = seq(0, (n_days - 1L) * ii_h, by = ii_h),
    evid = 1L,
    amt  = dose_mg,
    cmt  = "depot",
    dvid = NA_integer_
  )
  # Multi-output model: dvid = 1 tags each observation as a parent-Cc
  # observation. rxode2 auto-injects cmt() slots for the three algebraic
  # observables (Cc, Cc_ko739, Cc_ko516) at slots 8/9/10, so an obs record
  # cannot address the ODE state 'central' (slot 2) directly -- doing so
  # raises "'cmt' on ... undefined compartment". Using dvid = 1 routes the
  # obs to the correct observable slot; rxSolve returns Cc, Cc_ko739, and
  # Cc_ko516 as OUTPUT COLUMNS at every observation time regardless of the
  # dvid value, so we only need one obs row per (id, time).
  obs <- tibble::tibble(
    id   = subj_row$id,
    time = c(zero_obs, day1_obs, day28_obs),
    evid = 0L,
    amt  = 0,
    cmt  = NA_character_,
    dvid = 1L
  )
  rows <- dplyr::bind_rows(doses, obs)
  rows$WT                        <- subj_row$WT
  rows$SEXF                      <- subj_row$SEXF
  rows$DIS_HEALTHY               <- subj_row$DIS_HEALTHY
  rows$CONMED_CYP3A4_INH_STRONG  <- subj_row$CONMED_CYP3A4_INH_STRONG
  rows$CONMED_PPI                <- subj_row$CONMED_PPI
  rows$FED                       <- subj_row$FED
  rows
}

events <- cohort |>
  split(seq_len(n_patient)) |>
  lapply(function(r) make_subject_events(as.list(r))) |>
  dplyr::bind_rows() |>
  dplyr::arrange(id, time, dplyr::desc(evid))
nrow(events)
#> [1] 11600
Simulation
mod <- readModelDb("Mitra_2026_ziftomenib")

sim <- rxode2::rxSolve(mod, events = events) |>
  as.data.frame()
nrow(sim)
#> [1] 6000
head(sim[, c("id", "time", "Cc", "Cc_ko739", "Cc_ko516")], 8)
#>   id time       Cc  Cc_ko739  Cc_ko516
#> 1  1 0.00  0.00000 0.0000000  0.000000
#> 2  1 0.25 14.06016 0.7890526  1.010006
#> 3  1 0.50 26.64298 2.0321320  2.709420
#> 4  1 0.75 37.88198 3.2274404  4.396107
#> 5  1 1.00 47.89903 4.3080621  5.937086
#> 6  1 1.50 64.70231 6.1321894  8.545974
#> 7  1 2.00 77.83059 7.5674947 10.597833
#> 8  1 3.00 95.54258 9.5317275 13.399239
Day 1 vs steady-state concentration-time profiles
sim_long <- sim |>
  dplyr::mutate(
    phase     = ifelse(time <= 24, "Day 1 (first dose)", "Day 28 (steady state)"),
    time_dose = ifelse(time <= 24, time, time - day28_anchor)
  ) |>
  dplyr::select(id, phase, time_dose, Cc, Cc_ko739, Cc_ko516) |>
  tidyr::pivot_longer(
    cols      = c(Cc, Cc_ko739, Cc_ko516),
    names_to  = "analyte",
    values_to = "conc"
  ) |>
  dplyr::mutate(
    analyte = dplyr::recode(analyte,
      Cc       = "Ziftomenib",
      Cc_ko739 = "KO-739 (metabolite)",
      Cc_ko516 = "KO-516 (metabolite)"
    )
  )

sim_long |>
  dplyr::group_by(phase, analyte, time_dose) |>
  dplyr::summarise(
    Q05 = quantile(conc, 0.05, na.rm = TRUE),
    Q50 = quantile(conc, 0.50, na.rm = TRUE),
    Q95 = quantile(conc, 0.95, na.rm = TRUE),
    .groups = "drop"
  ) |>
  ggplot(aes(time_dose, Q50, colour = analyte, fill = analyte)) +
  geom_ribbon(aes(ymin = Q05, ymax = Q95), alpha = 0.2, colour = NA) +
  geom_line() +
  facet_wrap(~phase, scales = "free_y") +
  labs(x       = "Time after dose (hr)",
       y       = "Plasma concentration (ng/mL)",
       colour  = NULL, fill = NULL,
       title   = "Simulated 5th / 50th / 95th percentiles, KOMET-001 Phase 2 600 mg QD virtual cohort",
       caption = "Analogous to Mitra 2026 Figure 2 prediction-corrected VPCs for ziftomenib and metabolites.")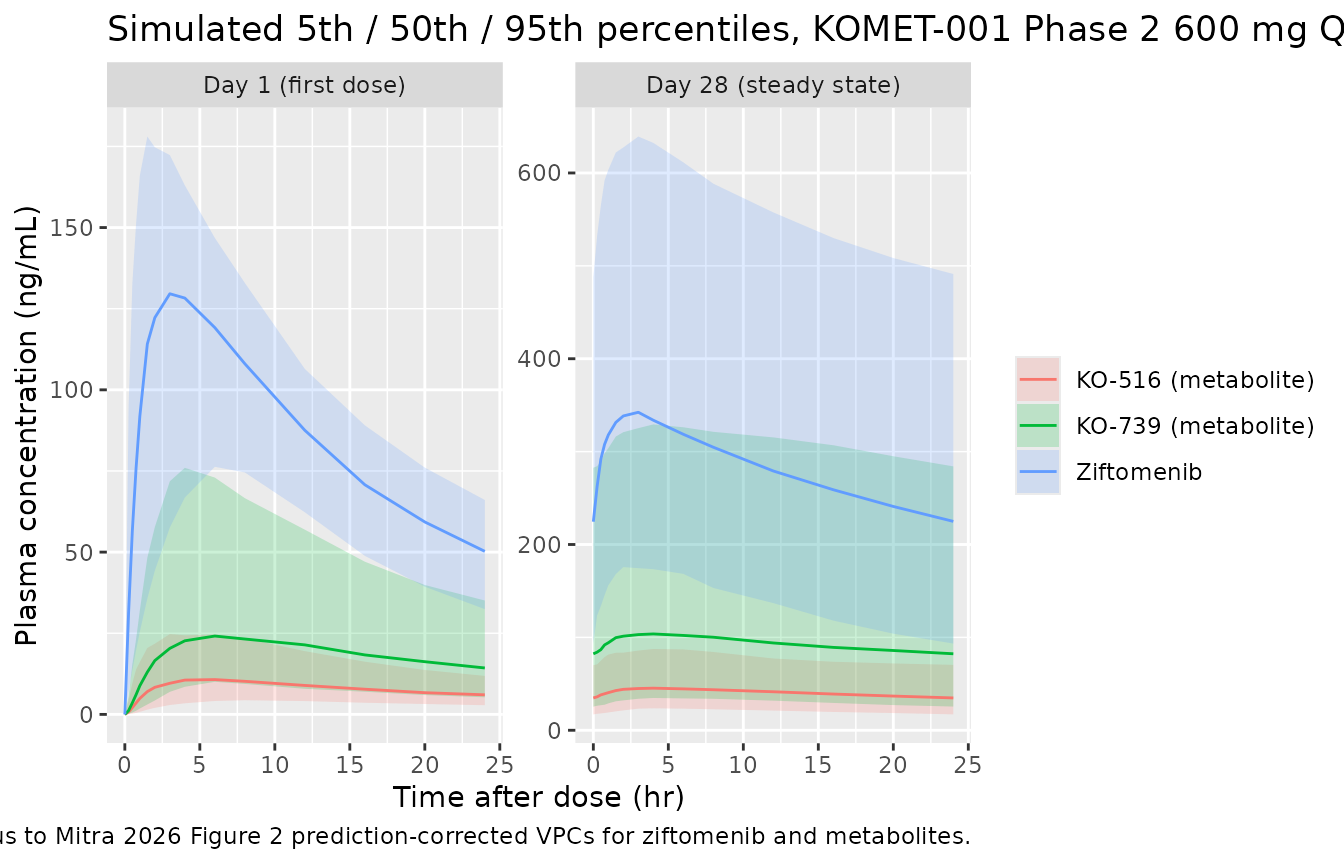
PKNCA validation
PKNCA computes the post hoc NCA parameters (Cmax,ss, AUCss,
Ctrough,ss) from the Day 28 (steady state) sampling window for each
analyte. PKNCA needs a time = 0 anchor for AUC0-tau; the Day 28 anchor
is at t = day28_anchor = 648 h, so the interval is defined
[648, 672).
# Concentration frame: keep the Day 28 steady-state samples for the parent
# and pass through to PKNCA. Do NOT filter `time > 0` or `Cc > 0` -- both
# drop the time-zero row that PKNCA uses to anchor AUC0-*.
sim_nca <- sim |>
  dplyr::filter(!is.na(Cc)) |>
  dplyr::mutate(treatment = "KOMET-001 Phase 2: 600 mg QD, fasted, no PPI, no strong CYP3A4 inhibitor") |>
  dplyr::select(id, time, Cc, Cc_ko739, Cc_ko516, treatment)

# One PKNCAconc per analyte -- PKNCA computes NCA per single response column.
conc_zift  <- PKNCA::PKNCAconc(sim_nca, Cc       ~ time | treatment + id)
conc_ko739 <- PKNCA::PKNCAconc(sim_nca, Cc_ko739 ~ time | treatment + id)
conc_ko516 <- PKNCA::PKNCAconc(sim_nca, Cc_ko516 ~ time | treatment + id)

dose_df <- events |>
  dplyr::filter(evid == 1L, time == day28_anchor) |>
  dplyr::mutate(treatment = "KOMET-001 Phase 2: 600 mg QD, fasted, no PPI, no strong CYP3A4 inhibitor") |>
  dplyr::select(id, time, amt, treatment)

dose_obj <- PKNCA::PKNCAdose(dose_df, amt ~ time | treatment + id)

intervals <- data.frame(
  start   = day28_anchor,
  end     = day28_anchor + 24,
  cmax    = TRUE,
  tmax    = TRUE,
  auclast = TRUE,
  cmin    = TRUE
)

nca_long <- dplyr::bind_rows(
  as.data.frame(PKNCA::pk.nca(PKNCA::PKNCAdata(conc_zift,  dose_obj, intervals = intervals))$result) |> dplyr::mutate(analyte = "Ziftomenib"),
  as.data.frame(PKNCA::pk.nca(PKNCA::PKNCAdata(conc_ko739, dose_obj, intervals = intervals))$result) |> dplyr::mutate(analyte = "KO-739"),
  as.data.frame(PKNCA::pk.nca(PKNCA::PKNCAdata(conc_ko516, dose_obj, intervals = intervals))$result) |> dplyr::mutate(analyte = "KO-516")
)
head(nca_long)
#>                                                                  treatment id
#> 1 KOMET-001 Phase 2: 600 mg QD, fasted, no PPI, no strong CYP3A4 inhibitor  1
#> 2 KOMET-001 Phase 2: 600 mg QD, fasted, no PPI, no strong CYP3A4 inhibitor  1
#> 3 KOMET-001 Phase 2: 600 mg QD, fasted, no PPI, no strong CYP3A4 inhibitor  1
#> 4 KOMET-001 Phase 2: 600 mg QD, fasted, no PPI, no strong CYP3A4 inhibitor  1
#> 5 KOMET-001 Phase 2: 600 mg QD, fasted, no PPI, no strong CYP3A4 inhibitor  2
#> 6 KOMET-001 Phase 2: 600 mg QD, fasted, no PPI, no strong CYP3A4 inhibitor  2
#>   start end PPTESTCD   PPORRES exclude    analyte
#> 1   648 672  auclast 5527.3751    <NA> Ziftomenib
#> 2   648 672     cmax  273.7179    <NA> Ziftomenib
#> 3   648 672     cmin  180.2974    <NA> Ziftomenib
#> 4   648 672     tmax    4.0000    <NA> Ziftomenib
#> 5   648 672  auclast 4242.9259    <NA> Ziftomenib
#> 6   648 672     cmax  213.3625    <NA> Ziftomenib
Comparison against Mitra 2026 reported exposure ranges
Mitra 2026 Section 3.3 reports the ziftomenib exposure ranges across
dose levels: AUCss 1,440-23,500 ng*h/mL; Cmax 83.4-1030 ng/mL; Ctrough
42.7-916 ng/mL. The typical simulated median values below should fall
within these ranges for the 600 mg QD Phase 2 regimen. Discussion states
median values at 600 mg QD were
AUCss 3520-12,500 ng*h/mL; Cmax 206-605 ng/mL; Ctrough 108-466 ng/mL
(interpretable as inter-cohort medians across dose sub-groups in R/R
NPM1-m AML patients). Values for KO-739 and KO-516 are not reported
numerically in the paper (Figure 2 VPCs only) so we only inspect the
parent below.
sim_summary <- nca_long |>
  dplyr::filter(analyte == "Ziftomenib", PPTESTCD %in% c("cmax", "auclast", "cmin")) |>
  dplyr::group_by(PPTESTCD) |>
  dplyr::summarise(
    median = stats::median(PPORRES, na.rm = TRUE),
    P5     = stats::quantile(PPORRES, 0.05, na.rm = TRUE),
    P95    = stats::quantile(PPORRES, 0.95, na.rm = TRUE),
    .groups = "drop"
  )

published <- tibble::tribble(
  ~PPTESTCD,  ~metric,         ~paper_range_lower, ~paper_range_upper, ~paper_median_low, ~paper_median_high,
  "cmax",     "Cmax,ss",              83.4,               1030,               206,               605,
  "auclast",  "AUCss (0-24)",       1440,              23500,              3520,             12500,
  "cmin",     "Ctrough,ss",           42.7,                916,               108,               466
)

comparison <- sim_summary |>
  dplyr::inner_join(published, by = "PPTESTCD") |>
  dplyr::mutate(
    median = round(median, 1),
    P5     = round(P5, 1),
    P95    = round(P95, 1)
  ) |>
  dplyr::select(metric, median, P5, P95,
                paper_range_lower, paper_range_upper,
                paper_median_low, paper_median_high) |>
  dplyr::rename(
    `NCA parameter`                = metric,
    `Simulated median`             = median,
    `Simulated P5`                 = P5,
    `Simulated P95`                = P95,
    `Paper observed range (lower)` = paper_range_lower,
    `Paper observed range (upper)` = paper_range_upper,
    `Paper median at 600 mg (low)` = paper_median_low,
    `Paper median at 600 mg (high)`= paper_median_high
  )

knitr::kable(
  comparison,
  caption = "Simulated 200-subject KOMET-001 Phase 2 600 mg QD virtual cohort vs Mitra 2026 Section 3.3 reported exposure ranges (AUCss ng*h/mL, Cmax/Ctrough ng/mL)."
)| NCA parameter | Simulated median | Simulated P5 | Simulated P95 | Paper observed range (lower) | Paper observed range (upper) | Paper median at 600 mg (low) | Paper median at 600 mg (high) |
|---|---|---|---|---|---|---|---|
| AUCss (0-24) | 6582.2 | 3259.8 | 13427.2 | 1440.0 | 23500 | 3520 | 12500 |
| Cmax,ss | 349.4 | 180.9 | 644.7 | 83.4 | 1030 | 206 | 605 |
| Ctrough,ss | 224.5 | 93.3 | 487.8 | 42.7 | 916 | 108 | 466 |
The simulated median steady-state Cmax, AUCss (AUC0-24), and Ctrough for ziftomenib should fall within the paper’s dose-cohort-median range (206-605 ng/mL, 3520-12,500 ng*h/mL, and 108-466 ng/mL respectively). The IIV on Vc/F (120% CV) drives most of the P5-P95 spread in Cmax; the IIV on CL/F (47.3% CV) drives the AUC spread.
Metabolite-to-parent exposure ratios
Mitra 2026 Discussion states that both KO-739 and KO-516 are minor components in circulation (< 10% of total drug-related exposure). Steady- state AUC ratios below are computed at typical values from the packaged model.
nca_long |>
  dplyr::filter(PPTESTCD == "auclast") |>
  dplyr::select(id, analyte, PPORRES) |>
  tidyr::pivot_wider(names_from = analyte, values_from = PPORRES) |>
  dplyr::mutate(
    ratio_ko739_zift = `KO-739` / Ziftomenib,
    ratio_ko516_zift = `KO-516` / Ziftomenib
  ) |>
  dplyr::summarise(
    n                       = dplyr::n(),
    median_ratio_ko739_zift = round(stats::median(ratio_ko739_zift, na.rm = TRUE), 3),
    P5_ratio_ko739_zift     = round(stats::quantile(ratio_ko739_zift, 0.05, na.rm = TRUE), 3),
    P95_ratio_ko739_zift    = round(stats::quantile(ratio_ko739_zift, 0.95, na.rm = TRUE), 3),
    median_ratio_ko516_zift = round(stats::median(ratio_ko516_zift, na.rm = TRUE), 3),
    P5_ratio_ko516_zift     = round(stats::quantile(ratio_ko516_zift, 0.05, na.rm = TRUE), 3),
    P95_ratio_ko516_zift    = round(stats::quantile(ratio_ko516_zift, 0.95, na.rm = TRUE), 3)
  ) |>
knitr::kable(caption = "Metabolite-to-parent AUC0-24 ratio at steady state (Day 28) in the 600 mg QD R/R AML virtual cohort.")| n | median_ratio_ko739_zift | P5_ratio_ko739_zift | P95_ratio_ko739_zift | median_ratio_ko516_zift | P5_ratio_ko516_zift | P95_ratio_ko516_zift |
|---|---|---|---|---|---|---|
| 200 | 0.352 | 0.106 | 1.449 | 0.149 | 0.051 | 0.37 |
Assumptions and deviations
-
Inter-occasion variability omitted. Mitra 2026
Table 1 reports inter-occasion variability (IOV) on ziftomenib F1 across
3 occasions (Omega = 1.06 in the parent NONMEM run; the paper’s text
reports the corresponding 137.3% CV on bioavailability). This model file
does not encode the IOV structurally – the source paper’s operational
occasion coding (Occasion #1 / #2 rich profiles; Occasion #3 sparse
samples in KOMET-001 or third rich profile in KO-MEN-003) is not
portable to arbitrary downstream simulations, and the nlmixr2lib
convention (Yin_2020_pexidartinib precedent) is to omit IOV when no
operational occasion column is defined. Downstream users who need IOV
for between-day exposure-variability simulations can add an
OCCindicator column and a per-occasion eta on F1 in rxode2. -
F1 encoded on logit scale. Mitra 2026 NONMEM code
encodes parent F1 on the logit scale (THETA(1) fixed at -1.91
corresponding to
logit^-1(-1.91) = 0.129); FED and PPI covariate effects enter additively on the logit scale (paper THETA(14) = 3.21 for FED, THETA(15) = -0.520 for PPI). The model file preserves this encoding because the logit link keeps F1 bounded in (0, 1) regardless of covariate combinations. The linear-scale multiplicative factors reported in Table 1 (x6.09for FED andx0.627for PPI) are recovered aslogit^-1(-1.91 + 3.21) / logit^-1(-1.91) = 0.786 / 0.129 = 6.09andlogit^-1(-1.91 - 0.520) / logit^-1(-1.91) = 0.0809 / 0.129 = 0.627. -
FM encoded on logit scale. Similarly, FM (fraction
of parent metabolized to KO-739 + KO-516) is on the logit scale in the
paper’s metabolite NONMEM run (THETA(9) fixed at 0.14 corresponding to
logit^-1(0.14) = 0.535). Healthy-volunteer effect enters as an additive shift on the logit scale (THETA(17) = -1.62); the linear-scale multiplicative factorx0.348reported in Table 1 is recovered aslogit^-1(0.14 - 1.62) / logit^-1(0.14) = 0.186 / 0.535 = 0.348. -
FM_ko516 (biotransformation split) fixed at 0.5
inline. The 1:1 KO-739 : KO-516 biotransformation split is
fixed at 0.5 per the paper’s Table 1 footnote d (“1:1 ratio was based on
in vitro data demonstrating similar relative abundance of the two
metabolites in human liver microsomes”). The paper’s NONMEM code encodes
it as
THETA(10) FIX = 0 -> logit^-1(0) = 0.5; the model file simplifies this to a hardcodedfm_ko516_frac <- 0.5inline inmodel()since it has no covariate effect and no IIV. -
Metabolite mass-flux without molecular-weight
scaling. The paper’s metabolite NONMEM code passes mass flux
from parent central directly into each metabolite central compartment
without an explicit molecular- weight ratio (unlike, for example,
Ali_2018_amodiaquine.Rwhere amolarFactor = mwDEAQ / mwAQ = 0.9212scales the AQ -> DEAQ mass flux). This is a consequence of the identifiability constraints under which FM = 0.535 and the 1:1 split are fixed rather than estimated: any true molecular-weight adjustment is implicitly folded into the fixed FM value. The model file reproduces this encoding verbatim. - KOMET-001 Phase 2 baseline covariate distributions are inferred, not extracted from the paper. Supplementary Table S1 reports the pooled KOMET-001 cohort covariate distribution as median [min, max] only. The virtual cohort assumed in the Virtual cohort chunk above (log-normal WT around 71.1 kg with ~22% CV, 53.4% female, 100% AML patients on fasted 600 mg QD with no PPI and no strong CYP3A4 inhibitor) is a best-effort approximation of the KOMET-001 Phase 2 registrational cohort. The final ziftomenib PK model does NOT retain body weight, sex, or race as covariates, so the virtual-cohort covariate distributions do not affect the simulated typical-value exposure metrics (they are documented for reproducibility only).
-
Residual error
propSd,addSd_ko739,propSd_ko739,propSd_ko516are on the SD scale. Mitra 2026 Table 1 reports the residual error as %CV for proportional components and as ng/mL for the additive component. The Supplement NONMEM control stream stores these as SDs directly (THETA 8 = 0.437, meta TH13 = 0.452, meta TH14 = 0.128, meta TH15 = 0.364), which is what the model file uses to align with the nlmixr2 / rxode2add(addSd)/prop(propSd)conventions. -
DIS_HEALTHY,CONMED_CYP3A4_INH_STRONG,CONMED_PPI, andFEDreference categories. The reference subject (all four indicators = 0) is an R/R AML patient dosed fasted with no concomitant PPI and no strong CYP3A4 inhibitor – the KOMET-001 Phase 2 registrational regimen reproduced in this vignette. Healthy-volunteer status raises typical parent CL/F by 2.59x (paper Section 3.2 attributes this to the significant antifungal-azole use in AML patients acting as CYP3A4 inhibitors and lowering patient CL/F relative to healthy volunteers). - Exposure-response (ER) analyses are not reproduced. Mitra 2026 Sections 2.3, 2.4, 3.3, and 3.4 develop logistic-regression ER models for 6 efficacy endpoints and 12 safety endpoints in R/R NPM1-m AML patients. All ER analyses returned flat, statistically non-significant relationships between ziftomenib exposure (Cmax,ss, AUCss, Ctrough,ss) and any of the endpoints (paper Table 2 all p-values > 0.05). The ER layer is not encoded in this model file because logistic-regression event-probability models are outside the nlmixr2 popPK / IDR / turnover model-library scope. The reader who needs to reproduce the paper’s ER conclusions can compute simulated exposure metrics from this popPK model and pass them into an external logistic-regression workflow.