Rifampicin, isoniazid, pyrazinamide and ethambutol with alcohol and substance use (Wijk 2024)
Source:vignettes/articles/Wijk_2024_first_line_tb_drugs.Rmd
Wijk_2024_first_line_tb_drugs.Rmd
library(nlmixr2lib)
library(rxode2)
library(PKNCA)
library(dplyr)
library(ggplot2)

rxode2::rxSetSeed(20240708)
set.seed(20240708)
Wijk et al. (2024) studied whether alcohol and illicit substance use alter the steady-state pharmacokinetics of the four first-line tuberculosis drugs in adults starting treatment in Worcester, South Africa (the TRUST cohort). The paper develops four separate population PK models, one per drug, and this package ships them as four model files that share this vignette:
rif <- nlmixr2lib::readModelDb("Wijk_2024_rifampicin")
inh <- nlmixr2lib::readModelDb("Wijk_2024_isoniazid")
pza <- nlmixr2lib::readModelDb("Wijk_2024_pyrazinamide")
emb <- nlmixr2lib::readModelDb("Wijk_2024_ethambutol")
Reference: Wijk M, Gausi K, Malatesta S, Weber SE, Court R, Myers B, Carney T, Parry CDH, Horsburgh CR, White LF, Wiesner L, Warren RM, Uren C, McIlleron H, Kloprogge F, Denti P, Jacobson KR. The impact of alcohol and illicit substance use on the pharmacokinetics of first-line TB drugs. J Antimicrob Chemother 2024;79(8):2022. doi:10.1093/jac/dkae206
The headline finding is negative: no clinically relevant effect of alcohol use on any of the four drugs. The covariates that did survive are a 19% lower rifampicin bioavailability with methaqualone (Mandrax) use, NAT2 acetylator phenotype on isoniazid, creatinine clearance on ethambutol clearance, and fat-free mass as the size descriptor for all four drugs.
Population
| Characteristic | Median (IQR) or n (%) |
|---|---|
| Participants | 104 |
| Male | 73 (70%) |
| Age (years) | 37.0 (27.0-48.3) |
| Weight (kg) | 51.4 (45.5-56.9) |
| Fat-free mass (kg) | 43.1 (35.8-47.0) |
| Creatinine clearance (mL/min) | 128 (105-150) |
| Alcohol use low / moderate / high / missing | 30 (29%) / 44 (42%) / 29 (28%) / 1 (1%) |
| Methaqualone use (urine test) | 29 (28%) |
| NAT2 genotype available | 34 (33%): 32% slow, 41% intermediate, 27% fast |
Values reproduce Table 1 of the source. Participants were at least 15 years old, without HIV, and had drug-susceptible pulmonary tuberculosis. They took fixed-dose combination tablets once daily (rifampicin 150 mg, isoniazid 75 mg, pyrazinamide 400 mg, ethambutol 275 mg per tablet) with the number of tablets set by WHO weight band, and were sampled under fasting conditions 4-8 weeks into treatment, pre-dose and at 1.5, 3, 5 and 8 h post-dose.
Source trace
Every ini() value carries an in-file comment naming its
source location. The table below is the vignette-level summary.
| Quantity | Rifampicin | Isoniazid | Pyrazinamide | Ethambutol | Source |
|---|---|---|---|---|---|
| Disposition | 1-cmt, liver compartment | 2-cmt, algebraic liver | 1-cmt | 2-cmt | Results; supplementary control streams |
| Clearance (L/h, FFM 43.4 kg) | CLint,max*fu 42.5, Km 7 mg/L | CLint*fu 14.8 / 36.3 / 62.4 (slow / int. / fast) | 4.48 | 48.8 | Table 2 |
| Vc (L) | 55.1 | 59.3 | 41.4 | 233 | Table 2 |
| Vp (L), Q (L/h) | - | 38.2, 3.45 | - | 510, 34.4 | Table 2 |
| ka (1/h) | 1.82 | 3.28 (held constant) | 1.89 | 1.39 | Table 2 |
| MTT (h) | 0.689 | 0.681 | 0.289 | 0.451 | Table 2 |
| NN in KTR = (NN+1)/MTT | 17 | 0 | 2.73 | 2.01 | control streams (Table 2 prints 17, 1, 3.73, 3.01) |
| QH, VH (FFM 56.1 kg) | 90 L/h, 1 L | 90 L/h | - | - | Table 2 footnote d; control streams |
| Covariates | methaqualone on F (+19.2% in non-users) | NAT2 on CLint | 2.49-fold BOV for unobserved doses | CrCl on CL (+0.264% per mL/min) | control streams; Results |
| BSV on clearance | 35.2% | 29.3% | 20.3% | 16.3% | Table 2 |
| BOV on F / ka / MTT | 5.40 / 136 / 79.9% | 22.3 / 130 / 67.5% | 10.8 / 69.1 / 90.2% | 19.8 / 112 / 94.2% | Table 2 |
| Residual error | 13.7%, 0.0234 mg/L | 17.0%, 0.021 mg/L | 2.66%, 0.63 mg/L | 10.5%, 0.0169 mg/L | Table 2; control-stream ADD = THETA + 0.2*LLOQ
|
The supplement reproduces the four final NONMEM control streams.
Their $THETA and $OMEGA blocks match Table 2
(rifampicin to within 0.3%, the others to the printed digits), so the
control streams supply structure and the rows Table 2 omits, and Table 2
supplies the estimated values.
Structural verification
These checks compare a solve against its own closed form with the same parameters on both sides, so the only difference is numerical integration error, and they are asserted tightly.
trap <- function(time, conc) {
  sum(diff(time) * (utils::head(conc, -1) + utils::tail(conc, -1)) / 2)
}

# Once-daily oral doses into the absorption compartment, with a fine
# observation grid over the last dosing interval. Times are returned relative
# to the last dose.
daily_events <- function(amt, n_dose = 14, step = 0.01) {
  last <- 24 * (n_dose - 1)
  dose <- data.frame(time = 24 * (seq_len(n_dose) - 1), amt = amt, evid = 1,
                     cmt = "depot")
  obs <- data.frame(time = seq(last, last + 24, by = step), amt = NA_real_,
                    evid = 0, cmt = "central")
  ev <- rbind(dose, obs)
  ev[order(ev$time, -ev$evid), ]
}

typical_last_interval <- function(model, amt, covariates, n_dose = 14) {
  ev <- daily_events(amt, n_dose = n_dose)
  for (nm in names(covariates)) ev[[nm]] <- covariates[[nm]]
  out <- rxode2::rxSolve(rxode2::zeroRe(model), ev, returnType = "data.frame")
  out <- out[out$time >= 24 * (n_dose - 1), ]
  out$time <- out$time - 24 * (n_dose - 1)
  out
}
Pyrazinamide and ethambutol: steady-state mass
balance. At steady state the amount eliminated over one dosing
interval equals the dose, so CL * AUCtau must equal the
administered amount. This pins the unit chain (mg, L, mg/L) and confirms
that the transit density delivers each dose exactly once. For ethambutol
the creatinine clearance is set to the 127.1 mL/min centring value of
the control stream (age 37 years and a serum creatinine back-solved from
it), so clearance takes its tabulated value of 48.8 L/h.
creat_ref <- (140 - 37) * 52 * 88.4 / (72 * 127.1)

pza_ss <- typical_last_interval(pza, 1200, list(FFM = 43.4, OCC = 2, SELFADMIN = 0))
#> ℹ parameter labels from comments will be replaced by 'label()'
#> Warning: some etas defaulted to non-mu referenced, possible parsing error: etaiov_fdepot_1, etaiov_fdepot_2, etaiov_ka_1, etaiov_ka_2, etaiov_mtt_1, etaiov_mtt_2
#> as a work-around try putting the mu-referenced expression on a simple line
#> Warning: some etas defaulted to non-mu referenced, possible parsing error: etaiov_fdepot_1, etaiov_fdepot_2, etaiov_ka_1, etaiov_ka_2, etaiov_mtt_1, etaiov_mtt_2
#> as a work-around try putting the mu-referenced expression on a simple line
#> ℹ omega/sigma items treated as zero: 'etalcl', 'etaiov_fdepot_1', 'etaiov_fdepot_2', 'etaiov_ka_1', 'etaiov_ka_2', 'etaiov_mtt_1', 'etaiov_mtt_2'
emb_ss <- typical_last_interval(
  emb, 3 * 275 * 0.74,
  list(FFM = 43.4, OCC = 2, AGE = 37, CREAT = creat_ref)
)
#> ℹ parameter labels from comments will be replaced by 'label()'
#> Warning: some etas defaulted to non-mu referenced, possible parsing error: etaiov_fdepot_1, etaiov_fdepot_2, etaiov_ka_1, etaiov_ka_2, etaiov_mtt_1, etaiov_mtt_2
#> as a work-around try putting the mu-referenced expression on a simple line
#> Warning: some etas defaulted to non-mu referenced, possible parsing error: etaiov_fdepot_1, etaiov_fdepot_2, etaiov_ka_1, etaiov_ka_2, etaiov_mtt_1, etaiov_mtt_2
#> as a work-around try putting the mu-referenced expression on a simple line
#> ℹ omega/sigma items treated as zero: 'etalcl', 'etaiov_fdepot_1', 'etaiov_fdepot_2', 'etaiov_ka_1', 'etaiov_ka_2', 'etaiov_mtt_1', 'etaiov_mtt_2'

mass_balance <- c(
  pyrazinamide = 4.48 * trap(pza_ss$time, pza_ss$Cc) / 1200,
  ethambutol = 48.8 * trap(emb_ss$time, emb_ss$Cc) / (3 * 275 * 0.74)
)
stopifnot(abs(mass_balance - 1) < 1e-3)
mass_balance
#> pyrazinamide   ethambutol
#>    0.9999999    0.9999974
Isoniazid and rifampicin: the well-stirred liver identity. With a well-stirred liver, first-pass loss removes a fraction EH of the dose while systemic hepatic clearance is QH * EH, and the two cancel: the apparent oral clearance is exactly the unbound intrinsic clearance, whatever the hepatic blood flow. For isoniazid this must hold for each NAT2 phenotype at steady state. For rifampicin intrinsic clearance is saturable, so the identity holds only in the linear limit; a 1 mg single dose keeps the liver concentration far below Km = 7 mg/L, so dose / AUC must recover CLint,max * fu = 42.5 L/h in a methaqualone user (F = 1) and 42.5 / 1.191955 L/h in a non-user.
phenotypes <- data.frame(
  phenotype = c("Slow", "Intermediate", "Fast"),
  NAT2_SLOW = c(1, 0, 0),
  NAT2_RAPID = c(0, 0, 1),
  clint = c(14.8, 36.3, 62.4)
)
inh_ss <- lapply(seq_len(nrow(phenotypes)), function(i) {
  typical_last_interval(inh, 225, list(
    FFM = 43.4, OCC = 2,
    NAT2_SLOW = phenotypes$NAT2_SLOW[i], NAT2_RAPID = phenotypes$NAT2_RAPID[i]
  ))
})
#> ℹ parameter labels from comments will be replaced by 'label()'
#> Warning: some etas defaulted to non-mu referenced, possible parsing error: etaiov_fdepot_1, etaiov_fdepot_2, etaiov_ka_1, etaiov_ka_2, etaiov_mtt_1, etaiov_mtt_2
#> as a work-around try putting the mu-referenced expression on a simple line
#> Warning: some etas defaulted to non-mu referenced, possible parsing error: etaiov_fdepot_1, etaiov_fdepot_2, etaiov_ka_1, etaiov_ka_2, etaiov_mtt_1, etaiov_mtt_2
#> as a work-around try putting the mu-referenced expression on a simple line
#> ℹ omega/sigma items treated as zero: 'etalclint', 'etaiov_fdepot_1', 'etaiov_fdepot_2', 'etaiov_ka_1', 'etaiov_ka_2', 'etaiov_mtt_1', 'etaiov_mtt_2'
#> ℹ parameter labels from comments will be replaced by 'label()'
#> Warning: some etas defaulted to non-mu referenced, possible parsing error: etaiov_fdepot_1, etaiov_fdepot_2, etaiov_ka_1, etaiov_ka_2, etaiov_mtt_1, etaiov_mtt_2
#> as a work-around try putting the mu-referenced expression on a simple line
#> Warning: some etas defaulted to non-mu referenced, possible parsing error: etaiov_fdepot_1, etaiov_fdepot_2, etaiov_ka_1, etaiov_ka_2, etaiov_mtt_1, etaiov_mtt_2
#> as a work-around try putting the mu-referenced expression on a simple line
#> ℹ omega/sigma items treated as zero: 'etalclint', 'etaiov_fdepot_1', 'etaiov_fdepot_2', 'etaiov_ka_1', 'etaiov_ka_2', 'etaiov_mtt_1', 'etaiov_mtt_2'
#> ℹ parameter labels from comments will be replaced by 'label()'
#> Warning: some etas defaulted to non-mu referenced, possible parsing error: etaiov_fdepot_1, etaiov_fdepot_2, etaiov_ka_1, etaiov_ka_2, etaiov_mtt_1, etaiov_mtt_2
#> as a work-around try putting the mu-referenced expression on a simple line
#> Warning: some etas defaulted to non-mu referenced, possible parsing error: etaiov_fdepot_1, etaiov_fdepot_2, etaiov_ka_1, etaiov_ka_2, etaiov_mtt_1, etaiov_mtt_2
#> as a work-around try putting the mu-referenced expression on a simple line
#> ℹ omega/sigma items treated as zero: 'etalclint', 'etaiov_fdepot_1', 'etaiov_fdepot_2', 'etaiov_ka_1', 'etaiov_ka_2', 'etaiov_mtt_1', 'etaiov_mtt_2'
phenotypes$oral_cl <- vapply(inh_ss, function(p) 225 / trap(p$time, p$Cc), numeric(1))

rif_lowdose <- function(methaqualone) {
  ev <- data.frame(
    time = c(0, seq(0, 72, by = 0.01)), amt = c(1, rep(NA, 7201)),
    evid = c(1, rep(0, 7201)), cmt = c("depot", rep("central", 7201)),
    FFM = 43.4, OCC = 2, CONMED_METHAQUALONE = methaqualone
  )
  out <- rxode2::rxSolve(rxode2::zeroRe(rif), ev, returnType = "data.frame")
  1 / trap(out$time, out$Cc)
}
rif_cl <- c(user = rif_lowdose(1), non_user = rif_lowdose(0))
#> ℹ parameter labels from comments will be replaced by 'label()'
#> Warning: some etas defaulted to non-mu referenced, possible parsing error: etaiov_fdepot_1, etaiov_fdepot_2, etaiov_ka_1, etaiov_ka_2, etaiov_mtt_1, etaiov_mtt_2
#> as a work-around try putting the mu-referenced expression on a simple line
#> Warning: some etas defaulted to non-mu referenced, possible parsing error: etaiov_fdepot_1, etaiov_fdepot_2, etaiov_ka_1, etaiov_ka_2, etaiov_mtt_1, etaiov_mtt_2
#> as a work-around try putting the mu-referenced expression on a simple line
#> ℹ omega/sigma items treated as zero: 'etalclint_max', 'etaiov_fdepot_1', 'etaiov_fdepot_2', 'etaiov_ka_1', 'etaiov_ka_2', 'etaiov_mtt_1', 'etaiov_mtt_2'
#> ℹ parameter labels from comments will be replaced by 'label()'
#> Warning: some etas defaulted to non-mu referenced, possible parsing error: etaiov_fdepot_1, etaiov_fdepot_2, etaiov_ka_1, etaiov_ka_2, etaiov_mtt_1, etaiov_mtt_2
#> as a work-around try putting the mu-referenced expression on a simple line
#> Warning: some etas defaulted to non-mu referenced, possible parsing error: etaiov_fdepot_1, etaiov_fdepot_2, etaiov_ka_1, etaiov_ka_2, etaiov_mtt_1, etaiov_mtt_2
#> as a work-around try putting the mu-referenced expression on a simple line
#> ℹ omega/sigma items treated as zero: 'etalclint_max', 'etaiov_fdepot_1', 'etaiov_fdepot_2', 'etaiov_ka_1', 'etaiov_ka_2', 'etaiov_mtt_1', 'etaiov_mtt_2'

stopifnot(
  max(abs(phenotypes$oral_cl / phenotypes$clint - 1)) < 1e-3,
  abs(rif_cl[["user"]] / 42.5 - 1) < 5e-3,
  abs(rif_cl[["non_user"]] / (42.5 / 1.191955) - 1) < 5e-3
)
phenotypes |>
  dplyr::select(-NAT2_SLOW, -NAT2_RAPID) |>
  dplyr::rename(
    "NAT2 phenotype" = phenotype,
    "CLint * fu (L/h)" = clint,
    "Dose / AUCtau from solve (L/h)" = oral_cl
  ) |>
knitr::kable(digits = 3)| NAT2 phenotype | CLint * fu (L/h) | Dose / AUCtau from solve (L/h) |
|---|---|---|
| Slow | 14.8 | 14.8 |
| Intermediate | 36.3 | 36.3 |
| Fast | 62.4 | 62.4 |
rif_cl
#>     user non_user
#> 42.44358 35.59930
The rifampicin tolerance is wider than the others because the 1 mg dose still saturates intrinsic clearance very slightly; the residual is a property of the model, not of the integration.
Rifampicin: saturable hepatic extraction. Exposure rises more than proportionally with dose because the liver concentration approaches Km. Over the weight-band doses (2 to 5 tablets) the steady-state AUC per mg rises monotonically:
rif_doses <- c(300, 450, 600, 750)
rif_auc <- vapply(rif_doses, function(d) {
  p <- typical_last_interval(rif, d, list(FFM = 43.4, OCC = 2, CONMED_METHAQUALONE = 0),
                             n_dose = 7)
  trap(p$time, p$Cc)
}, numeric(1))
#> ℹ parameter labels from comments will be replaced by 'label()'
#> Warning: some etas defaulted to non-mu referenced, possible parsing error: etaiov_fdepot_1, etaiov_fdepot_2, etaiov_ka_1, etaiov_ka_2, etaiov_mtt_1, etaiov_mtt_2
#> as a work-around try putting the mu-referenced expression on a simple line
#> Warning: some etas defaulted to non-mu referenced, possible parsing error: etaiov_fdepot_1, etaiov_fdepot_2, etaiov_ka_1, etaiov_ka_2, etaiov_mtt_1, etaiov_mtt_2
#> as a work-around try putting the mu-referenced expression on a simple line
#> ℹ omega/sigma items treated as zero: 'etalclint_max', 'etaiov_fdepot_1', 'etaiov_fdepot_2', 'etaiov_ka_1', 'etaiov_ka_2', 'etaiov_mtt_1', 'etaiov_mtt_2'
#> ℹ parameter labels from comments will be replaced by 'label()'
#> Warning: some etas defaulted to non-mu referenced, possible parsing error: etaiov_fdepot_1, etaiov_fdepot_2, etaiov_ka_1, etaiov_ka_2, etaiov_mtt_1, etaiov_mtt_2
#> as a work-around try putting the mu-referenced expression on a simple line
#> Warning: some etas defaulted to non-mu referenced, possible parsing error: etaiov_fdepot_1, etaiov_fdepot_2, etaiov_ka_1, etaiov_ka_2, etaiov_mtt_1, etaiov_mtt_2
#> as a work-around try putting the mu-referenced expression on a simple line
#> ℹ omega/sigma items treated as zero: 'etalclint_max', 'etaiov_fdepot_1', 'etaiov_fdepot_2', 'etaiov_ka_1', 'etaiov_ka_2', 'etaiov_mtt_1', 'etaiov_mtt_2'
#> ℹ parameter labels from comments will be replaced by 'label()'
#> Warning: some etas defaulted to non-mu referenced, possible parsing error: etaiov_fdepot_1, etaiov_fdepot_2, etaiov_ka_1, etaiov_ka_2, etaiov_mtt_1, etaiov_mtt_2
#> as a work-around try putting the mu-referenced expression on a simple line
#> Warning: some etas defaulted to non-mu referenced, possible parsing error: etaiov_fdepot_1, etaiov_fdepot_2, etaiov_ka_1, etaiov_ka_2, etaiov_mtt_1, etaiov_mtt_2
#> as a work-around try putting the mu-referenced expression on a simple line
#> ℹ omega/sigma items treated as zero: 'etalclint_max', 'etaiov_fdepot_1', 'etaiov_fdepot_2', 'etaiov_ka_1', 'etaiov_ka_2', 'etaiov_mtt_1', 'etaiov_mtt_2'
#> ℹ parameter labels from comments will be replaced by 'label()'
#> Warning: some etas defaulted to non-mu referenced, possible parsing error: etaiov_fdepot_1, etaiov_fdepot_2, etaiov_ka_1, etaiov_ka_2, etaiov_mtt_1, etaiov_mtt_2
#> as a work-around try putting the mu-referenced expression on a simple line
#> Warning: some etas defaulted to non-mu referenced, possible parsing error: etaiov_fdepot_1, etaiov_fdepot_2, etaiov_ka_1, etaiov_ka_2, etaiov_mtt_1, etaiov_mtt_2
#> as a work-around try putting the mu-referenced expression on a simple line
#> ℹ omega/sigma items treated as zero: 'etalclint_max', 'etaiov_fdepot_1', 'etaiov_fdepot_2', 'etaiov_ka_1', 'etaiov_ka_2', 'etaiov_mtt_1', 'etaiov_mtt_2'
dose_norm <- rif_auc / rif_doses
stopifnot(all(diff(dose_norm) > 0))
data.frame(dose = rif_doses, auc = rif_auc, auc_per_mg = dose_norm) |>
  dplyr::rename(
    "Daily dose (mg)" = dose,
    "AUCtau (mg*h/L)" = auc,
    "AUCtau per mg" = auc_per_mg
  ) |>
knitr::kable(digits = 3)| Daily dose (mg) | AUCtau (mg*h/L) | AUCtau per mg |
|---|---|---|
| 300 | 12.358 | 0.041 |
| 450 | 21.450 | 0.048 |
| 600 | 32.463 | 0.054 |
| 750 | 45.388 | 0.061 |
Virtual cohort
The cohort mirrors Table 1. Weight is log-normal around the 51.4 kg median with the reported interquartile range; height is drawn by sex (not reported, so typical South African adult heights are assumed); fat-free mass follows from the Janmahasatian formula the control streams use. Each participant gets the WHO weight-band number of fixed-dose combination tablets (2 tablets below 38 kg, 3 for 38-54 kg, 4 for 55-70 kg, 5 above 70 kg). Ethambutol enters the model as ethambutol base, 0.74 times the 275 mg of dihydrochloride per tablet.
Methaqualone use is drawn at the observed 28%. NAT2 phenotype is drawn with the mixture-model probabilities of 36% slow, 40% intermediate and 24% fast that the authors used for participants without a genotype. Age and serum creatinine are drawn so that the standardised Cockcroft-Gault creatinine clearance has a median close to the 127.1 mL/min centring value.
Each participant takes seven daily doses. As in the study, the dose
before the PK day (with the pre-dose sample) is occasion 1 and the
observed dose on the PK day is occasion 2; earlier doses share occasion
1. For pyrazinamide the occasion-1 doses are flagged as unobserved
(SELFADMIN = 1), which inflates their between-occasion
variability 2.49-fold.
n_subj <- 150

sex_f <- stats::rbinom(n_subj, 1, 0.30)
wt <- pmin(pmax(stats::rlnorm(n_subj, log(51.4), 0.166), 32), 90)
ht <- ifelse(sex_f == 1, stats::rnorm(n_subj, 1.58, 0.06), stats::rnorm(n_subj, 1.69, 0.07))
ffm <- ifelse(
  sex_f == 1,
  37.99 * ht^2 * wt / (35.98 * ht^2 + wt),
  42.92 * ht^2 * wt / (30.93 * ht^2 + wt)
)
n_tab <- cut(wt, c(0, 38, 55, 71, Inf), right = FALSE, labels = FALSE) + 1

cohort <- data.frame(
  id = seq_len(n_subj), FFM = ffm, n_tab = n_tab,
  CONMED_METHAQUALONE = stats::rbinom(n_subj, 1, 0.28),
  nat2 = sample(c("Slow", "Intermediate", "Fast"), n_subj, replace = TRUE,
                prob = c(0.36, 0.40, 0.24)),
  AGE = pmin(pmax(stats::rlnorm(n_subj, log(37), 0.3), 15), 75),
  CREAT = stats::rlnorm(n_subj, log(52), 0.2)
)
cohort$NAT2_SLOW <- as.numeric(cohort$nat2 == "Slow")
cohort$NAT2_RAPID <- as.numeric(cohort$nat2 == "Fast")
cohort$crcl_std <- (140 - cohort$AGE) * 52 / (72 * cohort$CREAT / 88.4)

obs_times <- c(143.99, seq(144, 168, by = 0.1))

cohort_events <- function(mg_per_tablet) {
  dose <- data.frame(
    id = rep(cohort$id, each = 7), time = rep(24 * 0:6, n_subj),
    amt = rep(mg_per_tablet * cohort$n_tab, each = 7), evid = 1, cmt = "depot"
  )
  obs <- data.frame(
    id = rep(cohort$id, each = length(obs_times)), time = rep(obs_times, n_subj),
    amt = NA_real_, evid = 0, cmt = "central"
  )
  ev <- rbind(dose, obs)
  ev <- ev[order(ev$id, ev$time, -ev$evid), ]
  ev$OCC <- ifelse(ev$time < 144, 1, 2)
  ev$SELFADMIN <- as.numeric(ev$time < 144)
  dplyr::left_join(
    ev,
    dplyr::select(cohort, id, FFM, CONMED_METHAQUALONE, NAT2_SLOW, NAT2_RAPID, AGE, CREAT),
    by = "id"
  )
}

pk_day_exposure <- function(out) {
  out <- out[out$time >= 144, ]
  out |>
    dplyr::group_by(id) |>
    dplyr::summarise(auc = trap(time, Cc), cmax = max(Cc), .groups = "drop")
}

# Between-occasion variability on mean transit time is large (up to 94%), so
# the transit input of some doses is a narrow spike, and on the days before the
# PK day no observation grid constrains the solver's step. Each cohort is
# therefore re-solved with the same random effects and a 0.005 h maximum step;
# a dose the default solve stepped over would show up as a discrepancy.
solve_drug <- function(model, mg_per_tablet, drug) {
  ev <- cohort_events(mg_per_tablet)
  fit <- rxode2::rxSolve(model, ev)
  fine <- rxode2::rxSolve(model, ev, params = as.data.frame(fit$params),
                          hmax = 0.005, maxsteps = 1e7)
  a <- pk_day_exposure(as.data.frame(fit))
  b <- pk_day_exposure(as.data.frame(fine))
  out <- as.data.frame(fit)
  out <- out[out$time >= 143.99, ]
  out$tad <- pmax(out$time - 144, 0)
  out$drug <- drug
  list(
    sim = out[, c("id", "drug", "time", "tad", "Cc", "sim")],
    step_check = max(abs(a$auc / b$auc - 1), abs(a$cmax / b$cmax - 1))
  )
}

solved <- list(
  solve_drug(rif, 150, "Rifampicin"),
  solve_drug(inh, 75, "Isoniazid"),
  solve_drug(pza, 400, "Pyrazinamide"),
  solve_drug(emb, 275 * 0.74, "Ethambutol")
)
#> ℹ parameter labels from comments will be replaced by 'label()'
#> Warning: some etas defaulted to non-mu referenced, possible parsing error: etaiov_fdepot_1, etaiov_fdepot_2, etaiov_ka_1, etaiov_ka_2, etaiov_mtt_1, etaiov_mtt_2
#> as a work-around try putting the mu-referenced expression on a simple line
#> Warning: multi-subject simulation without without 'omega'
#> ℹ parameter labels from comments will be replaced by 'label()'
#> Warning: some etas defaulted to non-mu referenced, possible parsing error: etaiov_fdepot_1, etaiov_fdepot_2, etaiov_ka_1, etaiov_ka_2, etaiov_mtt_1, etaiov_mtt_2
#> as a work-around try putting the mu-referenced expression on a simple line
#> Warning: multi-subject simulation without without 'omega'
#> ℹ parameter labels from comments will be replaced by 'label()'
#> Warning: some etas defaulted to non-mu referenced, possible parsing error: etaiov_fdepot_1, etaiov_fdepot_2, etaiov_ka_1, etaiov_ka_2, etaiov_mtt_1, etaiov_mtt_2
#> as a work-around try putting the mu-referenced expression on a simple line
#> Warning: multi-subject simulation without without 'omega'
#> ℹ parameter labels from comments will be replaced by 'label()'
#> Warning: some etas defaulted to non-mu referenced, possible parsing error: etaiov_fdepot_1, etaiov_fdepot_2, etaiov_ka_1, etaiov_ka_2, etaiov_mtt_1, etaiov_mtt_2
#> as a work-around try putting the mu-referenced expression on a simple line
#> Warning: multi-subject simulation without without 'omega'
sims <- dplyr::bind_rows(lapply(solved, `[[`, "sim"))
step_check <- vapply(solved, `[[`, numeric(1), "step_check")

stopifnot(
  # Same random effects, default step versus 0.005 h: measured agreement is
  # about 1e-5 on PK-day AUC and Cmax; a skipped transit spike would differ by
  # a whole dose.
  all(step_check < 1e-3),
  n_subj <= 200,
  !anyNA(sims$Cc),
  # Fat-free mass and creatinine clearance land near the Table 1 medians.
  abs(stats::median(cohort$FFM) / 43.1 - 1) < 0.08,
  abs(stats::median(cohort$crcl_std) / 127.1 - 1) < 0.15
)
summary(cohort[, c("FFM", "AGE", "CREAT", "crcl_std")])
#>       FFM             AGE            CREAT          crcl_std
#>  Min.   :27.40   Min.   :18.70   Min.   :31.19   Min.   : 64.8
#>  1st Qu.:37.70   1st Qu.:31.25   1st Qu.:44.86   1st Qu.:104.4
#>  Median :42.13   Median :39.16   Median :51.17   Median :122.0
#>  Mean   :41.98   Mean   :40.48   Mean   :52.36   Mean   :126.6
#>  3rd Qu.:46.75   3rd Qu.:48.90   3rd Qu.:58.61   3rd Qu.:147.4
#>  Max.   :60.84   Max.   :75.00   Max.   :93.08   Max.   :214.8
table(cohort$n_tab)
#>
#>  2  3  4  5
#>  1 99 44  6
Individual peaks still span more than tenfold within each drug: a participant whose ka draw falls in the lower tail of the 112-136% between-occasion variability absorbs slowly and peaks low, which is a property of the model and not of the solver (the step check above rules that out).
Replicating Figure 1: visual predictive check
Figure 1 of the source is a VPC of the four drugs against time after the observed dose. The percentiles below are of simulated observations including residual error; as in the control streams, simulated values at or below the LLOQ are set to half the LLOQ so the log axis stays finite.
lloq <- c(Rifampicin = 0.117, Isoniazid = 0.105, Pyrazinamide = 0.2, Ethambutol = 0.0844)

vpc <- sims |>
  dplyr::filter(tad <= 8) |>
  dplyr::mutate(
    obs = ifelse(sim <= lloq[drug], lloq[drug] / 2, sim),
    tad = round(tad, 1)
  ) |>
  dplyr::group_by(drug, tad) |>
  dplyr::summarise(
    p05 = stats::quantile(obs, 0.05),
    p50 = stats::median(obs),
    p95 = stats::quantile(obs, 0.95),
    .groups = "drop"
  ) |>
  dplyr::mutate(drug = factor(drug, levels = names(lloq)))

ggplot(vpc, aes(tad)) +
  geom_ribbon(aes(ymin = p05, ymax = p95), fill = "steelblue", alpha = 0.25) +
  geom_line(aes(y = p50), colour = "steelblue4", linewidth = 0.9) +
  facet_wrap(~drug, scales = "free_y") +
  scale_y_log10() +
  scale_x_continuous(breaks = c(0, 1.5, 3, 5, 8)) +
  labs(x = "Time after dose (h)", y = "Concentration (mg/L)") +
  theme_bw()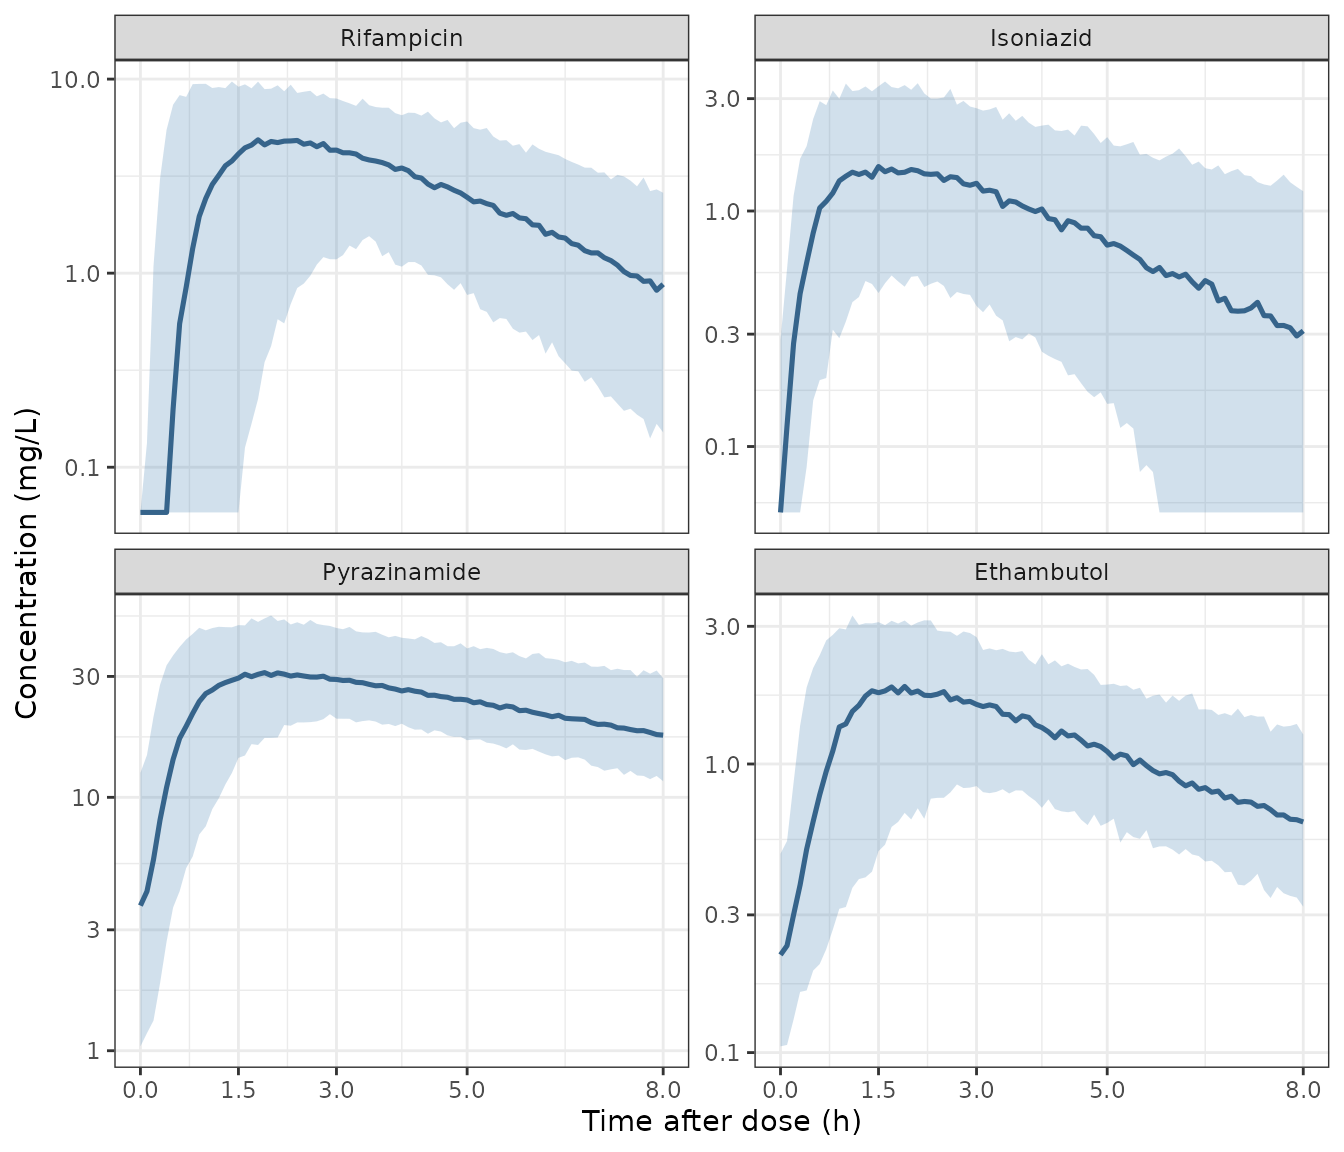
Replicates Figure 1 of Wijk 2024: 5th, 50th and 95th percentiles of simulated concentrations against time after the observed steady-state dose.
The simulated medians follow the observed medians read from Figure 1: peaks near 1.5 h of roughly 4-5 mg/L for rifampicin, 1.5 mg/L for isoniazid, 28 mg/L for pyrazinamide and 1.5 mg/L for ethambutol, with pyrazinamide and ethambutol still well above the LLOQ before the next dose.
NCA and comparison with Table 3
Table 3 of the source lists model-estimated Cmax and AUC0-24 for the
study participants (median and IQR). The simulated individual
predictions over the 24 h after the observed dose are run through
PKNCA.
nca_conc <- sims |>
  dplyr::filter(time >= 144, !is.na(Cc)) |>
  dplyr::mutate(treatment = drug) |>
  dplyr::select(id, treatment, tad, Cc)
nca_dose <- nca_conc |>
  dplyr::distinct(id, treatment) |>
  dplyr::mutate(tad = 0)

o_conc <- PKNCA::PKNCAconc(nca_conc, Cc ~ tad | treatment + id)
o_dose <- PKNCA::PKNCAdose(nca_dose, ~ tad | treatment + id)
intervals <- data.frame(start = 0, end = 24, cmax = TRUE, auclast = TRUE)
nca_res <- as.data.frame(PKNCA::pk.nca(PKNCA::PKNCAdata(o_conc, o_dose, intervals = intervals))$result) |>
  dplyr::filter(PPTESTCD %in% c("cmax", "auclast"))

stopifnot(nrow(nca_res) == 4 * n_subj * 2, !anyNA(nca_res$PPORRES))
published <- data.frame(
  treatment = c("Rifampicin", "Isoniazid", "Pyrazinamide", "Ethambutol"),
  cmax = c(5.29, 1.79, 30.0, 1.98),
  auclast = c(22.2, 7.53, 290, 13.2)
)
cmp <- nlmixr2lib::ncaComparisonTable(
  simulated = nca_res[, c("treatment", "PPTESTCD", "PPORRES")],
  reference = published,
  by = "treatment",
  params = c("cmax", "auclast"),
  tolerance_pct = 20
)
cmp |>
  dplyr::rename("Drug" = treatment) |>
knitr::kable()| NCA parameter | Drug | Reference | Simulated | % diff |
|---|---|---|---|---|
| Cmax | Rifampicin | 5.29 | 5.67 | +7.1% |
| Cmax | Isoniazid | 1.79 | 1.7 | -4.8% |
| Cmax | Pyrazinamide | 30 | 32.5 | +8.2% |
| Cmax | Ethambutol | 1.98 | 1.97 | -0.3% |
| AUClast | Rifampicin | 22.2 | 23.8 | +7.4% |
| AUClast | Isoniazid | 7.53 | 9.54 | +26.7%* |
| AUClast | Pyrazinamide | 290 | 323 | +11.3% |
| AUClast | Ethambutol | 13.2 | 14.9 | +12.9% |
Cmax and AUC0-24 agree with Table 3 for all four drugs to within cohort noise. The simulated pyrazinamide and ethambutol AUCs run about 10% above the published medians across seeds, which is within what the assumed cohort (height, creatinine, the weight-band split) can produce. The isoniazid AUC median is the least stable row: the distribution is trimodal in NAT2 phenotype, so the median depends on the drawn share of slow acetylators. The interquartile ranges show the spread is reproduced as well as the centre:
sim_iqr <- nca_res |>
  dplyr::group_by(treatment, PPTESTCD) |>
  dplyr::summarise(
    median = stats::median(PPORRES),
    q25 = stats::quantile(PPORRES, 0.25),
    q75 = stats::quantile(PPORRES, 0.75),
    .groups = "drop"
  )
pub_iqr <- data.frame(
  treatment = rep(c("Rifampicin", "Isoniazid", "Pyrazinamide", "Ethambutol"), each = 2),
  PPTESTCD = rep(c("cmax", "auclast"), 4),
  published = c(
    "5.29 (3.53-6.88)", "22.2 (15.5-31.2)",
    "1.79 (1.19-2.27)", "7.53 (4.55-14.5)",
    "30.0 (25.8-33.5)", "290 (236-358)",
    "1.98 (1.42-2.44)", "13.2 (11.1-16.5)"
  )
)
iqr_table <- dplyr::left_join(pub_iqr, sim_iqr, by = c("treatment", "PPTESTCD")) |>
  dplyr::mutate(simulated = sprintf("%.3g (%.3g-%.3g)", median, q25, q75))

# Medians of a 150-participant cohort: a mis-transcribed clearance, dose or
# unit shifts these by tens of percent or more. Over ten seeds the realised
# differences ranged from -16% to +17% for every row except isoniazid AUC,
# which ranged from -3% to +27%: isoniazid AUC is trimodal in NAT2 phenotype,
# and the cohort median sits between the intermediate and slow modes, so it
# moves with the drawn share of slow acetylators. That row gets a wider bound.
ref_long <- tidyr::pivot_longer(published, -treatment, names_to = "PPTESTCD",
                                values_to = "ref")
chk <- dplyr::inner_join(sim_iqr, ref_long, by = c("treatment", "PPTESTCD"))
chk$pct_diff <- 100 * (chk$median / chk$ref - 1)
inh_auc <- chk$treatment == "Isoniazid" & chk$PPTESTCD == "auclast"
stopifnot(
  nrow(chk) == 8,
  all(abs(chk$pct_diff[!inh_auc]) < 25),
  abs(chk$pct_diff[inh_auc]) < 40
)

iqr_table |>
  dplyr::select(treatment, PPTESTCD, published, simulated) |>
  dplyr::mutate(PPTESTCD = ifelse(PPTESTCD == "cmax", "Cmax (mg/L)", "AUC0-24 (mg*h/L)")) |>
  dplyr::rename(
    "Drug" = treatment,
    "NCA parameter" = PPTESTCD,
    "Table 3 median (IQR)" = published,
    "Simulated median (IQR)" = simulated
  ) |>
knitr::kable()| Drug | NCA parameter | Table 3 median (IQR) | Simulated median (IQR) |
|---|---|---|---|
| Rifampicin | Cmax (mg/L) | 5.29 (3.53-6.88) | 5.67 (4.15-7.48) |
| Rifampicin | AUC0-24 (mg*h/L) | 22.2 (15.5-31.2) | 23.8 (17.4-33.5) |
| Isoniazid | Cmax (mg/L) | 1.79 (1.19-2.27) | 1.7 (1.27-2.22) |
| Isoniazid | AUC0-24 (mg*h/L) | 7.53 (4.55-14.5) | 9.54 (5.39-14.9) |
| Pyrazinamide | Cmax (mg/L) | 30.0 (25.8-33.5) | 32.5 (26-37.7) |
| Pyrazinamide | AUC0-24 (mg*h/L) | 290 (236-358) | 323 (269-406) |
| Ethambutol | Cmax (mg/L) | 1.98 (1.42-2.44) | 1.97 (1.67-2.54) |
| Ethambutol | AUC0-24 (mg*h/L) | 13.2 (11.1-16.5) | 14.9 (12.1-18.4) |
Covariate effects
The retained covariates can be read off typical-value profiles. Methaqualone users have the typical bioavailability of 1 and non-users 19.2% more, which for a 450 mg rifampicin dose translates into a larger AUC ratio because hepatic extraction saturates. Isoniazid exposure is ordered by NAT2 phenotype, and ethambutol clearance changes by 2.6% for every 10 mL/min of standardised creatinine clearance.
rif_auc_meth <- vapply(c(0, 1), function(m) {
  p <- typical_last_interval(rif, 450, list(FFM = 43.4, OCC = 2, CONMED_METHAQUALONE = m),
                             n_dose = 7)
  trap(p$time, p$Cc)
}, numeric(1))
#> ℹ parameter labels from comments will be replaced by 'label()'
#> Warning: some etas defaulted to non-mu referenced, possible parsing error: etaiov_fdepot_1, etaiov_fdepot_2, etaiov_ka_1, etaiov_ka_2, etaiov_mtt_1, etaiov_mtt_2
#> as a work-around try putting the mu-referenced expression on a simple line
#> Warning: some etas defaulted to non-mu referenced, possible parsing error: etaiov_fdepot_1, etaiov_fdepot_2, etaiov_ka_1, etaiov_ka_2, etaiov_mtt_1, etaiov_mtt_2
#> as a work-around try putting the mu-referenced expression on a simple line
#> ℹ omega/sigma items treated as zero: 'etalclint_max', 'etaiov_fdepot_1', 'etaiov_fdepot_2', 'etaiov_ka_1', 'etaiov_ka_2', 'etaiov_mtt_1', 'etaiov_mtt_2'
#> ℹ parameter labels from comments will be replaced by 'label()'
#> Warning: some etas defaulted to non-mu referenced, possible parsing error: etaiov_fdepot_1, etaiov_fdepot_2, etaiov_ka_1, etaiov_ka_2, etaiov_mtt_1, etaiov_mtt_2
#> as a work-around try putting the mu-referenced expression on a simple line
#> Warning: some etas defaulted to non-mu referenced, possible parsing error: etaiov_fdepot_1, etaiov_fdepot_2, etaiov_ka_1, etaiov_ka_2, etaiov_mtt_1, etaiov_mtt_2
#> as a work-around try putting the mu-referenced expression on a simple line
#> ℹ omega/sigma items treated as zero: 'etalclint_max', 'etaiov_fdepot_1', 'etaiov_fdepot_2', 'etaiov_ka_1', 'etaiov_ka_2', 'etaiov_mtt_1', 'etaiov_mtt_2'

emb_cl_ratio <- vapply(c(97.1, 157.1), function(crcl) {
  creat <- (140 - 37) * 52 * 88.4 / (72 * crcl)
  p <- typical_last_interval(emb, 3 * 275 * 0.74,
                             list(FFM = 43.4, OCC = 2, AGE = 37, CREAT = creat))
  (3 * 275 * 0.74) / trap(p$time, p$Cc) / 48.8
}, numeric(1))
#> ℹ parameter labels from comments will be replaced by 'label()'
#> Warning: some etas defaulted to non-mu referenced, possible parsing error: etaiov_fdepot_1, etaiov_fdepot_2, etaiov_ka_1, etaiov_ka_2, etaiov_mtt_1, etaiov_mtt_2
#> as a work-around try putting the mu-referenced expression on a simple line
#> Warning: some etas defaulted to non-mu referenced, possible parsing error: etaiov_fdepot_1, etaiov_fdepot_2, etaiov_ka_1, etaiov_ka_2, etaiov_mtt_1, etaiov_mtt_2
#> as a work-around try putting the mu-referenced expression on a simple line
#> ℹ omega/sigma items treated as zero: 'etalcl', 'etaiov_fdepot_1', 'etaiov_fdepot_2', 'etaiov_ka_1', 'etaiov_ka_2', 'etaiov_mtt_1', 'etaiov_mtt_2'
#> ℹ parameter labels from comments will be replaced by 'label()'
#> Warning: some etas defaulted to non-mu referenced, possible parsing error: etaiov_fdepot_1, etaiov_fdepot_2, etaiov_ka_1, etaiov_ka_2, etaiov_mtt_1, etaiov_mtt_2
#> as a work-around try putting the mu-referenced expression on a simple line
#> Warning: some etas defaulted to non-mu referenced, possible parsing error: etaiov_fdepot_1, etaiov_fdepot_2, etaiov_ka_1, etaiov_ka_2, etaiov_mtt_1, etaiov_mtt_2
#> as a work-around try putting the mu-referenced expression on a simple line
#> ℹ omega/sigma items treated as zero: 'etalcl', 'etaiov_fdepot_1', 'etaiov_fdepot_2', 'etaiov_ka_1', 'etaiov_ka_2', 'etaiov_mtt_1', 'etaiov_mtt_2'

stopifnot(
  # Saturable extraction amplifies the 19.2% bioavailability difference.
  rif_auc_meth[1] / rif_auc_meth[2] > 1.192,
  # 1 +/- 0.00263624 * 30 mL/min.
  max(abs(emb_cl_ratio - c(1 - 0.0790872, 1 + 0.0790872))) < 1e-3
)
data.frame(
  effect = c(
    "Rifampicin AUC, no methaqualone / methaqualone (450 mg)",
    "Ethambutol CL at CrCl 97.1 / reference",
    "Ethambutol CL at CrCl 157.1 / reference"
  ),
  ratio = c(rif_auc_meth[1] / rif_auc_meth[2], emb_cl_ratio)
) |>
  dplyr::rename("Effect" = effect, "Ratio" = ratio) |>
knitr::kable(digits = 3)| Effect | Ratio |
|---|---|
| Rifampicin AUC, no methaqualone / methaqualone (450 mg) | 1.276 |
| Ethambutol CL at CrCl 97.1 / reference | 0.921 |
| Ethambutol CL at CrCl 157.1 / reference | 1.079 |
Assumptions and deviations
Control streams for structure, Table 2 for values.
The final NONMEM control streams in the supplement and Table 2 agree for
isoniazid, pyrazinamide and ethambutol to the printed digits; for
rifampicin the control-stream $THETA values sit up to 0.3%
from Table 2 (CLint,max * fu 42.4 vs 42.5 L/h, V 55.0 vs 55.1 L), and
Table 2 is used. The variances are the control-stream
$OMEGA values; the square root of each reproduces the Table
2 percentage, which is therefore an omega standard deviation on the log
scale, not a coefficient of variation.
Number of transit compartments. The transit input in every control stream is the Savic density with KTR = (NN + 1) / MTT. For isoniazid, pyrazinamide and ethambutol, Table 2 prints NN + 1 (1, 3.73 and 3.01) while the control streams carry NN = 0, 2.73 and 2.01, the latter two in blocks whose other values all match Table 2. For rifampicin both say 17. The control-stream values are what the estimates were obtained with, so they are used.
Methaqualone is parameterised as the source wrote
it. The rifampicin control stream takes methaqualone-positive
participants as the reference (BIO_METHAQUALONE = 1) and
gives non-users 1 + 0.191955. The Results describe this as
19% lower bioavailability with methaqualone use; strictly, users have 1
/ 1.192 = 0.84 of the non-user bioavailability. The typical values in
Table 2 therefore describe a methaqualone user. The coefficient is not
listed in Table 2 and is taken from the control stream.
Alcohol is not in the ethambutol model. The Abstract
and Results report 13% higher ethambutol clearance with high alcohol use
(P = 0.002). The final control stream has no alcohol term, Table 2 has
no alcohol row, and the P-value does not meet the P < 0.001
backward-elimination criterion of the Methods, so the effect is
documented in covariatesDataExcluded rather than included.
Adding it would raise ethambutol clearance by 13% in high-use
participants.
Fat-free mass reference of 43.4 kg. All four control
streams normalise allometry to TVFFM = 43.4; Table 2
footnote b names 43.1 kg, the Table 1 median. The control-stream value
is used. The rifampicin control stream as printed omits
WHSMAX = 37.99 in its female branch of the Janmahasatian
formula, which the other three include; the models take fat-free mass as
a covariate, so users should compute it with the full formula.
Hepatic blood flow. Table 2 prints QH as 73.9 L/h for rifampicin and 973.9 L/h for isoniazid. Footnote d states the hepatic parameters are 90 L/h and 1 L for a 56.1 kg fat-free mass, and 90 x (43.1 / 56.1)^0.75 = 73.9, so the isoniazid entry has a stray leading digit. Both control streams use 90 L/h scaled from 56.1 kg.
Unbound fraction. Both hepatic models report and estimate the product CLint * fu (Table 2 footnote c). The control streams define fu (0.2 for rifampicin, 0.95 for isoniazid) but never use it, so the models carry the product directly and no separate fu parameter.
Ethambutol creatinine clearance. The control stream
computes Cockcroft-Gault clearance without the female factor and
standardises it to 52 kg (GFR_STD = GFR*52/WT), so body
weight cancels and the covariate depends on age and serum creatinine
only. The control-stream $INPUT does not list an age column
although the equation uses one; age is taken to be a data column. Serum
creatinine is not reported, so the cohort’s distribution is assumed and
chosen to put the standardised clearance near the 127.1 mL/min centring
value.
Additive residual error. Each control stream writes
the additive standard deviation as THETA + 0.2 * LLOQ. The
theta is held at 0 for rifampicin, isoniazid and ethambutol (0.0234,
0.021 and 0.0169 mg/L, printed as 0.02 in Table 2) and estimated at
0.589 mg/L for pyrazinamide, giving 0.63 mg/L. The M6 handling of BLQ
data (an extra 50% of the LLOQ on imputed records) is an estimation
device and is not reproduced.
Between-occasion variability. Each control stream
has two occasions with one shared variance ($OMEGA BLOCK(1)
then SAME); they are written as two etas, the second fixed
to the first’s value, selected by OCC. Because the occasion
effect enters through indicator products rather than as a bare term
added to the log parameter, rxode2 warns that these etas are not
mu-referenced; this affects only the speed of a future estimation run,
not simulation. Between-subject variability exists only on clearance;
the zero-variance etas in the control streams are omitted.
NAT2 mixture model. Genotype was known for 33% of
participants, and the authors assigned a phenotype to the rest with a
mixture model whose probabilities were held at 36% / 40% / 24% (slow /
intermediate / fast). That is a device for missing data, so phenotype
enters as the covariate pair NAT2_SLOW /
NAT2_RAPID, and the virtual cohort above draws it with the
mixture probabilities.
Absorption is written out rather than delegated to
transit(). The control streams set
F1 = 0 so the whole dose enters through the transit
density. In rxode2 the built-in transit() returns zero
input once f(depot) is 0, so the closed form is written out
with podo() and tad(). Like the control
streams, it restarts with each dose, which loses nothing here because
every mean transit time is under an hour against a 24 h dosing interval;
the mass-balance checks above confirm it.
Cohort. Height, the split of weight within sex, age and serum creatinine distributions are not reported and are assumed as described above. Race and ethnicity are not reported beyond the South African study site.