Ampicillin + sulbactam in CAP (Soto 2014)
Source:vignettes/articles/Soto_2014_ampicillin_sulbactam.Rmd
Soto_2014_ampicillin_sulbactam.RmdModel and source
Soto et al. 2014 developed a joint two-compartment population PK
model for the fixed 2:1 ampicillin/sulbactam combination in 47 Japanese
adults with moderate or severe community-acquired pneumonia (CAP). Both
drugs were fitted simultaneously via the NONMEM L2 data item; the final
model shares a single power effect of Cockcroft-Gault creatinine
clearance (CLcr) on CL of both drugs, a fixed linear (exponent = 1)
allometric scaling of body weight on peripheral volume V2 of both drugs,
and a correlated CL random effect across drugs (rho = 0.858). The
packaged model uses ampicillin as the unsuffixed parent (canonical
compartments central / peripheral1, parameters
lcl, lvc, lq, lvp,
residual propSd) and sulbactam as the _sbt
sibling-drug suffix (central_sbt /
peripheral1_sbt, lcl_sbt,
lvc_sbt, lq_sbt, lvp_sbt,
propSd_sbt).
- Citation: Soto E, Shoji S, Muto C, Tomono Y, Marshall S. Population pharmacokinetics of ampicillin and sulbactam in patients with community-acquired pneumonia: evaluation of the impact of renal impairment. Br J Clin Pharmacol. 2014;77(3):509-521. doi:10.1111/bcp.12232.
- Article: https://doi.org/10.1111/bcp.12232
Population
Forty-seven Japanese patients (26 male, 21 female) with moderate or severe CAP requiring in-hospital antimicrobial treatment were enrolled in ClinicalTrials.gov NCT01189487 (Soto 2014 Table 1). Median (range) baseline demographics: age 67 (28-85) years; body weight 51.2 (31.3-78.7) kg; body mass index 20.4 (13.7-29.0) kg/m^2; CLcr 71 (34.6-176) mL/min; serum creatinine 0.73 (0.38-1.40) mg/dL. Patients with severe renal impairment (CLcr < 30 mL/min) were excluded by protocol; the cohort spanned 36% with normal renal function (CLcr >= 90 mL/min), 21% with mild and 43% with moderate impairment. Elderly patients (>= 65 years) accounted for 57% of the cohort; 30% had baseline weight <= 45 kg.
Patients received 30-minute intravenous infusions of 3 g ampicillin/sulbactam (2:1; 2 g ampicillin + 1 g sulbactam combined to 3 g total per dose) every 6 hours for 3 to 14 days depending on clinical condition. A median of 4 to 5 plasma samples per subject (total 444 samples; 222 per drug) was retained for the joint population PK fit.
The same metadata is available programmatically via
readModelDb("Soto_2014_ampicillin_sulbactam")()$population.
Source trace
The per-parameter origin is recorded inline next to each
ini() entry in
inst/modeldb/specificDrugs/Soto_2014_ampicillin_sulbactam.R.
The table below collects them in one place for review. All values come
from Soto 2014 Table 2, “Combined final model” column.
| Equation / parameter | Value | Source location |
|---|---|---|
lcl (ampicillin CL at CLcr = 71 mL/min) |
log(10.7) L/h |
Table 2 ampicillin row CL(1) = 10.7 (RSE 3.39%) |
lvc (ampicillin central volume V1) |
log(9.97) L |
Table 2 ampicillin row V1(1) = 9.97 (RSE 6.07%) |
lq (ampicillin intercompartmental clearance Q) |
log(4.14) L/h |
Table 2 ampicillin row Q(1) = 4.14 (RSE 21.8%) |
lvp (ampicillin peripheral volume V2 at WT = 51.2
kg) |
log(4.48) L |
Table 2 ampicillin row V2(1) = 4.48 (RSE 9.91%) |
lcl_sbt (sulbactam CL at CLcr = 71 mL/min) |
log(10.4) L/h |
Table 2 sulbactam row CL(2) = 10.4 (RSE 3.40%) |
lvc_sbt (sulbactam central volume V1) |
log(10.2) L |
Table 2 sulbactam row V1(2) = 10.2 (RSE 7.04%) |
lq_sbt (sulbactam intercompartmental clearance Q) |
log(4.58) L/h |
Table 2 sulbactam row Q(2) = 4.58 (RSE 28.2%) |
lvp_sbt (sulbactam peripheral volume V2 at WT = 51.2
kg) |
log(4.04) L |
Table 2 sulbactam row V2(2) = 4.04 (RSE 12.1%) |
e_crcl_cl (shared CLcr power exponent on CL for both
drugs) |
0.701 |
Table 2 theta CLcr on CL (RSE 7.65%); shared in combined final model |
e_wt_vp (WT linear allometric exponent on V2 for both
drugs, FIXED) |
fixed(1.0) |
Table 2 theta BWT on V2 = 1.00 Fix; combined final model |
etalcl + etalcl_sbt block (variances and
rho = 0.858) |
c(log(1+0.148^2), 0.858*sqrt(...), log(1+0.152^2)) |
Table 2 CV[eta_CL] 14.8% / 15.2%; rho = 0.858 (RSE 34.8%) |
etalvp (ampicillin V2 IIV) |
log(1 + 0.152^2) |
Table 2 CV[eta_V2,i(1)] = 15.2% (RSE 36.2%); no cross-drug correlation |
etalvp_sbt (sulbactam V2 IIV) |
log(1 + 0.148^2) |
Table 2 CV[eta_V2,i(2)] = 14.8% (RSE 28.3%); no cross-drug correlation |
propSd (ampicillin LTBS proportional SD) |
0.242 |
Table 2 CV[eps_ij(1)] = 24.2% (RSE 13.5%) |
propSd_sbt (sulbactam LTBS proportional SD) |
0.233 |
Table 2 CV[eps_ij(2)] = 23.3% (RSE 14.4%) |
d/dt(central), d/dt(peripheral1)
(ampicillin) |
2-compartment IV | Methods, Population pharmacokinetic analysis paragraph |
d/dt(central_sbt), d/dt(peripheral1_sbt)
(sulbactam) |
2-compartment IV | Methods, Population pharmacokinetic analysis paragraph |
Final-model CL covariate equation
CL_i(k) = theta_CL(k) * (CLcr/71)^theta_CLcr * exp(eta_CL_i(k))
|
n/a | Results, Pharmacokinetic analyses paragraph 4; final-model equation block |
Final-model V2 covariate equation
V2_i(k) = theta_V2(k) * (BWT/51.2) * exp(eta_V2_i(k))
|
n/a | Results, Pharmacokinetic analyses paragraph 4 (allometric scaling) |
Virtual cohort
Original observed concentrations are not publicly available. Soto 2014 Table 4 reports the predicted Cmax, AUC(0,48h), and t1/2 ranges for a typical 51-kg subject across four renal-function categories with their recommended dosing intervals (q6h for CLcr 60-90 and 30 to <60 mL/min; additionally q8h for the 30 to <60 category; q12h for 15 to <30; q24h for 5 to <15). The virtual cohort below mirrors this design: one typical subject at each endpoint (minimum and maximum CLcr) of each renal-function band, dosed per the corresponding regimen for 48 hours.
set.seed(2026)

T_INF      <- 0.5   # hour; 30-min IV infusion
WT_REF     <- 51.2  # kg; population median (Soto 2014 Table 1) and Table 4 reference body weight (51 kg, rounded)
SIM_WINDOW <- 48    # hour; AUC(0,48h) window from Soto 2014 Table 4
AMP_MG     <- 2000  # mg ampicillin per 3 g dose (2 g ampicillin + 1 g sulbactam combined to 3 g total)
SBT_MG     <- 1000  # mg sulbactam  per 3 g dose

# Soto 2014 Table 4 design: rows of (CLcr endpoint x dosing interval).
# Within each renal-function band we include both the minimum and the
# maximum CLcr so Table 4's "predicted range" is reproduced as a pair of
# typical-value trajectories. The Soto 2014 q24h regimen for 5 to <15
# mL/min has a 24-hour interval which yields two doses across the 48-h
# window; all other regimens yield more doses.
cohort <- tibble::tribble(
  ~regimen,                ~CRCL, ~tau_h,
  "CRCL 60-90 (q6h)",       60,   6,
  "CRCL 60-90 (q6h)",       90,   6,
  "CRCL 30 to <60 (q6h)",   30,   6,
  "CRCL 30 to <60 (q6h)",   59.999, 6,
  "CRCL 30 to <60 (q8h)",   30,   8,
  "CRCL 30 to <60 (q8h)",   59.999, 8,
  "CRCL 15 to <30 (q12h)",  15,   12,
  "CRCL 15 to <30 (q12h)",  29.999, 12,
  "CRCL 5 to <15 (q24h)",   5,    24,
  "CRCL 5 to <15 (q24h)",   14.999, 24
) |>
  dplyr::mutate(id = dplyr::row_number())

make_subject <- function(row) {
  n_doses    <- as.integer(floor(SIM_WINDOW / row$tau_h))
  dose_times <- seq(0, by = row$tau_h, length.out = n_doses)
  obs_times  <- sort(unique(c(0, seq(0.05, SIM_WINDOW, by = 0.25))))

  # Ampicillin dosing rows: 30-min IV infusion every tau_h hours into `central`.
  dose_amp <- data.frame(
    id   = row$id, time = dose_times,
    cmt  = "central", amt = AMP_MG, rate = AMP_MG / T_INF, evid = 1L
  )
  # Sulbactam dosing rows: 30-min IV infusion every tau_h hours into `central_sbt`.
  dose_sbt <- data.frame(
    id   = row$id, time = dose_times,
    cmt  = "central_sbt", amt = SBT_MG, rate = SBT_MG / T_INF, evid = 1L
  )
  # Observation rows: explicit per-output (Cc for ampicillin, Cc_sbt for
  # sulbactam) so the multi-output simulation knows which algebraic
  # observable to emit at each time -- same pattern as the deKock 2017
  # vignette's two-drug event table.
  obs_amp <- data.frame(
    id   = row$id, time = obs_times,
    cmt  = "Cc",     amt = 0, rate = 0, evid = 0L
  )
  obs_sbt <- data.frame(
    id   = row$id, time = obs_times,
    cmt  = "Cc_sbt", amt = 0, rate = 0, evid = 0L
  )
  df <- dplyr::bind_rows(dose_amp, dose_sbt, obs_amp, obs_sbt) |>
    dplyr::arrange(id, time, evid)
  df$regimen <- row$regimen
  df$WT      <- WT_REF
  df$CRCL    <- row$CRCL
  df
}

events <- dplyr::bind_rows(lapply(seq_len(nrow(cohort)), function(i) {
  make_subject(cohort[i, ])
}))
Simulation
Soto 2014 Table 4 reports typical-value (not VPC) ranges for a 51-kg
subject, so the simulation here zeros out the random effects with
rxode2::zeroRe().
mod          <- readModelDb("Soto_2014_ampicillin_sulbactam")
mod_typical  <- rxode2::zeroRe(mod)
sim <- rxode2::rxSolve(mod_typical, events = events,
                       keep = c("regimen", "WT", "CRCL"))
#> ℹ omega/sigma items treated as zero: 'etalcl', 'etalcl_sbt', 'etalvp', 'etalvp_sbt'
#> Warning: multi-subject simulation without without 'omega'
sim <- as.data.frame(sim)
Replicate published figures
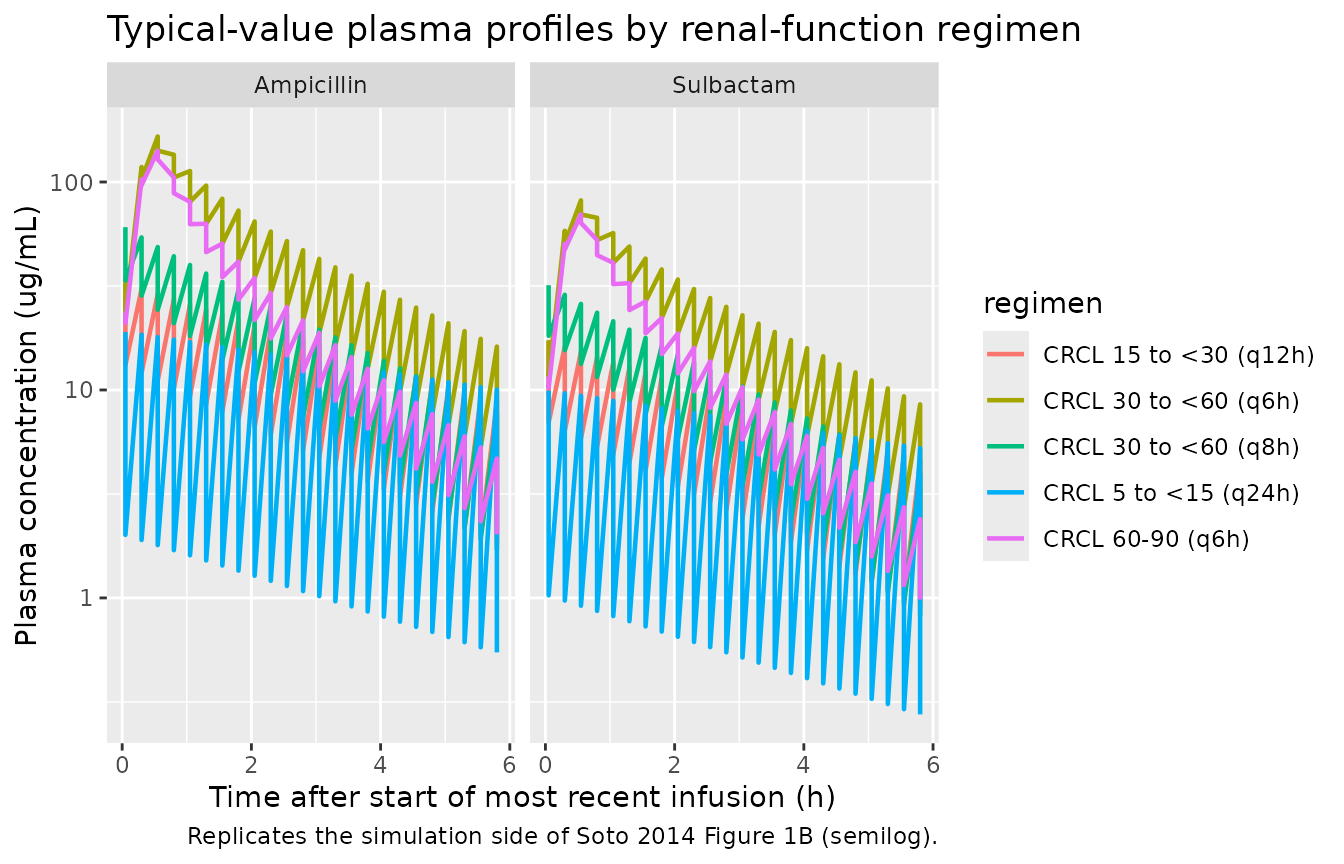
Soto 2014 Figures 1 and 3 are observed-vs-predicted scatter / VPC panels that require original individual-level concentrations to reproduce. Figures 4 and 5 are simulation outputs derived from the final model; the panel below reproduces the simulation side of Figure 1 (typical concentration vs time after the last dose, semilog scale) using the typical-value trajectories of the virtual cohort.
# Replicates the simulation side of Soto 2014 Figure 1B (semilog plasma
# concentration vs time) for the typical 51-kg subject at the median CLcr
# of each renal-function band, restricted to the final 6-hour interval so
# the post-dose decline is visible on the same axis as in the published
# panel.
plot_window <- sim |>
  dplyr::filter(time >= (SIM_WINDOW - 6), time <= SIM_WINDOW) |>
  dplyr::mutate(time_after_last_dose = time - (SIM_WINDOW - 6))

plot_long <- plot_window |>
  dplyr::select(regimen, time_after_last_dose, Cc, Cc_sbt) |>
  tidyr::pivot_longer(c(Cc, Cc_sbt), names_to = "drug", values_to = "conc") |>
  dplyr::mutate(drug = ifelse(drug == "Cc", "Ampicillin", "Sulbactam"))

ggplot(plot_long,
       aes(time_after_last_dose, conc, colour = regimen)) +
  geom_line(linewidth = 0.8) +
  facet_wrap(~ drug) +
  scale_y_log10() +
  labs(
    x = "Time after start of most recent infusion (h)",
    y = "Plasma concentration (ug/mL)",
    title = "Typical-value plasma profiles by renal-function regimen",
    caption = "Replicates the simulation side of Soto 2014 Figure 1B (semilog)."
  )
PKNCA validation
PKNCA is used to compute Cmax, AUC(0,48h), and the terminal half-life at the typical-value level for each subject (CLcr endpoint x dosing regimen). The AUC0-48 window is the AUC(0,48h) metric the source paper reports in Table 4.
Time-zero records
Pre-dose Cc = 0 rows are added so PKNCA can anchor AUC0-* at t = 0;
this matches the pknca-recipes.md time-zero guidance.
add_time_zero <- function(df, conc_col) {
  zero_rows <- df |>
    dplyr::distinct(id, regimen) |>
    dplyr::mutate(time = 0, !!conc_col := 0)
  bound <- dplyr::bind_rows(
    df |> dplyr::select(id, regimen, time, dplyr::all_of(conc_col)),
    zero_rows
  )
  bound |>
    dplyr::distinct(id, regimen, time, .keep_all = TRUE) |>
    dplyr::arrange(id, regimen, time)
}

sim_amp <- sim |> dplyr::filter(!is.na(Cc)) |> add_time_zero("Cc")
sim_sbt <- sim |> dplyr::filter(!is.na(Cc_sbt)) |>
  add_time_zero("Cc_sbt") |>
  dplyr::rename(Cc = Cc_sbt)

dose_amp <- events |>
  dplyr::filter(!is.na(amt), amt == AMP_MG) |>
  dplyr::distinct(id, time, amt) |>
  dplyr::left_join(cohort |> dplyr::select(id, regimen), by = "id")
dose_sbt <- events |>
  dplyr::filter(!is.na(amt), amt == SBT_MG) |>
  dplyr::distinct(id, time, amt) |>
  dplyr::left_join(cohort |> dplyr::select(id, regimen), by = "id")
Ampicillin AUC(0,48h), Cmax, half-life
conc_obj_amp <- PKNCA::PKNCAconc(sim_amp, Cc ~ time | regimen + id,
                                 concu = "ug/mL", timeu = "h")
dose_obj_amp <- PKNCA::PKNCAdose(dose_amp, amt ~ time | regimen + id,
                                 doseu = "mg")

intervals <- data.frame(
  start      = 0,
  end        = SIM_WINDOW,
  cmax       = TRUE,
  tmax       = TRUE,
  auclast    = TRUE,
  half.life  = TRUE
)

nca_amp <- PKNCA::pk.nca(PKNCA::PKNCAdata(conc_obj_amp, dose_obj_amp,
intervals = intervals))Comparison against Soto 2014 Table 4
Soto 2014 Table 4 reports the predicted Cmax, AUC(0,48h), and t1/2 ranges for a 51-kg typical subject at the minimum and maximum CLcr of each renal-function band. The comparison below pairs the simulated AUC(0,48h) and t1/2 against the published range; the simulated value should sit within the published [low, high] interval for each regimen.
summarise_per_regimen <- function(nca_res, label) {
  res_tbl <- as.data.frame(nca_res$result)
  res_tbl |>
    dplyr::filter(PPTESTCD %in% c("cmax", "auclast", "half.life")) |>
    dplyr::group_by(regimen, PPTESTCD) |>
    dplyr::summarise(
      sim_min = round(min(PPORRES, na.rm = TRUE), 2),
      sim_max = round(max(PPORRES, na.rm = TRUE), 2),
      .groups = "drop"
    ) |>
    dplyr::mutate(drug = label)
}

sim_summary <- dplyr::bind_rows(
  summarise_per_regimen(nca_amp, "Ampicillin"),
  summarise_per_regimen(nca_sbt, "Sulbactam")
)

# Soto 2014 Table 4 values (Cmax, AUC(0,48h), t1/2 ranges).
published <- tibble::tribble(
  ~drug,        ~regimen,                ~PPTESTCD,   ~pub_low, ~pub_high,
  "Ampicillin", "CRCL 60-90 (q6h)",       "cmax",       139,      151,
  "Ampicillin", "CRCL 60-90 (q6h)",       "auclast",   1260,     1670,
  "Ampicillin", "CRCL 60-90 (q6h)",       "half.life", 1.20,     1.42,
  "Ampicillin", "CRCL 30 to <60 (q6h)",   "cmax",       151,      173,
  "Ampicillin", "CRCL 30 to <60 (q6h)",   "auclast",   1690,     2690,
  "Ampicillin", "CRCL 30 to <60 (q6h)",   "half.life", 1.43,     2.02,
  "Ampicillin", "CRCL 30 to <60 (q8h)",   "cmax",       149,      166,
  "Ampicillin", "CRCL 30 to <60 (q8h)",   "auclast",   1270,     2030,
  "Ampicillin", "CRCL 30 to <60 (q8h)",   "half.life", 1.43,     2.02,
  "Ampicillin", "CRCL 15 to <30 (q12h)",  "cmax",       162,      176,
  "Ampicillin", "CRCL 15 to <30 (q12h)",  "auclast",   1400,     2190,
  "Ampicillin", "CRCL 15 to <30 (q12h)",  "half.life", 2.06,     3.06,
  "Ampicillin", "CRCL 5 to <15 (q24h)",   "cmax",       170,      185,
  "Ampicillin", "CRCL 5 to <15 (q24h)",   "auclast",   1160,     2310,
  "Ampicillin", "CRCL 5 to <15 (q24h)",   "half.life", 3.20,     6.27,
  "Sulbactam",  "CRCL 60-90 (q6h)",       "cmax",       68.6,     74.2,
  "Sulbactam",  "CRCL 60-90 (q6h)",       "auclast",    650,      861,
  "Sulbactam",  "CRCL 60-90 (q6h)",       "half.life", 1.09,     1.33,
  "Sulbactam",  "CRCL 30 to <60 (q6h)",   "cmax",       74.4,     85.1,
  "Sulbactam",  "CRCL 30 to <60 (q6h)",   "auclast",    872,     1380,
  "Sulbactam",  "CRCL 30 to <60 (q6h)",   "half.life", 1.34,     1.96,
  "Sulbactam",  "CRCL 30 to <60 (q8h)",   "cmax",       73.3,     81.5,
  "Sulbactam",  "CRCL 30 to <60 (q8h)",   "auclast",    655,     1050,
  "Sulbactam",  "CRCL 30 to <60 (q8h)",   "half.life", 1.34,     1.96,
  "Sulbactam",  "CRCL 15 to <30 (q12h)",  "cmax",       79.5,     86.4,
  "Sulbactam",  "CRCL 15 to <30 (q12h)",  "auclast",    718,     1120,
  "Sulbactam",  "CRCL 15 to <30 (q12h)",  "half.life", 2.00,     3.03,
  "Sulbactam",  "CRCL 5 to <15 (q24h)",   "cmax",       83.1,     90.7,
  "Sulbactam",  "CRCL 5 to <15 (q24h)",   "auclast",    599,     1190,
  "Sulbactam",  "CRCL 5 to <15 (q24h)",   "half.life", 3.16,     6.28
)

friendly_label <- function(code) {
  dplyr::recode(code,
                cmax       = "Cmax (ug/mL)",
                auclast    = "AUC(0,48h) (ug/mL*h)",
                half.life  = "t1/2 (h)")
}

comparison <- dplyr::left_join(published, sim_summary,
                               by = c("drug", "regimen", "PPTESTCD")) |>
  dplyr::mutate(
    pub_range    = sprintf("%g - %g", pub_low, pub_high),
    sim_range    = sprintf("%g - %g", sim_min, sim_max),
    in_pub_range = (sim_min >= pub_low * 0.9) & (sim_max <= pub_high * 1.1),
    metric       = friendly_label(PPTESTCD)
  ) |>
  dplyr::select(drug, regimen, metric, pub_range, sim_range, in_pub_range)

knitr::kable(
  comparison,
  caption = paste(
    "Simulated typical-value PK at the CLcr endpoints of each renal-function",
    "band vs Soto 2014 Table 4 published ranges.",
    "in_pub_range = TRUE when the simulated range falls within +/-10% of the",
    "published [low, high] interval."
  ),
  align = c("l", "l", "l", "r", "r", "r")
)| drug | regimen | metric | pub_range | sim_range | in_pub_range |
|---|---|---|---|---|---|
| Ampicillin | CRCL 60-90 (q6h) | Cmax (ug/mL) | 139 - 151 | 128.42 - 141.51 | TRUE |
| Ampicillin | CRCL 60-90 (q6h) | AUC(0,48h) (ug/mL*h) | 1260 - 1670 | 1254.47 - 1665.8 | TRUE |
| Ampicillin | CRCL 60-90 (q6h) | t1/2 (h) | 1.2 - 1.42 | 1.18 - 1.39 | TRUE |
| Ampicillin | CRCL 30 to <60 (q6h) | Cmax (ug/mL) | 151 - 173 | 141.51 - 165.46 | TRUE |
| Ampicillin | CRCL 30 to <60 (q6h) | AUC(0,48h) (ug/mL*h) | 1690 - 2690 | 1665.82 - 2682.54 | TRUE |
| Ampicillin | CRCL 30 to <60 (q6h) | t1/2 (h) | 1.43 - 2.02 | 1.39 - 1.98 | TRUE |
| Ampicillin | CRCL 30 to <60 (q8h) | Cmax (ug/mL) | 149 - 166 | 139.45 - 158.83 | TRUE |
| Ampicillin | CRCL 30 to <60 (q8h) | AUC(0,48h) (ug/mL*h) | 1270 - 2030 | 1252.55 - 2024.59 | TRUE |
| Ampicillin | CRCL 30 to <60 (q8h) | t1/2 (h) | 1.43 - 2.02 | 1.4 - 2 | TRUE |
| Ampicillin | CRCL 15 to <30 (q12h) | Cmax (ug/mL) | 162 - 176 | 154.38 - 170.43 | TRUE |
| Ampicillin | CRCL 15 to <30 (q12h) | AUC(0,48h) (ug/mL*h) | 1400 - 2190 | 1358.5 - 2181.14 | TRUE |
| Ampicillin | CRCL 15 to <30 (q12h) | t1/2 (h) | 2.06 - 3.06 | 2.01 - 3.04 | TRUE |
| Ampicillin | CRCL 5 to <15 (q24h) | Cmax (ug/mL) | 170 - 185 | 163.45 - 180.91 | TRUE |
| Ampicillin | CRCL 5 to <15 (q24h) | AUC(0,48h) (ug/mL*h) | 1160 - 2310 | 1106.68 - 2308.09 | TRUE |
| Ampicillin | CRCL 5 to <15 (q24h) | t1/2 (h) | 3.2 - 6.27 | 3.05 - 6.24 | TRUE |
| Sulbactam | CRCL 60-90 (q6h) | Cmax (ug/mL) | 68.6 - 74.2 | 63.57 - 69.82 | TRUE |
| Sulbactam | CRCL 60-90 (q6h) | AUC(0,48h) (ug/mL*h) | 650 - 861 | 645.96 - 857.6 | TRUE |
| Sulbactam | CRCL 60-90 (q6h) | t1/2 (h) | 1.09 - 1.33 | 1.08 - 1.3 | TRUE |
| Sulbactam | CRCL 30 to <60 (q6h) | Cmax (ug/mL) | 74.4 - 85.1 | 69.82 - 81.61 | TRUE |
| Sulbactam | CRCL 30 to <60 (q6h) | AUC(0,48h) (ug/mL*h) | 872 - 1380 | 857.61 - 1380.38 | TRUE |
| Sulbactam | CRCL 30 to <60 (q6h) | t1/2 (h) | 1.34 - 1.96 | 1.3 - 1.93 | TRUE |
| Sulbactam | CRCL 30 to <60 (q8h) | Cmax (ug/mL) | 73.3 - 81.5 | 68.76 - 78.09 | TRUE |
| Sulbactam | CRCL 30 to <60 (q8h) | AUC(0,48h) (ug/mL*h) | 655 - 1050 | 644.83 - 1041.99 | TRUE |
| Sulbactam | CRCL 30 to <60 (q8h) | t1/2 (h) | 1.34 - 1.96 | 1.32 - 1.94 | TRUE |
| Sulbactam | CRCL 15 to <30 (q12h) | Cmax (ug/mL) | 79.5 - 86.4 | 75.77 - 83.6 | TRUE |
| Sulbactam | CRCL 15 to <30 (q12h) | AUC(0,48h) (ug/mL*h) | 718 - 1120 | 699.18 - 1122.19 | TRUE |
| Sulbactam | CRCL 15 to <30 (q12h) | t1/2 (h) | 2 - 3.03 | 1.95 - 3.01 | TRUE |
| Sulbactam | CRCL 5 to <15 (q24h) | Cmax (ug/mL) | 83.1 - 90.7 | 79.97 - 88.56 | TRUE |
| Sulbactam | CRCL 5 to <15 (q24h) | AUC(0,48h) (ug/mL*h) | 599 - 1190 | 569.43 - 1186.47 | TRUE |
| Sulbactam | CRCL 5 to <15 (q24h) | t1/2 (h) | 3.16 - 6.28 | 3.01 - 6.26 | TRUE |
Any FALSE row in the in_pub_range column should be
investigated in the source paper rather than tuned to match.
Assumptions and deviations
-
Residual error correlation dropped. Soto 2014 Table
2 reports a cross-drug residual-error correlation rho[eps_ij(1),
eps_ij(2)] = 0.946 arising from the LC-MS/MS assay sampling both
analytes from the same plasma specimen. rxode2 / nlmixr2 typical
forward-simulation does not encode cross-output residual correlation for
proportional error models, so the packaged model declares
propSd(ampicillin) andpropSd_sbt(sulbactam) residuals independently. The cross-drug correlation is documented here for completeness; reproducing it in simulation would require a joint multivariate residual sampler external to the standard rxode2 pipeline. -
LTBS additive == linear-space proportional. Soto
2014 used a log-transform-both-sides (LTBS) additive residual error
model with EPS(1) and EPS(2) on the log-transformed observations. In
linear space this is equivalent to proportional error with SD equal to
the reported CV%, so the model file encodes residuals as
Cc ~ prop(propSd)andCc_sbt ~ prop(propSd_sbt)withpropSd = 0.242andpropSd_sbt = 0.233(Table 2 LTBS-CV values). - No covariate effects on V1 or Q. Soto 2014 explored body weight, age, gender, gamma-GTP, AST, and ALT as candidate covariates on CL and body weight and gender on V1 and V2 (Methods, Covariate model subsection). Only CLcr on CL and body weight on V2 survived; V1 and Q carry no covariate effects in the final model.
- WT on V2 fixed at exponent 1. The forwards inclusion step identified body weight on V2 as statistically significant for ampicillin but the stepwise backwards exclusion did not retain it for sulbactam. The authors nevertheless included WT on V2 as a fixed (exponent = 1) physiological linear allometric scaling for both drugs, on clinical plausibility grounds (Results, Pharmacokinetic analyses paragraph 4). Both drugs use the same fixed exponent.
-
Single shared theta_CLcr. Integrating the two
drug-specific CLcr exponents into a single common parameter increased
OFV by only 0.054 points; the final model uses one shared
e_crcl_cl = 0.701applied to CL of both drugs. -
No V2 IIV correlation across drugs. The cross-drug
correlation of eta_V2 was not statistically significant (delta OFV =
-0.673; Results, paragraph 4), so
etalvpandetalvp_sbtare declared independently. -
Typical-value (no IIV) for Table 4 comparison. Soto
2014 Table 4 reports ranges across the min / max CLcr of each
renal-function band for a 51-kg typical subject (no inter-individual
variability). The vignette mirrors this by simulating with
rxode2::zeroRe()so the simulated points are deterministic typical-value predictions. -
No PD / time-above-MIC simulation here. The Soto
2014 PD analyses (free fraction f = 0.72 applied to plasma ampicillin to
compute f-t > MIC%; Methods, Pharmacodynamic analyses subsection;
Tables 3 and Figures 4-5) are derivative simulations conditional on the
same structural PK model. They are not packaged in the
model()body because the free-fraction conversion is a post-processing step on simulated ampicillin concentrations rather than a structural PK feature; users interested in t-above-MIC simulations can applyCc_free = 0.72 * Ccdirectly to the model output and compare against per-pathogen MIC values from Soto 2014 Table 3.