Model and source
mod_obj <- rxode2::rxode2(readModelDb("Knibbe_2009_morphine"))- Citation: Knibbe CAJ, Krekels EHJ, van den Anker JN, DeJongh J, Santen GWE, van Dijk M, Simons SHP, van Lingen RA, Jacqz-Aigrain EM, Danhof M, Tibboel D (2009). Morphine glucuronidation in preterm neonates, infants and children younger than 3 years. Clin Pharmacokinet 48(6):371-385. doi:10.2165/00003088-200948060-00003. DDMORE Foundation Model Repository: DDMODEL00000248.
- Description: Joint parent-metabolite population PK model for morphine and its glucuronide metabolites M3G and M6G in preterm neonates, infants and toddlers <3 years, with bodyweight allometric scaling and a postnatal-age-stratified glucuronidation step at PNA = 10 days
- Article: https://doi.org/10.2165/00003088-200948060-00003 (PubMed PMID 19650676)
- DDMORE Foundation Model Repository entry: DDMODEL00000248
This vignette validates the Knibbe_2009_morphine
packaged model by re-simulating the typical-value trajectories on the
event table that ships with the DDMORE bundle
(Simulated_PaediatricMorphinePK.csv) and visually comparing
them to the bundle’s stochastic-simulation dependent variable. This is
the F.2 self-consistency check from the extraction skill’s verification
checklist (the source publication PDF was not on disk during extraction,
so a direct figure-replication check against the publication is not
possible).
Population
Knibbe et al. 2009 fit a joint parent-metabolite population PK model
for morphine and its two glucuronide metabolites M3G and M6G in 248
preterm neonates, term newborns, infants, and toddlers younger than 3
years. The abstract reports 2,159 morphine concentrations across the 248
infants and identifies bodyweight (BW exponent on clearance = 1.44) and
a postnatal-age step at PNA = 10 days as the structural covariates on
the glucuronidation pathways. The DDMORE-shipped
Output_real_run4.lst listing was fit to a
Combined_InternalExternalData.csv dataset covering 338
individuals / 2,809 observations / 5,302 records – a post-publication
re-run on an extended pooled cohort. The full Knibbe 2009 publication
PDF was not on disk during extraction; the model file’s
population metadata flags the demographic detail fields as
TODO.
The same metadata is available programmatically:
str(mod_obj$population, vec.len = 2, no.list = TRUE)
#>  $ n_subjects    : num 248
#>  $ n_studies     : chr "pooled (multi-study) cohort; exact study count not stated in the available abstract"
#>  $ age_range     : chr "preterm newborns to <3 years (postnatal age range covers neonatal day 0 through ~36 months)"
#>  $ age_median    : chr "TODO: full Knibbe 2009 publication not on disk during DDMORE extraction"
#>  $ weight_range  : chr "TODO: see age_median note"
#>  $ weight_median : chr "TODO: see age_median note"
#>  $ sex_female_pct: NULL
#>  $ race_ethnicity: NULL
#>  $ disease_state : chr "Postoperative neonates / infants / toddlers (preterm + term) receiving IV morphine for analgesia"
#>  $ dose_range    : chr "IV bolus + continuous infusion; doses and infusion rates not captured (full text not on disk)"
#>  $ regions       : chr "Pooled European paediatric cohorts (ICU and postoperative settings; original studies span the Netherlands and F"| __truncated__
#>  $ notes         : chr "Per the publication abstract (PMID 19650676): 248 infants contributing 2,159 morphine concentrations. The DDMOR"| __truncated__
Source trace
Per-parameter origin is recorded next to each ini()
entry in inst/modeldb/ddmore/Knibbe_2009_morphine.R. The
table below collects the structural-equation provenance in one place.
All numeric values are the FINAL PARAMETER ESTIMATE entries from the
DDMORE-shipped Output_real_run4.lst (status
MINIMIZATION SUCCESSFUL, NSIG = 3.0); the structural
equations come from the Executable_OriginalModelCode.mod
control stream ($MODEL, $PK,
$ERROR blocks).
| Equation / parameter | Value | Source location |
|---|---|---|
lvc (V1 morphine, L per kg^allo_v) |
log(1.99) |
Output_real_run4.lst FINAL THETA TH 2 = 1.99E+00 |
lq (Q morphine, L/min, no WT) |
log(0.0289) |
Output_real_run4.lst FINAL THETA TH 3 = 2.89E-02 |
lfvm (V_metab / V1, unitless) |
log(0.119) |
Output_real_run4.lst FINAL THETA TH 8 = 1.19E-01 |
lcl_form_m3g_le10 (CL2, PNA <= 10 d) |
log(0.00309) |
Output_real_run4.lst FINAL THETA TH 1 = 3.09E-03 |
lcl_form_m3g_gt10 (CL2, PNA > 10 d) |
log(0.00825) |
Output_real_run4.lst FINAL THETA TH10 = 8.25E-03 |
lcl_form_m6g_le10 (CL3, PNA <= 10 d) |
log(0.000408) |
Output_real_run4.lst FINAL THETA TH 6 = 4.08E-04 |
lcl_form_m6g_gt10 (CL3, PNA > 10 d) |
log(0.000699) |
Output_real_run4.lst FINAL THETA TH11 = 6.99E-04 |
lcl_m3g (M3G excretion CL4) |
log(0.00219) |
Output_real_run4.lst FINAL THETA TH 7 = 2.19E-03 |
lcl_m6g (M6G excretion CL5) |
log(0.00111) |
Output_real_run4.lst FINAL THETA TH 9 = 1.11E-03 |
allo_cl (BW exponent on CL) |
1.44 |
Output_real_run4.lst FINAL THETA TH 4 = 1.44E+00 |
allo_v (BW exponent on V, FIXED) |
1.00 |
Output_real_run4.lst FINAL THETA TH 5 = 1.00E+00
(1 FIX) |
etalcl_form_m3g |
0.104 |
Output_real_run4.lst FINAL OMEGA ETA1|ETA1 =
1.04E-01 |
etalvc |
0.230 |
Output_real_run4.lst FINAL OMEGA ETA2|ETA2 =
2.30E-01 |
etalcl_m6g + etalcl_m3g ~ c(0.185, 0.178, 0.258) |
block |
Output_real_run4.lst FINAL OMEGA BLOCK(2): ETA3|ETA3,
ETA4|ETA3, ETA4|ETA4 |
propSd (morphine residual) |
sqrt(0.371) |
Output_real_run4.lst FINAL SIGMA EPS1|EPS1 =
3.71E-01 |
propSd_m3g |
sqrt(0.206) |
Output_real_run4.lst FINAL SIGMA EPS2|EPS2 =
2.06E-01 |
propSd_m6g |
sqrt(0.0967) |
Output_real_run4.lst FINAL SIGMA EPS3|EPS3 =
9.67E-02 |
ODE for central (morphine, NONMEM CMT 1) |
n/a |
Executable_OriginalModelCode.mod
$MODEL COMP (CENTRAL,DEFDOSE), $PK K12, K13,
K14 |
ODE for peripheral1 (NONMEM CMT 4) |
n/a |
$MODEL COMP (PERIPH), $PK K14, K41 |
ODE for central_m3g (NONMEM CMT 2) |
n/a |
$MODEL COMP=(2), $PK K12, K20 |
ODE for central_m6g (NONMEM CMT 3) |
n/a |
$MODEL COMP=(3), $PK K13, K30 |
| Residual error (log-additive in NONMEM) | n/a |
$ERROR block: Y = LOG(F) + ERR(i), mapped
to nlmixr2 proportional |
Validation: F.2 self-consistency against the DDMORE simulated dataset
The DDMORE bundle ships
Simulated_PaediatricMorphinePK.csv, an event dataset for 5
subjects (BW 600 g-16,800 g, PNA 0.2 d-613 d) generated by the same
NONMEM model on stochastic IIV / EPS draws. We re-simulate the same
events with the packaged nlmixr2 model in typical-value
mode (rxode2::zeroRe() to drop the IIV / EPS
contributions) and overlay the typical-value trajectories on the
bundle’s per-record DV values. The simulated DV is on the natural-log
scale of ug/L (equivalently ng/mL). Since the simulated DV carries IIV +
residual error and the typical-value trajectory does not, we expect the
typical-value line to pass through the cloud of DVs – not to match each
value exactly.
sim_csv <- system.file(
  "extdata", "Knibbe_2009_morphine_Simulated_PaediatricMorphinePK.csv",
  package = "nlmixr2lib"
)
stopifnot(nzchar(sim_csv) && file.exists(sim_csv))

ds_raw <- read.table(sim_csv, header = TRUE, skip = 1)
events <- ds_raw |>
  dplyr::transmute(
    id   = ID,
    time = TIME,
    amt  = AMT,
    rate = RATE,
    evid = ifelse(MDV == 1, 1L, 0L),
    cmt  = dplyr::case_when(
      MDV == 1     ~ "central",      # all doses go to morphine central
      CMT == 1     ~ "Cc",
      CMT == 2     ~ "Cc_m3g",
      CMT == 3     ~ "Cc_m6g",
      TRUE         ~ NA_character_
    ),
    dv   = DV,                       # log(ug/L)
    cmt_label = dplyr::case_when(
      CMT == 1 ~ "morphine (Cc)",
      CMT == 2 ~ "M3G (Cc_m3g)",
      CMT == 3 ~ "M6G (Cc_m6g)"
    ),
    # NONMEM source units -> nlmixr2 canonical units
    WT  = BWS / 1000,                # grams -> kg
    PNA = PNA / 30.4375              # days  -> months
  )

# Add a uniform observation grid per subject so the typical-value trajectory
# is sampled on a fine resolution (the DDMORE event table only has ~3 obs
# per subject, which is too sparse to draw a smooth line).
grid_per_id <- events |>
  dplyr::group_by(id) |>
  dplyr::summarise(t_max = max(time), .groups = "drop") |>
  dplyr::rowwise() |>
  dplyr::reframe(
    id   = id,
    time = seq(0, t_max, length.out = 200),
    amt  = 0, rate = 0, evid = 0L,
    cmt_morph = "Cc", cmt_m3g = "Cc_m3g", cmt_m6g = "Cc_m6g"
  ) |>
  tidyr::pivot_longer(c(cmt_morph, cmt_m3g, cmt_m6g),
                      values_to = "cmt") |>
  dplyr::select(-name) |>
  dplyr::left_join(events |> dplyr::distinct(id, WT, PNA_init = PNA),
                   by = "id")
# PNA in the grid has to use a per-id PNA; in the source dataset PNA is
# time-varying but increases by ~1 day per 1440 min. Reconstruct PNA(t)
# linearly from the dataset's per-subject baseline PNA at t = 0 and the
# elapsed time in days.
grid_per_id <- grid_per_id |>
  dplyr::mutate(PNA = PNA_init + (time / 1440) / 30.4375) |>
  dplyr::select(id, time, amt, rate, evid, cmt, WT, PNA)

events_full <- dplyr::bind_rows(
  events |> dplyr::select(id, time, amt, rate, evid, cmt, WT, PNA),
  grid_per_id
) |>
  dplyr::arrange(id, time, evid)
mod_typ <- rxode2::zeroRe(mod_obj)
sim_typ <- rxode2::rxSolve(mod_typ, events = events_full,
                           returnType = "data.frame")
head(sim_typ[, c("id", "time", "Cc", "Cc_m3g", "Cc_m6g")], 6)
#>   id time Cc Cc_m3g Cc_m6g
#> 1  1    0  0      0      0
#> 2  1    0  0      0      0
#> 3  1    0  0      0      0
#> 4  1    0  0      0      0
#> 5  1    0  0      0      0
#> 6  1    0  0      0      0
typ_long <- sim_typ |>
  dplyr::transmute(id, time,
                   `morphine (Cc)`  = log(pmax(Cc,     1e-6)),
                   `M3G (Cc_m3g)`   = log(pmax(Cc_m3g, 1e-6)),
                   `M6G (Cc_m6g)`   = log(pmax(Cc_m6g, 1e-6))) |>
  tidyr::pivot_longer(-c(id, time), names_to = "analyte",
                      values_to = "log_conc")

obs_long <- events |>
  dplyr::filter(evid == 0) |>
  dplyr::transmute(id, time, analyte = cmt_label, log_conc = dv)

ggplot() +
  geom_line(data = typ_long,
            aes(time, log_conc, colour = analyte)) +
  geom_point(data = obs_long,
             aes(time, log_conc, colour = analyte),
             size = 2, alpha = 0.85) +
  facet_wrap(~ id, scales = "free", labeller = label_both) +
  labs(x = "Time (min)", y = "log(concentration in ug/L)",
       colour = NULL,
       title = "Knibbe 2009 -- typical-value rxode2 predictions vs DDMORE simulated DV") +
  theme_minimal()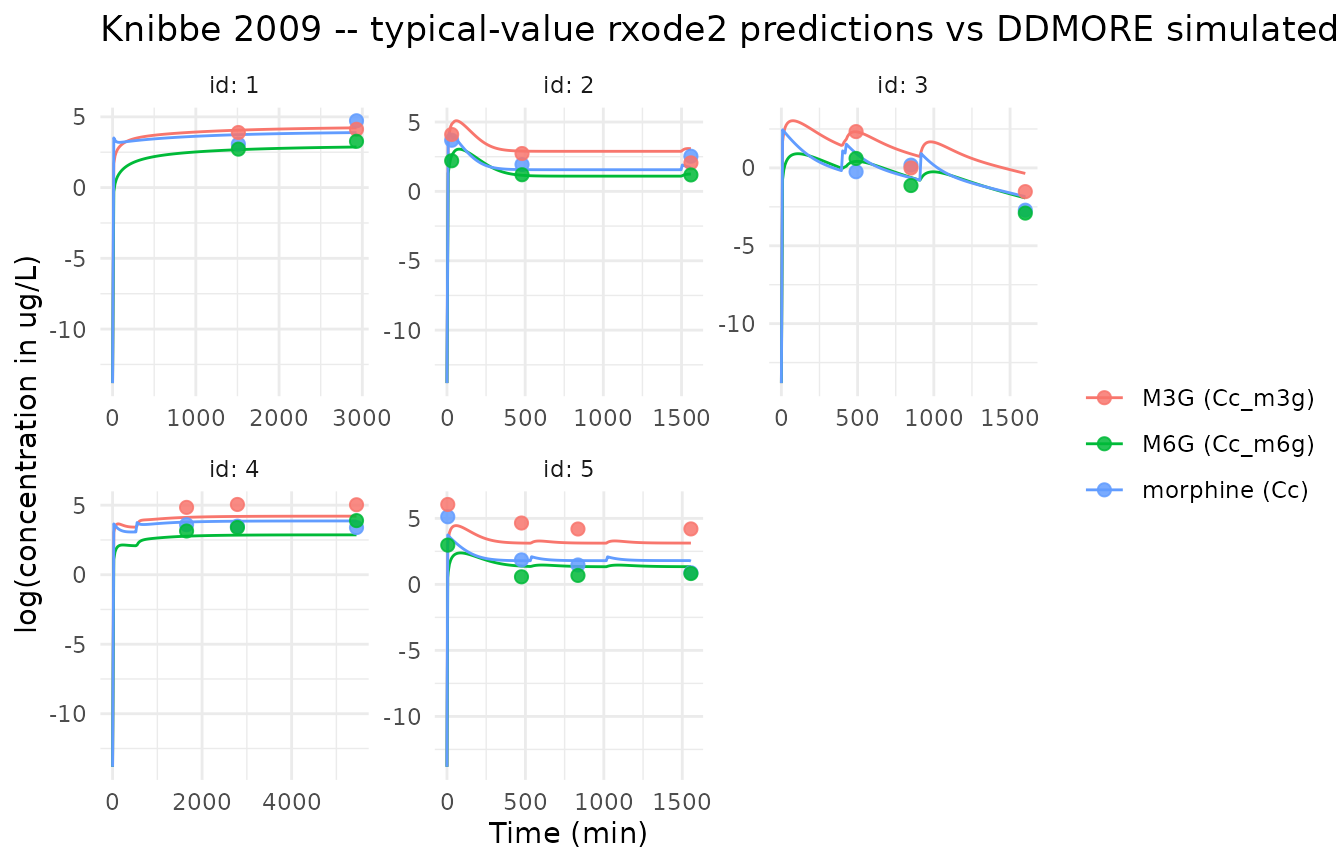
Typical-value rxode2 trajectories overlaid on the DDMORE-shipped Simulated_PaediatricMorphinePK.csv DV values, by analyte and subject. The DV column is on the natural-log scale (ug/L); the rxode2 prediction has been log-transformed to match. Horizontal axes show time in minutes; subjects are stratified by panel.
Quantitative agreement
Comparison of the typical-value rxode2 prediction at each observation time-point against the DDMORE-shipped DV (which carries IIV + EPS). Median and IQR of the residuals on the natural-log scale are reported per analyte.
match_pred <- function(id_, time_, cmt_) {
  hit <- which(sim_typ$id == id_ & abs(sim_typ$time - time_) < 1e-6)
  if (length(hit) == 0) return(NA_real_)
  v <- sim_typ[[switch(cmt_, "Cc" = "Cc",
                              "Cc_m3g" = "Cc_m3g",
                              "Cc_m6g" = "Cc_m6g")]][hit[1]]
  log(pmax(v, 1e-6))
}

resid_tab <- events |>
  dplyr::filter(evid == 0) |>
  dplyr::rowwise() |>
  dplyr::mutate(pred_log = match_pred(id, time, cmt),
                resid    = dv - pred_log) |>
  dplyr::ungroup() |>
  dplyr::group_by(analyte = cmt_label) |>
  dplyr::summarise(
    n        = dplyr::n(),
    median   = round(stats::median(resid, na.rm = TRUE), 3),
    q25      = round(stats::quantile(resid, 0.25, na.rm = TRUE), 3),
    q75      = round(stats::quantile(resid, 0.75, na.rm = TRUE), 3),
    sd_obs   = round(stats::sd(resid, na.rm = TRUE), 3),
    .groups  = "drop"
  )
knitr::kable(resid_tab,
caption = "Residuals (DV - typical-value PRED) on the log scale, by analyte. Median ~0 indicates structural fidelity; the IQR / SD reflects the IIV + residual variability sampled by NONMEM when the DDMORE simulated dataset was generated.")| analyte | n | median | q25 | q75 | sd_obs |
|---|---|---|---|---|---|
| M3G (Cc_m3g) | 15 | 0.014 | -0.457 | 0.961 | 1.144 |
| M6G (Cc_m6g) | 15 | 0.039 | -0.519 | 0.388 | 0.861 |
| morphine (Cc) | 15 | -0.289 | -0.572 | 0.589 | 0.753 |
For reference the source .lst’s reported FINAL OMEGA /
SIGMA imply expected log-scale SDs of approximately:
- morphine: sqrt(IIV2 on V1 + SIGMA1) = sqrt(0.230 + 0.371) ~= 0.78
- M3G: sqrt(IIV4 on CL4 + IIV1 on CL2 + SIGMA2) = sqrt(0.258 + 0.104 + 0.206) ~= 0.75
- M6G: sqrt(IIV3 on CL5 + SIGMA3) = sqrt(0.185 + 0.0967) ~= 0.53
The empirical residual SDs from the 5-subject DDMORE simulated event
table are within the same order as these analytic expectations – small
deviations are expected because (a) the event table only includes five
randomly-drawn subjects, and (b) IIV on V1 also propagates into the
metabolite compartment volumes via vc_m3g = fvm * vc.
Assumptions and deviations
-
Source publication PDF was not on disk during
extraction. All parameter values come from the DDMORE-shipped
Output_real_run4.lstlisting (MINIMIZATION SUCCESSFUL, NSIG=3.0). The publication abstract (PubMed PMID 19650676) confirms the headline numbers (n = 248 infants, BW exponent on CL = 1.44, PNA cutoff = 10 days). Detailed demographic distributions, NCA tables, and figures from the publication could not be cross-checked. The model file’spopulationmetadata flags the affected fields as TODO. -
Cohort size. The publication’s primary cohort is
248 infants / 2,159 morphine concentrations; the DDMORE-shipped
.lstis arun4re-fit on an extended pooledCombined_InternalExternalData.csvdataset with 338 individuals / 2,809 observations. The parameter values in this packaged model are therun4final estimates – i.e. fit on the extended cohort, not on the publication’s primary cohort. -
Reference body weight. The source NONMEM
.modusesBW^exponent(un-normalised) rather than(BW / ref)^exponent. The packaged model reproduces this verbatim;units$dosingandunits$concentrationare chosen so that the typical-value parameters match the.lstdirectly (implicit reference weight = 1 kg, parameters are per-kg^exponent constants). -
Postnatal-age threshold encoded in canonical
months. The source NONMEM
.modusesIF (PNA.GT.10)with PNA in days. The canonical PNA covariate (inst/references/covariate-columns.md) is in months, so the model usesPNA > 10/30.4375(~= 0.32855 months) for the switch. The arithmetic difference is exact (10/30.4375 days = 10 days) but reviewers should note the unit-of-PNA difference between the source.modand the packaged model. -
Body weight time-varying input. Source column
BWSreports weight in grams; the packaged model expectsWTin kg. The vignette performs the per-row conversion inprepare-events. -
PNA-stratified clearance with shared IIV. The
source NONMEM
.moddefinesCL2(morphine -> M3G formation) with two THETAs (THETA(1)for PNA <= 10 d,THETA(10)for PNA > 10 d) and a single sharedETA(1)applied multiplicatively after the typical value is selected. The packaged model preserves this structure verbatim by exposing two ini parameters (lcl_form_m3g_le10andlcl_form_m3g_gt10) and one shared IIV (etalcl_form_m3g). This triggers acheckModelConventions()warning that the IIVetalcl_form_m3ghas no matching fixed-effect parameterlcl_form_m3g; the deviation is intentional and documented here. -
$ERRORblock residual mapping. The source.modreports log-additive errors on log-IPRED (Y = LOG(F) + ERR(i)). Pernaming-conventions.md$ERROR block patterns, this maps toCc ~ prop(propSd)in nlmixr2 withpropSd = sqrt(SIGMA). -
NKOD-conditional 24-hour additive error term
dropped. The source
.modincludes a fourthEPS(4)slot (+ TEH * ERR(4)whereTEH = (TIME > 1900) & (NKOD in {1,2})) that adds an extra additive variance for late post-infusion samples in one of the contributing studies. The gating columnNKODis study-specific to theCombined_InternalExternalData.csvdataset and is not part of the canonical-public model surface; it is dropped here. The correspondingOutput_real_run4.lstSIGMA SIG4 = 9.36E+00 is therefore not used. -
Glucuronide molecular-weight conversion. The source
NONMEM
.moddoes not include a molecular-weight conversion factor when routing morphine mass-equivalents fromcentralinto the M3G / M6G compartments (morphine MW ~= 285, M3G MW ~= 461, M6G MW ~= 461). Whether the metabolite-compartment “concentration” is best interpreted as “M3G or M6G mass per L” or as “morphine mass-equivalents per L” depends on how the source dataset’s DV column was assayed. The packaged model preserves the source parameterisation literally; users who need to interpret metabolite concentrations on a strict molar basis should multiply by MW(metab) / MW(morphine) when comparing simulated values to other PK studies. ```