Daratumumab TMDD/QSS (Li 2021)
Source:vignettes/articles/Li_2021_daratumumab_qsstmdd.Rmd
Li_2021_daratumumab_qsstmdd.RmdModel and source
- Citation: Li X, Perez Ruixo C, Zhou H, Perez Ruixo JJ, Dosne AG. Population-based Target-Mediated Drug Disposition (TMDD) Pharmacokinetics Model of Daratumumab in Patients With Multiple Myeloma Following Intravenously Daratumumab Monotherapy. PAGE 29 (2021) Abstr 9701. www.page-meeting.org/?abstract=9701
- Description: Two-compartment semi-mechanistic target-mediated drug-disposition (TMDD) population PK model for IV daratumumab (anti-CD38 IgG1) in adults with multiple myeloma, with parallel non-specific linear clearance and CD38-mediated saturable clearance under the quasi-steady-state (QSS) approximation of Gibiansky 2008. The TMDD/QSS form supersedes an earlier empirical Michaelis-Menten parameterisation with time-dependent Vmax: receptor (CD38) turnover and complex internalisation reproduce mechanistically the observed Vmax time-dependency. PAGE 29 (2021) abstract II-52 by Li, Perez Ruixo, Zhou, Perez Ruixo, and Dosne (Janssen R and D, Beerse). Distinct from Xu 2020 daratumumab, which uses the empirical 2-cmt parallel-linear / time-dependent Vmax form.
- Source: PAGE 29 (2021) abstract II-52 / 9701 (https://www.page-meeting.org/?abstract=9701). No journal full text exists for this poster; the conference abstract is the sole source.
The model is a semi-mechanistic TMDD/QSS extension of the empirical
two-compartment parallel-linear + Michaelis-Menten daratumumab popPK
model. Receptor (CD38) turnover and drug-target complex internalisation
mechanistically reproduce the time-dependent Vmax decay that the earlier
empirical Xu lineage modeled phenomenologically. See
modellib('Xu_2020_daratumumab') for the empirical 2-cmt
parallel-linear + MM (time-dependent Vmax) parameterisation; the two
models describe the same drug but with structurally different
elimination mechanisms.
Population
The Li 2021 PAGE analysis pooled 2,572 PK samples from 223 subjects in the daratumumab monotherapy arms of two pivotal studies:
- GEN501 – Phase 1/2 study with a dose-escalation phase (daratumumab 0.005 to 24 mg/kg IV) followed by a single-arm expansion at 8 or 16 mg/kg IV. Maintenance schedule: once weekly (QW) followed by every 2 weeks (Q2W) for 16 weeks, then every 4 weeks (Q4W) for up to 72 weeks.
- MMY2002 (SIRIUS) – Phase 2 open-label, multicenter study with subjects randomised to 8 mg/kg IV Q4W or 16 mg/kg IV QW for 8 weeks followed by Q2W for 16 weeks then Q4W.
In both studies patients received daratumumab monotherapy with no
background therapies. Demographic detail (age, weight distribution, sex
split, race) is not reported in the PAGE abstract; the available
metadata is reflected in
readModelDb("Li_2021_daratumumab_qsstmdd")$population.
Source trace
All values below come from the PAGE 29 (2021) abstract Results section. The abstract reports the structural typical-value estimates and the residual unexplained variability but does not report inter-individual variability magnitudes, covariate coefficient values, or reference covariate values.
| Equation / parameter | Value | Source location |
|---|---|---|
lcl (CL) |
0.0051 L/h | PAGE 29 abstract Results |
lvc (V1) |
3.76 L | PAGE 29 abstract Results |
lq (Q) |
0.0329 L/h | PAGE 29 abstract Results |
lvp (V2) |
3.31 L | PAGE 29 abstract Results (printed as “L/h” – treated as typo: V2 is a volume) |
lksyn (Ksyn) |
0.178 mg/L/h | PAGE 29 abstract Results |
lkdeg (Kdeg) |
0.0082 1/h | PAGE 29 abstract Results |
lkint (Kint) |
0.092 1/h | PAGE 29 abstract Results |
lkss (Kss) |
1.79 mg/L | PAGE 29 abstract Results (printed unit “1/h” treated as typo; QSS Kss is a concentration) |
| Residual error (proportional) | 22.7% | PAGE 29 abstract Results: RUV 22.7% |
QSS algebra (Eq. for complex, cfree,
tfree) |
n/a | Gibiansky 2008 J Pharmacokinet Pharmacodyn 35(5):573-591 (Eq. 7) |
ODE structure (d/dt(central),
d/dt(peripheral1), d/dt(total_target)) |
n/a | PAGE 29 abstract Methods + Gibiansky 2008 QSS form |
| Statistically significant covariates | WT, ALB, MM type, sex (CL); WT, sex (V1) | PAGE 29 abstract Results (coefficient values not in source) |
Virtual cohort
Individual GEN501 / MMY2002 patient covariate values are not publicly available. The simulation below uses a single typical-value subject receiving the standard daratumumab monotherapy maintenance schedule (16 mg/kg IV QW for 8 weeks -> Q2W for 16 weeks -> Q4W) so the predicted concentration trajectory illustrates the structural model behaviour without between-subject variability (which the source does not report).
set.seed(20210901L)

# Standard daratumumab maintenance schedule used in MMY2002 / DARA-monotherapy.
# Dose amount uses a representative 72 kg body weight to convert the per-kg
# dose to the absolute mg input required by the model.
ref_wt <- 72  # kg (representative; abstract does not state a reference)
qw_times  <- (0:7)  * 7 * 24                           # weeks 0-7
q2w_times <- 8 * 7 * 24 + 14 * 24 * (0:7)               # weeks 8-22
q4w_times <- max(q2w_times) + 28 * 24 * (1:6)           # extending through ~36 weeks
all_times <- c(qw_times, q2w_times, q4w_times)
dose_amt  <- 16 * ref_wt                                # 16 mg/kg * 72 kg = 1152 mg
inf_dur   <- 3.4                                        # hours (typical maintenance infusion duration)

dose_rows <- tibble(
  id    = 1L,
  time  = all_times,
  amt   = dose_amt,
  evid  = 1L,
  cmt   = "central",
  dur   = inf_dur
)

# Dense observation grid through the dosing window plus a 12-week washout
# tail that lets the QSS-TMDD recovery dynamics show up clearly.
obs_times <- sort(unique(c(
  seq(0, max(all_times), by = 6),
  seq(max(all_times), max(all_times) + 12 * 7 * 24, by = 12)
)))

obs_rows <- tibble(
  id    = 1L,
  time  = obs_times,
  amt   = 0,
  evid  = 0L,
  cmt   = "central",
  dur   = 0
)

events <- bind_rows(dose_rows, obs_rows) |>
  arrange(time, desc(evid))
Simulation
The packaged model has no IIV declared (the PAGE abstract does not
report the eta magnitudes), so rxSolve returns the
typical-value trajectory.
mod <- readModelDb("Li_2021_daratumumab_qsstmdd")

sim <- rxode2::rxSolve(mod, events = events, addDosing = FALSE) |>
  as.data.frame()

# rxSolve omits the id column when the event table contains a single
# subject; restore it so downstream chunks can group / filter on id.
if (!"id" %in% names(sim)) sim$id <- 1L
Predicted concentration and target dynamics
The PAGE abstract does not include a figure that can be replicated numerically (it is a conference poster); instead, the two plots below illustrate the structural behaviour the TMDD/QSS model introduces:
- Total daratumumab concentration during maintenance therapy.
- Total target (CD38) concentration dynamics, which decline rapidly under drug pressure (because Kint >> Kdeg, as noted in the abstract Results section).
sim |>
  filter(!is.na(Cc)) |>
  ggplot(aes(time / (7 * 24), Cc)) +
  geom_line(linewidth = 0.8) +
  labs(x = "Time (weeks)", y = "Daratumumab Cc (mg/L)",
       title = "Typical-value daratumumab serum concentration",
       caption = "16 mg/kg IV (1152 mg for a 72 kg subject), QW x 8 -> Q2W x 8 -> Q4W.")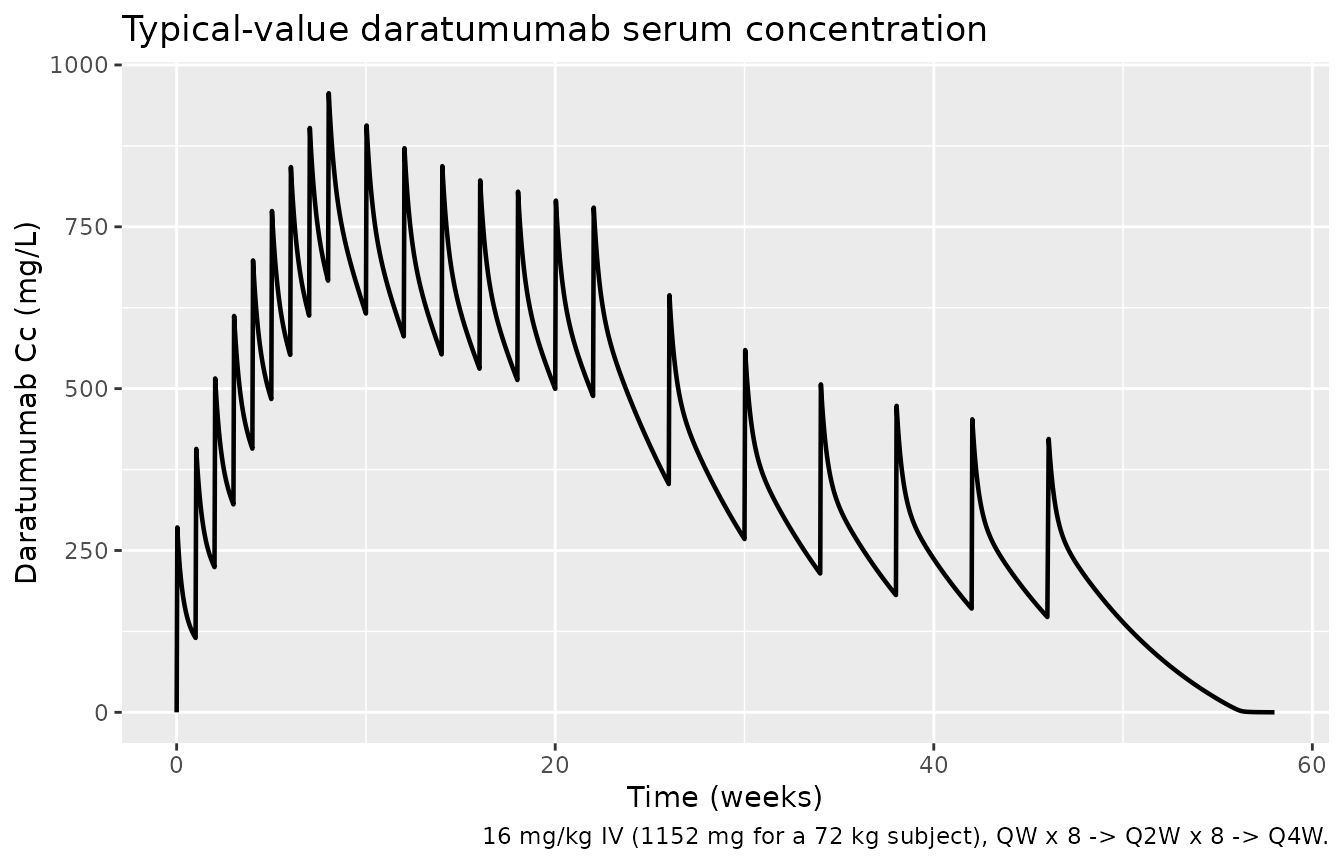
sim |>
  filter(!is.na(Cc)) |>
  ggplot(aes(time / (7 * 24), total_target)) +
  geom_line(linewidth = 0.8) +
  labs(x = "Time (weeks)", y = "Total CD38 target (mg/L)",
       title = "Typical-value total CD38 target concentration",
       caption = "Receptor (CD38) decline mediated by Kint >> Kdeg, as described in the abstract.")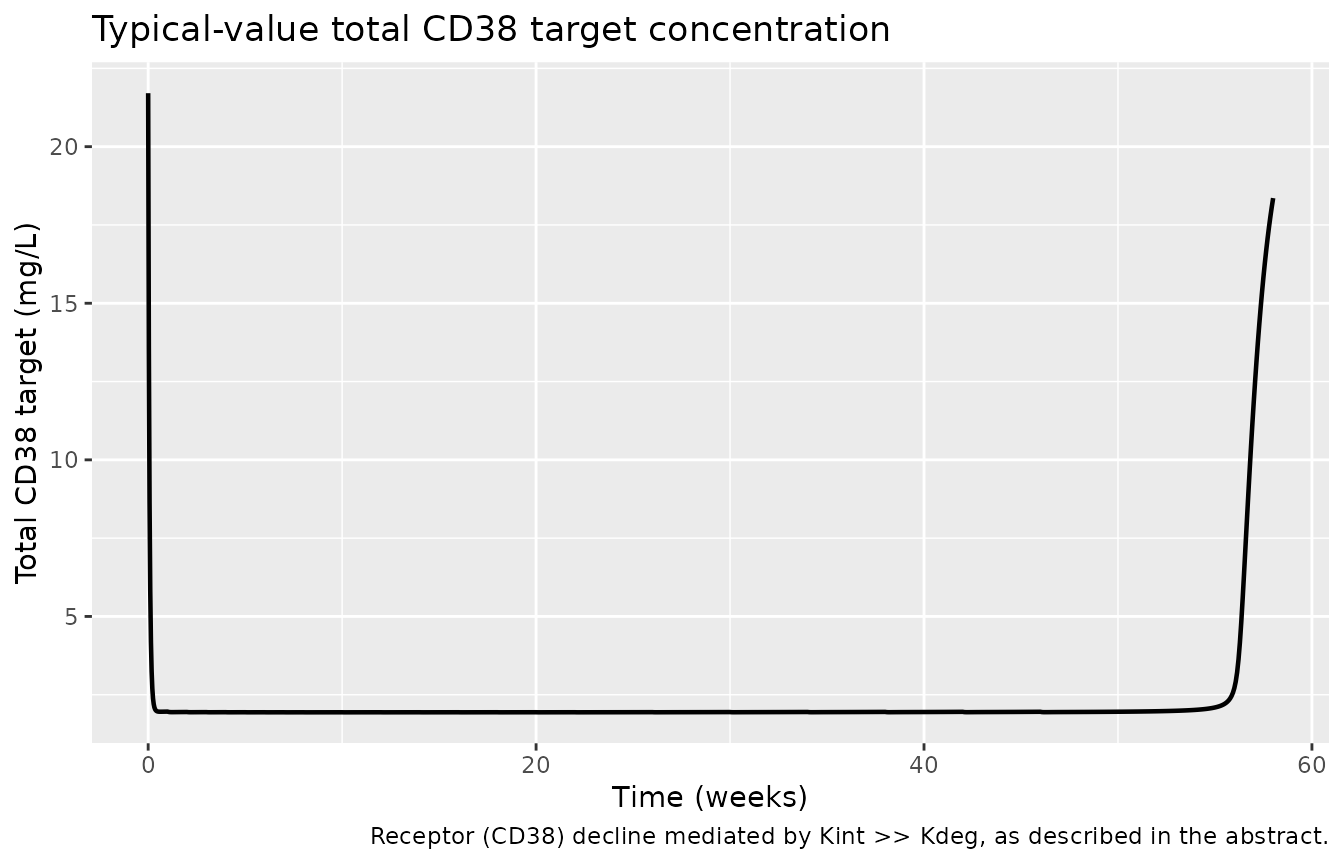
The receptor decline is the mechanistic counterpart of the empirical
time-dependent Vmax decay in the Xu 2020 daratumumab parameterisation
(see modellib('Xu_2020_daratumumab')): as CD38 is
internalised via the drug-target complex faster than it is replenished
by Ksyn, the apparent target-mediated elimination capacity falls over
time.
PKNCA validation
Daratumumab is given as multi-hour IV infusions. The PKNCA summary below reports Cmax / Tmax / AUClast / Cmin for the first dose interval (first weekly 16 mg/kg infusion), where the parallel-elimination behaviour and target binding are most visible.
sim_first_week <- sim |>
  filter(!is.na(Cc), time <= 7 * 24) |>
  select(id, time, Cc) |>
  mutate(treatment = "16 mg/kg QW (first dose)")

# Guarantee a time-zero pre-dose row (Cc = 0 before the first IV input).
sim_first_week <- bind_rows(
  sim_first_week,
  sim_first_week |>
    distinct(id, treatment) |>
    mutate(time = 0, Cc = 0)
) |>
  distinct(id, treatment, time, .keep_all = TRUE) |>
  arrange(id, treatment, time)

dose_first_week <- events |>
  filter(evid == 1, time == 0) |>
  select(id, time, amt) |>
  mutate(treatment = "16 mg/kg QW (first dose)")

conc_obj <- PKNCA::PKNCAconc(
  sim_first_week,
  Cc ~ time | treatment + id,
  concu = "mg/L", timeu = "hour"
)

dose_obj <- PKNCA::PKNCAdose(
  dose_first_week,
  amt ~ time | treatment + id,
  doseu = "mg"
)

intervals <- data.frame(
  start    = 0,
  end      = 7 * 24,
  cmax     = TRUE,
  tmax     = TRUE,
  auclast  = TRUE,
  cmin     = TRUE
)

nca_res <- PKNCA::pk.nca(PKNCA::PKNCAdata(conc_obj, dose_obj, intervals = intervals))
nca_tbl <- as.data.frame(nca_res$result)

knitr::kable(
  nca_tbl |>
    group_by(PPTESTCD) |>
    summarise(median = median(PPORRES, na.rm = TRUE), .groups = "drop"),
  digits = 3,
  caption = "Simulated NCA parameters for the typical-value first-dose interval (16 mg/kg, 3.4 h infusion)."
)| PPTESTCD | median |
|---|---|
| auclast | 27663.181 |
| cmax | 285.684 |
| cmin | 0.000 |
| tmax | 6.000 |
Comparison against published NCA
The PAGE abstract does NOT report NCA-style summary statistics (Cmax
/ Tmax / AUC / half-life) for the GEN501 + MMY2002 pooled population.
There is therefore no published NCA row to render in a
ncaComparisonTable() and no quantitative target to compare
against in this vignette. The reader can cross-check the simulated Cmax
/ AUClast ranges informally against the Xu 2020 vignette
(vignettes/articles/Xu_2020_daratumumab.Rmd), which reports
the analogous observed concentrations from the MMY1001 study.
Assumptions and deviations
-
Conference-abstract source. The model values come
from the PAGE 29
- abstract II-52, which is the sole source. No journal full text has been published. The abstract reports the eight structural typical values used here and the proportional RUV, but not (a) the inter-individual-variability magnitudes, (b) covariate coefficient values, or (c) reference covariate values for the typical patient.
- Errata – IIV omitted. The PAGE 29 abstract reports that body weight / albumin / myeloma type / sex were significant covariates and that a final TMDD/QSS model was selected by AIC, but does not publish any eta variances. The model therefore declares no etas. Simulating with the loaded model returns typical-value trajectories only. Per project convention, class-typical IIV magnitudes were NOT substituted.
-
Errata – covariate coefficients omitted. Four
significant covariate effects are reported in the abstract:
- Linear CL: body weight (WT), serum albumin (ALB), myeloma type (IgG vs non-IgG), and sex were each reported as covariates whose estimated 95% confidence interval did not cover zero.
- Central volume V1: body weight and sex.
covariateDatametadata for documentation, but the model body does NOT apply any of them. Per project convention, class-typical or Xu 2020-derived placeholder values were NOT substituted. When (or if) the parameter table is published, the placeholders should be replaced by the actual coefficients and themodel()body extended accordingly. - Errata – Kss units. The PAGE 29 abstract prints the QSS steady-state constant Kss with units “1/h”. In a Gibiansky 2008 QSS TMDD model, Kss = (koff + kint) / kon is a CONCENTRATION (mg/L), not a rate. The printed unit is treated as a typographical error in the abstract; the numerical value (1.79) is encoded here as mg/L, the canonical concentration unit consistent with the surrounding parameters (Ksyn in mg/L/h and the central concentration Cc in mg/L).
- Errata – V2 unit typo. The abstract prints V2 as “3.31 L/h”; V2 is the peripheral volume of distribution and is a VOLUME (L). The printed “L/h” is treated as a typographical error.
- Reference covariate values. The abstract does not state reference values for body weight, albumin, or any other continuous covariate. The virtual subject above uses a representative 72 kg body weight only to convert the per-kg dose amount into the absolute mg input the model requires; that value does not enter the typical-value PK parameters (no allometric scaling is applied in the model body for the reasons above).
-
Residual error. The abstract reports “RUV = 22.7%”,
consistent with a proportional residual-error parameterisation. The
model encodes this as
propSd = 0.227. -
Relationship to Xu 2020 daratumumab. The Xu 2020
model (
modellib('Xu_2020_daratumumab')) is the empirical 2-compartment parallel-linear + Michaelis-Menten model with mono-exponentially decaying Vmax, fitted to the MMY1001 D-Kd / D-KRd cohorts. The Li 2021 model is the mechanistic TMDD/QSS replacement, fitted to the GEN501 + MMY2002 monotherapy populations. They are not interchangeable; the two co-exist in nlmixr2lib as alternative structural parameterisations of daratumumab PK.