Permeability-limited lung PBPK for antituberculosis drugs (Gaohua 2015)
Source:vignettes/articles/Gaohua_2015_lung_pbpk.Rmd
Gaohua_2015_lung_pbpk.RmdModel and source
Gaohua and colleagues built a mechanistic, permeability-limited model of the lung and embedded it in a whole-body PBPK model in order to predict antituberculosis drug concentrations at the site of infection rather than only in plasma. The lung is divided into seven segments – the upper and lower airways plus the five lobes – and each segment carries four compartments: pulmonary capillary blood, tissue mass, fluid (mucus and epithelial lining fluid, ELF) and alveolar air. With the pulmonary blood reservoir and arterial blood that is the 21 + 2 ODE lung system written out in Supplementary Appendix S1.
Supplementary Table S2 gives complete compound files for three of the paper’s seven drugs, so those three are packaged here, one model file each:
mods <- c("Gaohua_2015_lung_pbpk_isoniazid",
          "Gaohua_2015_lung_pbpk_ethambutol",
          "Gaohua_2015_lung_pbpk_pyrazinamide")
ui <- lapply(mods, function(m) rxode2::rxode(readModelDb(m)))
names(ui) <- c("isoniazid", "ethambutol", "pyrazinamide")- Citation: Gaohua L, Wedagedera J, Small BG, Almond L, Romero K, Hermann D, Hanna D, Jamei M, Gardner I. Development of a Multicompartment Permeability-Limited Lung PBPK Model and Its Application in Predicting Pulmonary Pharmacokinetics of Antituberculosis Drugs. CPT Pharmacometrics Syst Pharmacol. 2015;4(10):605-613. doi:10.1002/psp4.12034. Reference physiology (cardiac output 356 L/h, lung volume 0.53 L, blood volume 5.75 L) is taken from the upstream full-body PBPK the Appendix defers to: Jamei M, Bajot F, Neuhoff S, Barter Z, Yang J, Rostami-Hodjegan A, Rowland-Yeo K. Clin Pharmacokinet. 2014;53:73-87, Electronic Supplementary Material 1 Tables S1-S3.
- Article: https://doi.org/10.1002/psp4.12034
- Supplement (Appendix S1 equations, Appendix S2 simulation designs, Tables S1-S2, Supplementary Figures 1-5): https://doi.org/10.1002/psp4.12034
The remaining four drugs (rifampicin, itraconazole, erythromycin, clarithromycin) were simulated from Simcyp’s proprietary default compound files. Only scattered parameters for those four are printed, so they are not packaged: extracting them would require substituting values that appear in no available source.
length(ui[["isoniazid"]]$state)
#> [1] 25
ui[["isoniazid"]]$state
#>  [1] "depot"         "lung_rt_fluid" "lung_rt_mass"  "lung_rt_blood"
#>  [5] "lung_rm_fluid" "lung_rm_mass"  "lung_rm_blood" "lung_rl_fluid"
#>  [9] "lung_rl_mass"  "lung_rl_blood" "lung_lt_fluid" "lung_lt_mass"
#> [13] "lung_lt_blood" "lung_ll_fluid" "lung_ll_mass"  "lung_ll_blood"
#> [17] "lung_la_fluid" "lung_la_mass"  "lung_la_blood" "lung_ua_fluid"
#> [21] "lung_ua_mass"  "lung_ua_blood" "lung_pbr"      "arterial"
#> [25] "central"
Population
These are virtual subjects generated by the Simcyp North European Caucasian population library, not enrolled participants; the paper’s clinical data (Supplementary Table S1) are the comparators, not the fitting set.
| Drug | Plasma verification | Lung simulation |
|---|---|---|
| Isoniazid | 140 subjects, 30-55 y, 42.9% female, 300 mg single dose; NAT2 EM:PM 0.286:0.714 | 800 subjects, 30-55 y, 50% female, 50:50 fast/slow acetylators, 300 mg QD x 5 |
| Ethambutol | 140 subjects, 25-60 y, 42.9% female, 25 mg/kg single dose | 400 subjects, 25-50 y, 50% female, 15 mg/kg QD x 5 |
| Pyrazinamide | 140 healthy volunteers, 20-50 y, 0% female, 1500 mg single dose | 400 subjects, 25-55 y, 50% female, 1000 mg QD x 5 |
Source trace
Every value in the three model files comes from one of the four locations below. The reference physiology is the one place the paper defers to an upstream publication: Appendix S1 states that “the equations describing concentrations in the rest of the full body PBPK model have been published previously (1)”, where reference 1 is Jamei et al. 2014.
| Quantity | Source |
|---|---|
| 21 lung ODEs + PBR + arterial + venous blood | Supplementary Appendix S1, eq 3-26 |
| Air:fluid partition coefficient K_AF = H / (R T) | Supplementary Appendix S1, eq 1-2 |
| Cardiac output 356 L/h; lung volume 0.53 L; blood volume 5.75 L, 66% venous | Jamei 2014 ESM1, Tables S1 and S3 |
| PBR 89 mL; ELF 25 mL; lung mass = lung - ELF - PBR | Methods, ‘Tissue volumes’ |
| PBR / mass / ELF split: 16.67% per lobe, remainder shared by UA and LA | Methods, ‘Tissue volumes’ |
| Alveolar air 5.6 L, split 3/19 RT, 2/19 RM, 5/19 RL, 4/19 LT, 5/19 LL | Methods, ‘Distribution of alveolar volume’ |
| Airway air volume 0.05 L each (UA, LA) | Methods, ‘Upper/lower airways’ |
| Blood flow: 8.6 / 11.8 / 31.0 / 8.6 / 34.9 / 5.0% of CO; UA 2.5% of arterial | Methods, ‘Blood flow rate’ |
| Ventilation: V/Q geometric mean 1.0; 14.9 / 12.4 / 25.9 / 14.8 / 32.0% | Methods, ‘Ventilation/perfusion distribution’ |
| Surface area: 140 m2 deep lung by alveolar volume; 1.5 m2 airways, 50:50 | Methods, ‘Absorption area’ |
| pH: fluid 6.6, mass 6.69, blood 7.4 | Methods, ‘pH’ |
| CLmet = 0; uptake and efflux transporter clearances = 0 (base case) | Methods, ‘Parameterization of the multicompartment lung model’ |
| Compound files: MW, logP, type, pKa, B/P, fu_p, fa, ka, Vss, CL_R | Supplementary Table S2 |
| Lung effective permeability, lung fu_mass, fu_fluid | Supplementary Table S2 |
| Raw Calu-3 / QSAR permeability and unionised fraction at pH 7.4 | Results, ‘Data sources for individual compounds’ |
| NAT2 relative activity 1 (EM) and 0.25 (PM); EM:PM frequency 0.286:0.714 | Supplementary Appendix S2 |
| Predicted mean plasma profiles (used to back-solve two clearances) | Supplementary Figure 2 (digitised) |
| Observed ELF / macrophage / plasma clinical comparators | Supplementary Table S1 |
Internal identities
Because the paper reports no IIV and no residual error, the strongest checks available are exact internal identities: quantities the paper prints twice, once as an input and once as a derived result. These do not depend on the systemic reduction at all, so they test the lung layer’s transcription directly.
Ionisation
The paper quotes the unionised fraction of each compound at pH 7.4 in “Data sources for individual compounds”. Reproducing those numbers from the Table S2 pKa values confirms both the pKa transcription and the compound-type assignment (monoprotic base / diprotic base / neutral).
fni_mono <- function(pKa, pH) 1 / (1 + 10^(pKa - pH))
fni_di <- function(pKa1, pKa2, pH) {
  1 / (1 + 10^(pKa1 - pH) + 10^(pKa1 + pKa2 - 2 * pH))
}

ion <- data.frame(
  Drug = c("Isoniazid", "Ethambutol", "Pyrazinamide"),
  Type = c("Monoprotic base (pKa 1.82)", "Diprotic base (pKa 9.55, 6.5)", "Neutral"),
  Modelled = c(fni_mono(1.82, 7.4), fni_di(9.55, 6.5, 7.4), 1),
  Published = c(0.999, 0.0062, 1)
)
ion$`Ratio` <- ion$Modelled / ion$Published
knitr::kable(ion, digits = 5,
caption = "Fraction unionised at pH 7.4: model vs the value the paper quotes.")| Drug | Type | Modelled | Published | Ratio |
|---|---|---|---|---|
| Isoniazid | Monoprotic base (pKa 1.82) | 1.00000 | 0.9990 | 1.00100 |
| Ethambutol | Diprotic base (pKa 9.55, 6.5) | 0.00625 | 0.0062 | 1.00783 |
| Pyrazinamide | Neutral | 1.00000 | 1.0000 | 1.00000 |
Lung effective permeability
Table S2’s “lung effective permeability” is defined as the raw in vitro or QSAR permeability divided by the unionised fraction at pH 7.4 (Methods, “Passive permeability estimates”: “The in vitro permeability data were divided by the unionized fraction of compound”). Both quantities are printed, so the division is checkable to the printed precision.
perm <- data.frame(
  Drug = c("Ethambutol", "Pyrazinamide"),
  `Raw permeability (cm/s)` = c(3.0e-7, 13.8e-7),
  `fni at pH 7.4` = c(fni_di(9.55, 6.5, 7.4), 1),
  `Table S2 (cm/s)` = c(0.479e-4, 0.0138e-4),
  check.names = FALSE
)
perm$`Derived (cm/s)` <- perm$`Raw permeability (cm/s)` / perm$`fni at pH 7.4`
perm$`% difference` <- 100 * (perm$`Derived (cm/s)` - perm$`Table S2 (cm/s)`) /
  perm$`Table S2 (cm/s)`
knitr::kable(perm, digits = 8,
caption = "Table S2 permeability recovered from the raw permeability and the ionisation.")| Drug | Raw permeability (cm/s) | fni at pH 7.4 | Table S2 (cm/s) | Derived (cm/s) | % difference |
|---|---|---|---|---|---|
| Ethambutol | 3.00e-07 | 0.00624857 | 4.79e-05 | 4.801e-05 | 0.2316588 |
| Pyrazinamide | 1.38e-06 | 1.00000000 | 1.38e-06 | 1.380e-06 | 0.0000000 |
Regional physiology closes
The regional splits are fractions and must sum to one (or, for the pulmonary blood flow, to the 99.9% the paper’s rounded percentages give).
fAlv <- c(RT = 3, RM = 2, RL = 5, LT = 4, LL = 5) / 19
fSeg <- c(rep(1 / 6, 5), 1 / 12, 1 / 12)
fq <- c(RT = .086, RM = .118, RL = .310, LT = .086, LL = .349, LA = .050)
fVent <- c(RT = .149, RM = .124, RL = .259, LT = .148, LL = .320)

stopifnot(
  abs(sum(fAlv) - 1) < 1e-12,
  abs(sum(fSeg) - 1) < 1e-12,
  abs(sum(fVent) - 1) < 1e-12,
  abs(sum(fq) - 0.999) < 1e-12
)

geom <- data.frame(
  Segment = c(names(fAlv), "LA", "UA"),
  `Blood (L)` = 0.089 * fSeg,
  `Mass (L)` = (0.53 - 0.025 - 0.089) * fSeg,
  `ELF (L)` = 0.025 * fSeg,
  `Air (L)` = c(5.6 * fAlv, 0.05, 0.05),
  `Surface area (m2)` = c(140 * fAlv, 0.75, 0.75),
  check.names = FALSE
)
knitr::kable(geom, digits = 4,
caption = "Regional lung geometry derived from the Methods splits.")| Segment | Blood (L) | Mass (L) | ELF (L) | Air (L) | Surface area (m2) |
|---|---|---|---|---|---|
| RT | 0.0148 | 0.0693 | 0.0042 | 0.8842 | 22.1053 |
| RM | 0.0148 | 0.0693 | 0.0042 | 0.5895 | 14.7368 |
| RL | 0.0148 | 0.0693 | 0.0042 | 1.4737 | 36.8421 |
| LT | 0.0148 | 0.0693 | 0.0042 | 1.1789 | 29.4737 |
| LL | 0.0148 | 0.0693 | 0.0042 | 1.4737 | 36.8421 |
| LA | 0.0074 | 0.0347 | 0.0021 | 0.0500 | 0.7500 |
| UA | 0.0074 | 0.0347 | 0.0021 | 0.0500 | 0.7500 |
Simulation
All simulations below are single typical-value solves at the reference 70 kg adult: the model carries no IIV and no residual error, so one subject per arm is the whole population.
WT_REF <- 70

solve_arm <- function(drug, dose, n_dose = 1, nat2_slow = NULL,
                      tmax = 24, by = 0.25, params = NULL) {
  ev <- rxode2::et(amt = dose, ii = 24, addl = n_dose - 1, cmt = "depot")
  ev <- rxode2::et(ev, seq(0, tmax, by = by), cmt = "central")
  dat <- as.data.frame(ev)
  dat$WT <- WT_REF
  if (!is.null(nat2_slow)) dat$NAT2_SLOW <- nat2_slow
  args <- list(object = ui[[drug]], events = dat, returnType = "data.frame",
               atol = 1e-8, rtol = 1e-8)
  if (!is.null(params)) args$params <- params
  out <- do.call(rxode2::rxSolve, args)
  out[!is.na(out$Cc), ]
}
Plasma: the systemic reduction against the paper’s own predictions
The paper’s Supplementary Figure 2 gives the predicted mean plasma profile for each of the three compounds. Those curves were digitised to give the reference Cmax / Tmax / AUC below. For isoniazid and pyrazinamide the non-renal clearance was back-solved from that same digitised AUC (see Errata), so their AUC agreement is fitted, not validation; their Cmax and Tmax, and every ethambutol row, are genuine comparisons.
sd_arms <- list(
  ethambutol   = solve_arm("ethambutol",   25 * WT_REF, tmax = 48),
  pyrazinamide = solve_arm("pyrazinamide", 1500,        tmax = 48)
)
#> Warning: 'ii' requires non zero additional doses ('addl') or steady state
#> dosing ('ii': 24.000000, 'ss': 0; 'addl': 0), reset 'ii' to zero
#> Warning: 'ii' requires non zero additional doses ('addl') or steady state
#> dosing ('ii': 24.000000, 'ss': 0; 'addl': 0), reset 'ii' to zero
inh_em <- solve_arm("isoniazid", 300, nat2_slow = 0, tmax = 24)
#> Warning: 'ii' requires non zero additional doses ('addl') or steady state
#> dosing ('ii': 24.000000, 'ss': 0; 'addl': 0), reset 'ii' to zero
inh_pm <- solve_arm("isoniazid", 300, nat2_slow = 1, tmax = 24)
#> Warning: 'ii' requires non zero additional doses ('addl') or steady state
#> dosing ('ii': 24.000000, 'ss': 0; 'addl': 0), reset 'ii' to zero

# Appendix S2: the isoniazid verification population was 0.286 EM : 0.714 PM.
sd_arms$isoniazid <- inh_em
sd_arms$isoniazid$Cc <- 0.286 * inh_em$Cc + 0.714 * inh_pm$Cc

sim_conc <- dplyr::bind_rows(lapply(names(sd_arms), function(d) {
  data.frame(id = 1L, treatment = d, time = sd_arms[[d]]$time,
             Cc = sd_arms[[d]]$Cc)
}))
ggplot(sim_conc, aes(time, Cc)) +
  geom_line(linewidth = 0.8) +
  facet_wrap(~treatment, scales = "free") +
  labs(x = "Time (h)", y = "Plasma concentration (mg/L)") +
  theme_bw()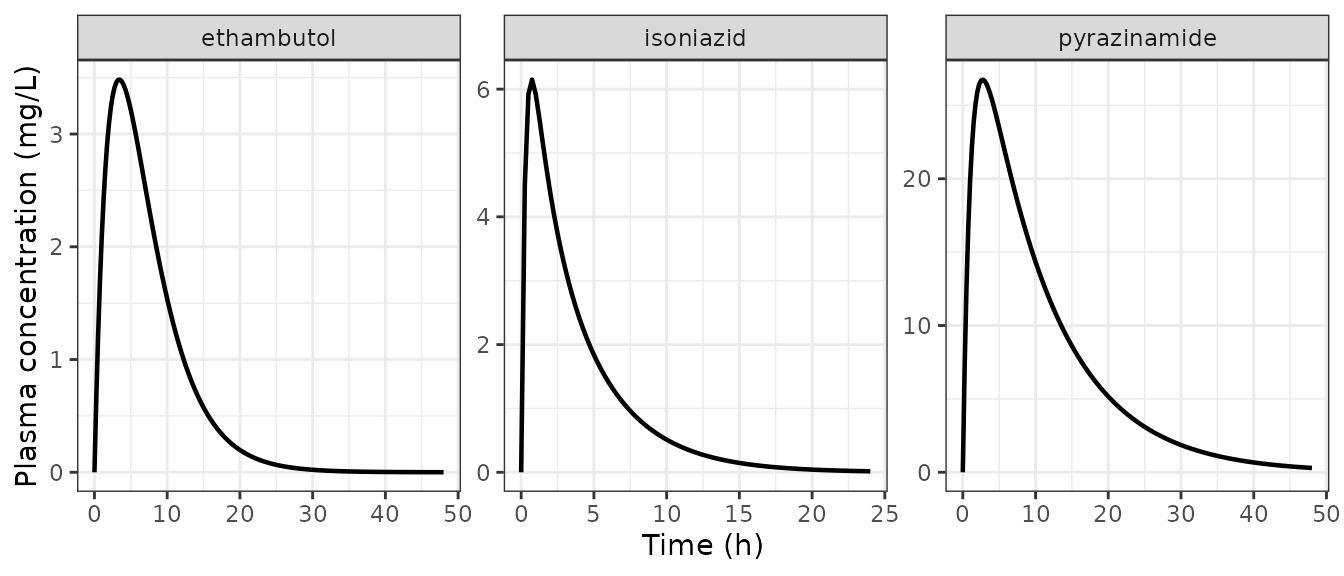
Replicates Supplementary Figure 2 of Gaohua 2015: predicted mean plasma concentrations after a single oral dose.
dose_df <- data.frame(
  id = 1L,
  treatment = c("ethambutol", "pyrazinamide", "isoniazid"),
  time = 0,
  amt = c(25 * WT_REF, 1500, 300)
)

conc_obj <- PKNCA::PKNCAconc(sim_conc, Cc ~ time | treatment + id,
                             concu = "mg/L", timeu = "h")
dose_obj <- PKNCA::PKNCAdose(dose_df, amt ~ time | treatment + id, doseu = "mg")
intervals <- data.frame(start = 0, end = Inf,
                        cmax = TRUE, tmax = TRUE, aucinf.obs = TRUE)
nca <- PKNCA::pk.nca(PKNCA::PKNCAdata(conc_obj, dose_obj, intervals = intervals))

# Digitised from Supplementary Figure 2 (mean simulated profile, thick black
# line). Figure-derived: read to about two significant figures.
published <- data.frame(
  treatment = rep(c("ethambutol", "pyrazinamide", "isoniazid"), each = 3),
  PPTESTCD  = rep(c("cmax", "tmax", "aucinf.obs"), 3),
  reference = c(3.6, 3.2, 22.0, 22.0, 2.2, 345.7, 6.4, 0.55, 26.1)
)

nca_tab <- as.data.frame(nca) |>
  dplyr::select(treatment, PPTESTCD, PPORRES) |>
  dplyr::left_join(published, by = c("treatment", "PPTESTCD")) |>
  dplyr::mutate(`% difference` = 100 * (PPORRES - reference) / reference) |>
  dplyr::rename(Drug = treatment, `NCA parameter` = PPTESTCD,
                Simulated = PPORRES, `Supp. Figure 2` = reference)
knitr::kable(nca_tab, digits = 3,
caption = "Simulated plasma NCA vs the digitised Supplementary Figure 2 mean profile. Isoniazid and pyrazinamide AUC are fitted, not validation.")| Drug | NCA parameter | Simulated | Supp. Figure 2 | % difference |
|---|---|---|---|---|
| ethambutol | cmax | 3.482 | 3.60 | -3.264 |
| ethambutol | tmax | 3.500 | 3.20 | 9.375 |
| ethambutol | tlast | 48.000 | NA | NA |
| ethambutol | clast.obs | 0.001 | NA | NA |
| ethambutol | lambda.z | 0.166 | NA | NA |
| ethambutol | r.squared | 1.000 | NA | NA |
| ethambutol | adj.r.squared | 1.000 | NA | NA |
| ethambutol | lambda.z.time.first | 46.250 | NA | NA |
| ethambutol | lambda.z.time.last | 48.000 | NA | NA |
| ethambutol | lambda.z.n.points | 8.000 | NA | NA |
| ethambutol | clast.pred | 0.001 | NA | NA |
| ethambutol | half.life | 4.181 | NA | NA |
| ethambutol | span.ratio | 0.419 | NA | NA |
| ethambutol | aucinf.obs | 33.336 | 22.00 | 51.529 |
| isoniazid | cmax | 6.149 | 6.40 | -3.929 |
| isoniazid | tmax | 0.750 | 0.55 | 36.364 |
| isoniazid | tlast | 24.000 | NA | NA |
| isoniazid | clast.obs | 0.015 | NA | NA |
| isoniazid | lambda.z | 0.252 | NA | NA |
| isoniazid | r.squared | 1.000 | NA | NA |
| isoniazid | adj.r.squared | 1.000 | NA | NA |
| isoniazid | lambda.z.time.first | 3.000 | NA | NA |
| isoniazid | lambda.z.time.last | 24.000 | NA | NA |
| isoniazid | lambda.z.n.points | 85.000 | NA | NA |
| isoniazid | clast.pred | 0.015 | NA | NA |
| isoniazid | half.life | 2.753 | NA | NA |
| isoniazid | span.ratio | 7.628 | NA | NA |
| isoniazid | aucinf.obs | 25.885 | 26.10 | -0.825 |
| pyrazinamide | cmax | 26.753 | 22.00 | 21.603 |
| pyrazinamide | tmax | 2.750 | 2.20 | 25.000 |
| pyrazinamide | tlast | 48.000 | NA | NA |
| pyrazinamide | clast.obs | 0.295 | NA | NA |
| pyrazinamide | lambda.z | 0.102 | NA | NA |
| pyrazinamide | r.squared | 1.000 | NA | NA |
| pyrazinamide | adj.r.squared | 1.000 | NA | NA |
| pyrazinamide | lambda.z.time.first | 3.000 | NA | NA |
| pyrazinamide | lambda.z.time.last | 48.000 | NA | NA |
| pyrazinamide | lambda.z.n.points | 181.000 | NA | NA |
| pyrazinamide | clast.pred | 0.297 | NA | NA |
| pyrazinamide | half.life | 6.807 | NA | NA |
| pyrazinamide | span.ratio | 6.611 | NA | NA |
| pyrazinamide | aucinf.obs | 345.650 | 345.70 | -0.014 |
The ethambutol row is the meaningful test of the systemic reduction, because ethambutol is the one compound whose total clearance (renal 25.55 + additional systemic 4.35 = 29.9 L/h) is fully published. Its Cmax and Tmax are reproduced within a few percent using nothing but Table S2 values.
emb <- nca_tab[nca_tab$Drug == "ethambutol", ]
stopifnot(
  abs(emb$`% difference`[emb$`NCA parameter` == "cmax"]) < 10,
  abs(emb$`% difference`[emb$`NCA parameter` == "tmax"]) < 20
)
Pyrazinamide’s Cmax runs about 20% high. That is the expected signature of the systemic reduction rather than a transcription error: the paper’s full PBPK has a distribution phase, so its apparent terminal volume exceeds Vss, whereas a one-compartment systemic model must use a single volume for both. Ethambutol escapes this because its absorption is rate-limiting (ka 0.25 /h is below its elimination rate constant), which masks any distribution phase.
Lung: ELF and tissue concentrations
This is the paper’s actual contribution, and the ratios below are the numbers it reports. Each arm is dosed once daily for five days and read 4 hours after the last dose, exactly as the clinical comparator studies sampled (Supplementary Table S1).
md <- list(
  isoniazid_fast = solve_arm("isoniazid", 300, n_dose = 5, nat2_slow = 0, tmax = 120),
  isoniazid_slow = solve_arm("isoniazid", 300, n_dose = 5, nat2_slow = 1, tmax = 120),
  ethambutol     = solve_arm("ethambutol", 15 * WT_REF, n_dose = 5, tmax = 120),
  pyrazinamide   = solve_arm("pyrazinamide", 1000, n_dose = 5, tmax = 120)
)

ratios_at <- function(s, t_obs = 4 * 24 + 4, lobe = "rl") {
  r <- s[which.min(abs(s$time - t_obs)), ]
  data.frame(`Plasma (mg/L)` = r$Cc,
             `ELF:plasma` = r[[paste0("Celf_", lobe)]] / r$Cc,
             `Mass:plasma` = r[[paste0("Cmass_", lobe)]] / r$Cc,
             check.names = FALSE)
}

lung <- dplyr::bind_rows(lapply(names(md), function(n)
  cbind(Arm = n, ratios_at(md[[n]]))))
lung$`Published prediction` <- c("0.8-1.2 (ELF)", "0.8-1.2 (ELF)",
                                 "2 (mass, mean)", "~1.4 (ELF)")
lung$`Observed` <- c("1.2 +/- 1.9 (ELF, fast)", "3.2 +/- 8.1 (ELF, slow)",
                     "1.1 (ELF); 18-48 (macrophage)", "22 +/- 12 (ELF); 0.83 (mass)")
knitr::kable(lung, digits = 3,
caption = "Right lower lobe ratios 4 h after the fifth daily dose, against the paper's own predictions (Discussion / Results) and the clinical comparators (Supplementary Table S1).")| Arm | Plasma (mg/L) | ELF:plasma | Mass:plasma | Published prediction | Observed |
|---|---|---|---|---|---|
| isoniazid_fast | 0.463 | 0.954 | 0.970 | 0.8-1.2 (ELF) | 1.2 +/- 1.9 (ELF, fast) |
| isoniazid_slow | 3.204 | 0.951 | 0.967 | 0.8-1.2 (ELF) | 3.2 +/- 8.1 (ELF, slow) |
| ethambutol | 2.084 | 4.799 | 8.092 | 2 (mass, mean) | 1.1 (ELF); 18-48 (macrophage) |
| pyrazinamide | 18.595 | 0.903 | 0.917 | ~1.4 (ELF) | 22 +/- 12 (ELF); 0.83 (mass) |
Isoniazid reproduces the paper’s headline lung result. The Discussion states that “the PBPK model predicted ELF:plasma ratios of 0.8-1.2 after dosing of isoniazid (300 mg)”; the packaged model gives 0.95 in both acetylator phenotypes.
inh_elf <- lung$`ELF:plasma`[grepl("isoniazid", lung$Arm)]
stopifnot(all(inh_elf > 0.8), all(inh_elf < 1.2))
Pyrazinamide reproduces both the lung-mass agreement and the ELF under-prediction. The paper reports “reasonable agreement” between the simulated lung-mass concentration and the observed 0.83 mass:plasma ratio, and a roughly 16-fold under-prediction of the observed ELF:plasma ratio of 22.
pza <- lung[lung$Arm == "pyrazinamide", ]
stopifnot(
  abs(pza$`Mass:plasma` - 0.83) / 0.83 < 0.25,   # observed 0.83 +/- 0.7
  22 / pza$`ELF:plasma` > 10                     # the paper's ~16-fold shortfall
)
Ethambutol does not. The packaged model gives ELF:plasma 4.8 and mass:plasma 8.1, against the paper’s stated predicted mass:plasma mean of 2 and an ELF:plasma that it describes as within 2.5-fold of the observed 1.1. This is a real, reproducible disagreement, and the next section localises it.
long <- dplyr::bind_rows(lapply(names(md), function(n) {
  s <- md[[n]]
  data.frame(Arm = n, time = s$time,
             Plasma = s$Cc, ELF = s$Celf_rl, Mass = s$Cmass_rl)
})) |>
  tidyr::pivot_longer(c(Plasma, ELF, Mass), names_to = "Compartment",
                      values_to = "conc")

ggplot(long, aes(time, conc, colour = Compartment)) +
  geom_line(linewidth = 0.7) +
  facet_wrap(~Arm, scales = "free_y", nrow = 1) +
  labs(x = "Time (h)", y = "Concentration (mg/L)") +
  theme_bw() +
  theme(legend.position = "bottom")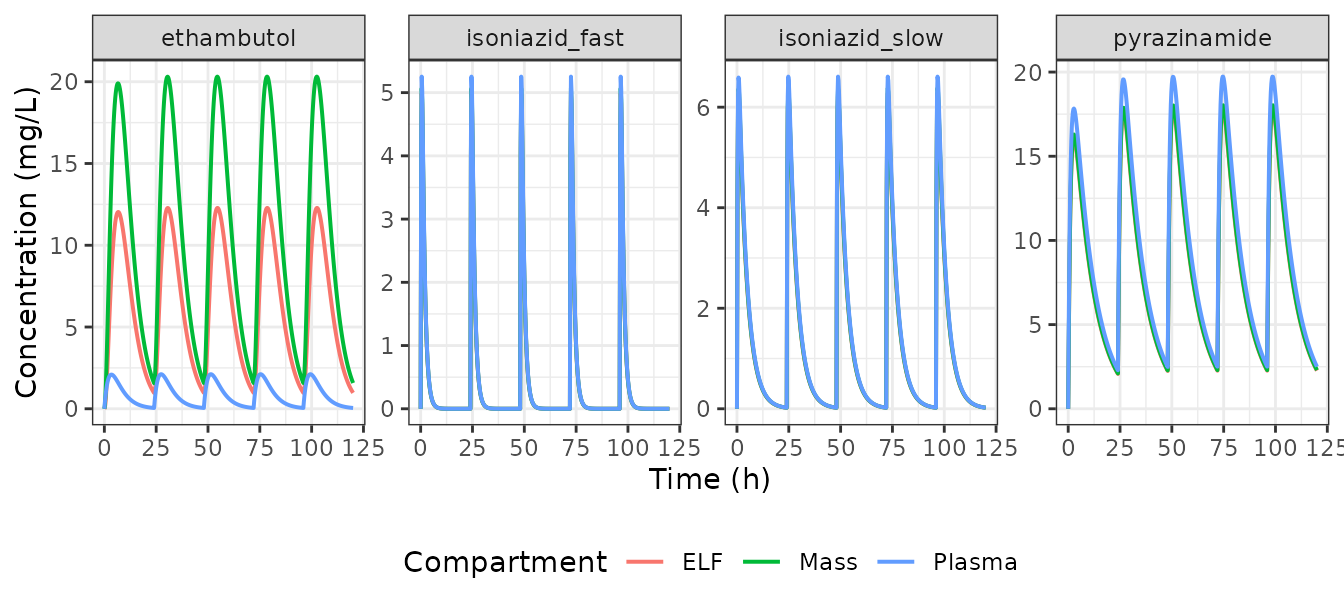
Plasma, ELF and lung-mass concentrations in the right lower lobe over five daily doses.
Where the ethambutol disagreement comes from
Appendix S1 requires two permeability-surface
products per segment: an apical one across the fluid-mass membrane
(CL_PD,FM) and a basal one across the mass-blood membrane
(CL_PD,MB). Table S2 publishes one “lung
effective permeability” per compound, and the Methods extrapolate it
using only the absorption surface areas – 140 m2 in the
deep lung, 1.5 m2 in the airways – which are air-facing, apical
surfaces. The paper never states what the basal surface is.
The packaged default sets the two equal
(ratioPdBasal = 1). That choice is invisible for isoniazid
and pyrazinamide, which have essentially no ionisation gradient between
blood (pH 7.4) and lung tissue (pH 6.69) and therefore sit at a
lung:plasma ratio near one however fast the membrane is. Ethambutol is a
diprotic base: its unionised fraction falls 7.5-fold from pH 7.4 to pH
6.69, so its equilibrium tissue:plasma ratio is large and how
far it gets toward equilibrium in four hours is set entirely by the
basal permeability.
scan_ratio <- function(drug, dose, nat2_slow = NULL) {
  vapply(c(1, 0.5, 0.2, 0.1, 0.05, 0.02), function(rb) {
    s <- solve_arm(drug, dose, n_dose = 5, nat2_slow = nat2_slow, tmax = 120,
                   by = 1, params = c(ratioPdBasal = rb))
    r <- s[which.min(abs(s$time - (4 * 24 + 4))), ]
    r$Cmass_rl / r$Cc
  }, numeric(1))
}

basal <- data.frame(
  `Basal:apical ratio` = c(1, 0.5, 0.2, 0.1, 0.05, 0.02),
  Isoniazid = scan_ratio("isoniazid", 300, nat2_slow = 0),
  Ethambutol = scan_ratio("ethambutol", 15 * WT_REF),
  Pyrazinamide = scan_ratio("pyrazinamide", 1000),
  check.names = FALSE
)
knitr::kable(basal, digits = 3,
caption = "Lung mass:plasma ratio 4 h after the fifth dose as the basal:apical permeability-surface ratio is reduced. The paper's predicted ethambutol value is 2.")| Basal:apical ratio | Isoniazid | Ethambutol | Pyrazinamide |
|---|---|---|---|
| 1.00 | 0.970 | 8.092 | 0.917 |
| 0.50 | 0.972 | 5.840 | 0.919 |
| 0.20 | 0.978 | 4.827 | 0.926 |
| 0.10 | 0.988 | 4.623 | 0.935 |
| 0.05 | 1.010 | 3.963 | 0.928 |
| 0.02 | 1.080 | 2.430 | 0.792 |
A basal permeability-surface product roughly 50-fold below the apical
one brings ethambutol onto the paper’s reported value while leaving
isoniazid inside its published 0.8-1.2 band and pyrazinamide close to
the observed 0.83. That is physiologically coherent – the alveolar
absorption surface is the air-facing side of the epithelium, not the
capillary side – but no available source gives a capillary surface area,
so it is not shipped as the default.
ratioPdBasal is exposed so the question can be explored
without editing the ODEs.
Mass balance
Nothing leaves this system except systemic clearance, so the amount still in the 25 states plus the amount cleared must equal the absorbed dose at all times. This is an exact identity and catches any sign or volume error in the ODE block.
s <- md$ethambutol
states <- ui$ethambutol$state
amount <- rowSums(s[, states, drop = FALSE])

# Total systemic clearance for ethambutol: renal 25.55 + additional 4.35 L/h.
cleared <- cumsum(c(0, diff(s$time) *
                      (head(29.9 * s$Cc, -1) + tail(29.9 * s$Cc, -1)) / 2))
absorbed <- 5 * 15 * WT_REF * 0.57   # 5 doses x 15 mg/kg x fa 0.57

balance <- (amount + cleared)[s$time == 120] / absorbed
balance
#>       481
#> 0.9995597
stopifnot(abs(balance - 1) < 0.01)
Assumptions and deviations
Structural deviation: the systemic side is reduced
The published model embeds this lung system in a Simcyp full PBPK
with twelve perfusion-limited tissue compartments. Those compartments
need per-tissue partition coefficients (Kp), which the
paper does not print for any of its seven drugs; the Rodgers and Rowland
tissue-composition tables needed to derive them sit one citation further
upstream and were not available when this model was built. The
systemic side is therefore reduced here to a single well-stirred
compartment carrying venous blood and all non-lung tissue, at
the compound file’s own Vss, ka, fa and clearance, with arterial blood
and the whole lung layer solved exactly as published.
The reduction was tested before being adopted, not assumed:
- The upper bound on a one-compartment volume,
Dose x fa / Cmax, exceeds the published Vss for all three compounds (ethambutol 3.1x, pyrazinamide 1.6x, isoniazid 1.3x). A reduction is falsified when that ratio is far below one, which would mean the drug is genuinely multi-compartmental at the plasma level; these are small hydrophilic drugs with Vss of 0.46-1.23 L/kg, at or below total body water. - The reduction reproduces the paper’s own predicted ethambutol Cmax and Tmax to within a few percent (table above), using only published values.
Its cost is visible in the pyrazinamide Cmax (about 20% high) and, more mildly, in the isoniazid Tmax: neither can carry a distribution phase.
Two clearances are figure-derived, not published
Supplementary Table S2 reports the metabolic route for isoniazid and
pyrazinamide as CLu,int in uL/min/mg
cytosolic protein. Converting that to L/h requires
CPPGL (cytosolic protein per gram liver), which appears in no available
source – the Jamei 2014 ESM supplies MPPGL, a microsomal
factor, which is the wrong subcellular fraction. Both non-renal
clearances were therefore back-solved from the AUC of the paper’s own
predicted mean plasma profile (Supplementary Figure 2), which fixes
total clearance exactly and independently of compartmental
structure:
- Pyrazinamide: digitised AUCinf 345.7 mg*h/L gives total CL 3.47 L/h; minus the published renal 0.11 L/h gives a non-renal 3.36 L/h.
- Isoniazid: digitised AUCinf 26.1 mg*h/L gives a population-average CL of 11.5 L/h; combined with the published NAT2 relative activity (1 in extensive metabolisers, 0.25 in poor) and the published 0.286:0.714 frequency, this gives a non-renal clearance of 26.1 L/h in an extensive metaboliser.
These are marked as figure-derived on the parameter lines and must not be used as validation targets. Ethambutol is unaffected: its clearance is fully published. The CPPGL gap is logged for acquisition.
Ethambutol lung penetration is over-predicted
Quantified in the section above. The shipped
ratioPdBasal = 1 (apical and basal permeability-surface
products equal) is the reading most consistent with Table S2 publishing
a single permeability and the Methods describing a single in vitro-in
vivo extrapolation, and it was the ratified choice. It gives ethambutol
ELF:plasma 4.8 and mass:plasma 8.1 against the paper’s reported
mass:plasma of 2 and an ELF:plasma within 2.5-fold of the observed 1.1.
The sensitivity scan localises the discrepancy to this single
assumption.
Alveolar air carries no drug
K_AF = H / (R T) (Appendix S1 eq 1) needs Henry’s
constant, which the paper says was “predicted using a QSAR approach” but
never prints for any compound. All three compounds here are non-volatile
crystalline solids, for which H -> 0 and therefore
K_AF -> 0: the alveolar-air compartment holds no drug,
the effective fluid volume V_AF collapses to
V_F, and the ventilation terms of equations 3, 21 and 24
drop out. kaf is shipped as a parameter fixed at zero so
the ventilation limb can be switched on for a volatile compound.
Smaller items
-
Reference individual. The regional physiology
(cardiac output 356 L/h, lung 0.53 L, blood 5.75 L) is the Simcyp
reference adult of the Jamei 2014 ESM, an 81 kg male. Vss is reported in
L/kg and is scaled by
WT; the vignette uses 70 kg, which is what reproduces the paper’s predicted ethambutol profile. Clearance and the lung physiology are absolute values and are not weight-scaled – the paper reports no allometric relationship. -
Arterial blood is counted twice, once inside
vc(which is the whole published Vss) and once as its own 1.955 L state. The overlap is 2-6% of Vss depending on the compound. -
First-pass extraction is folded into
fa. The reduced model absorbs into the systemic compartment directly, sof(depot)is the Table S2fawith no separateFgorFhterm. For these compounds hepatic extraction is under 5%. -
No IIV and no residual error. The paper reports
none;
addSdis fixed at zero so the model remains solvable by nlmixr2 without inventing a variance. The population variability in the paper’s figures comes from the Simcyp population library, which is not reproducible from the available sources. -
Recovered-equation typo. The pulmonary blood
reservoir equation (Appendix S1 eq 6) prints
C_RLBinside the RM, RT and LT terms. That is an artefact of decoding the supplement’s embedded equation objects; each segment returns its own blood concentration, which is what the model implements. -
Transporters and lung metabolism are off.
clMet,clUptakeFm,clEffluxFm,clUptakeMbandclEffluxMbare all fixed at zero, which is the paper’s base case. They are exposed so the published sensitivity analyses (efflux 0, 0.06, 0.6, 6, 60 L/h in Figure 5; uptake 0, 0.6, 60 L/h in Supplementary Figure 4) can be reproduced.