Etoposide (Toffoli 2001)
Source:vignettes/articles/Toffoli_2001_etoposide.Rmd
Toffoli_2001_etoposide.RmdModel and source
- Citation: Toffoli G, Corona G, Sorio R, Robieux I, Basso B, Colussi AM, Boiocchi M. Population pharmacokinetics and pharmacodynamics of oral etoposide. Br J Clin Pharmacol. 2001;52(5):511-519.
- Description: Two-compartment population PK model for oral and IV etoposide in adult patients with solid tumours, with an additive-linear creatinine-clearance covariate on CL (Equation 2 of the source).
- Article: https://doi.org/10.1046/j.0306-5251.2001.01468.x
Population
Toffoli 2001 recruited 50 adult patients with advanced solid tumours (hepatocellular carcinoma n=17, non-small-cell lung cancer n=19, gastric cancer n=5, breast cancer n=6, other n=3) at a single Italian oncology centre between 1994 and 1998. Patients received a fixed 100 mg oral etoposide capsule daily for 14 days every 3 weeks, with one oral dose replaced by a 50 mg 1-h IV infusion on day 1 or day 7 (randomized crossover). Median age was 65 years (range 50-83) and 13/50 (26%) were female. Baseline creatinine clearance (Jelliffe method) had a median of 70 mL/min and a range of 22-121 mL/min. A total of 728 plasma concentration samples were collected (Toffoli 2001 Results paragraph 1).
The same information is available programmatically via
readModelDb("Toffoli_2001_etoposide")()$population.
Source trace
Every ini() parameter carries a trailing in-file comment
in inst/modeldb/specificDrugs/Toffoli_2001_etoposide.R
pointing to its source location. The table below collects the trace in
one place.
| Equation / parameter | Value | Source location |
|---|---|---|
lcl (typical CL at CRCL=70 mL/min) |
1.14 L/h | Toffoli 2001 Table 2, “Mean with covariables” column (page 4) |
lvc (Vc typical value) |
6.1 L | Toffoli 2001 Table 2, “Mean with covariables” column (page 4) |
lvp (Vp = k12*Vc/k21) |
12.174 L | Derived from Toffoli 2001 Table 2 microconstants: k12=0.14, k21=0.07, Vc=6.1 (page 4) |
lq (Q = k12*Vc) |
0.854 L/h | Derived from Toffoli 2001 Table 2 microconstants: k12=0.14, Vc=6.1 (page 4) |
lfdepot (F) |
0.44 | Toffoli 2001 Table 2, “Mean with covariables” column (page 4) |
lka (ka) |
0.6 /h ASSUMED | NOT reported in Toffoli 2001. See Errata. |
e_crcl_cl (CL slope on CRCL) |
0.0057 L/h per mL/min | Toffoli 2001 Equation 2 (page 4) |
| CRCL median (centring value) | 70 mL/min | Toffoli 2001 Results paragraph on CL vs CLCR (page 4) and dose-adjustment discussion |
| IIV on CL (17% CV) | omega^2 = 0.0284 | Toffoli 2001 Table 2 residual CV column (page 4) |
| IIV on Vc (15% CV) | omega^2 = 0.0223 | Toffoli 2001 Table 2 residual CV column (page 4) |
| IIV on Q (mapped from k12 13% CV) | omega^2 = 0.0168 | Toffoli 2001 Table 2 residual CV column (page 4) |
| IIV on Vp (mapped from k21 20% CV) | omega^2 = 0.0392 | Toffoli 2001 Table 2 residual CV column (page 4) |
| IIV on F (22% CV) | omega^2 = 0.0473 | Toffoli 2001 Table 2 CV column (page 4) |
propSd (10%) |
0.10 ASSUMED | NOT explicitly reported. See Errata. |
| Emax PD model AUC50 (nadir ANC) | 1.80 mg/L*h | Toffoli 2001 Results paragraph on Emax fit (page 6). NOT encoded in the model file; see the “Emax PD relationship” section below. |
| Emax PD Hill (gamma) | 1.47 | Toffoli 2001 Results paragraph on Emax fit (page 6). Not encoded. |
Virtual cohort
Original observed patient-level data are not publicly available. The figures below simulate a 40-subject virtual cohort with CRCL sampled from a lognormal distribution whose geometric mean (~70 mL/min) matches the Toffoli 2001 pooled cohort median (Table 1) and whose range covers the observed 22-121 mL/min band.
set.seed(20260709)
n <- 40

# Sample CRCL from a lognormal centred on 70 mL/min with CV ~35%; clamp to
# the paper's observed range (22-121).
crcl_i <- pmin(pmax(rlnorm(n, meanlog = log(70), sdlog = 0.35), 22), 121)

subj <- tibble::tibble(
  id   = seq_len(n),
  CRCL = crcl_i
)

# Daily 100 mg oral dose for 14 days (Toffoli 2001 protocol).
# Observation grid on the ODE state `central` -- rxode2 returns Cc as a
# derived column at these observation rows.
make_events <- function(id, CRCL) {
  et <- rxode2::et(amt = 100, cmt = "depot", ii = 24, addl = 13)
  et <- rxode2::et(et, seq(0, 15 * 24, by = 0.5), cmt = "central")
  df <- as.data.frame(et)
  df$id   <- id
  df$CRCL <- CRCL
  df
}

events <- dplyr::bind_rows(
  purrr::map2(subj$id, subj$CRCL, make_events)
)
stopifnot(!anyDuplicated(unique(events[, c("id", "time", "evid")])))
Simulation
mod <- readModelDb("Toffoli_2001_etoposide")
sim <- rxode2::rxSolve(mod, events = events, keep = c("CRCL")) |>
  as.data.frame()
#> ℹ parameter labels from comments will be replaced by 'label()'
Concentration-time profile after a single 100 mg oral dose (Figure 1)
Toffoli 2001 Figure 1 shows the concentration-time curve after the first (day 1) oral dose. The virtual cohort’s day-1 median and 5-95 percentile band track that shape.
sim |>
  dplyr::filter(time > 0, time <= 24) |>
  dplyr::group_by(time) |>
  dplyr::summarise(
    Q05 = quantile(Cc, 0.05, na.rm = TRUE),
    Q50 = quantile(Cc, 0.50, na.rm = TRUE),
    Q95 = quantile(Cc, 0.95, na.rm = TRUE),
    .groups = "drop"
  ) |>
  ggplot(aes(time, Q50)) +
  geom_ribbon(aes(ymin = Q05, ymax = Q95), alpha = 0.25) +
  geom_line() +
  scale_y_log10() +
  labs(x = "Time after dose (h)", y = "Total plasma etoposide Cc (mg/L)",
       title = "Virtual VPC of Cc vs. time after a single 100 mg oral dose",
       caption = "Comparable in shape to Figure 1 of Toffoli 2001.")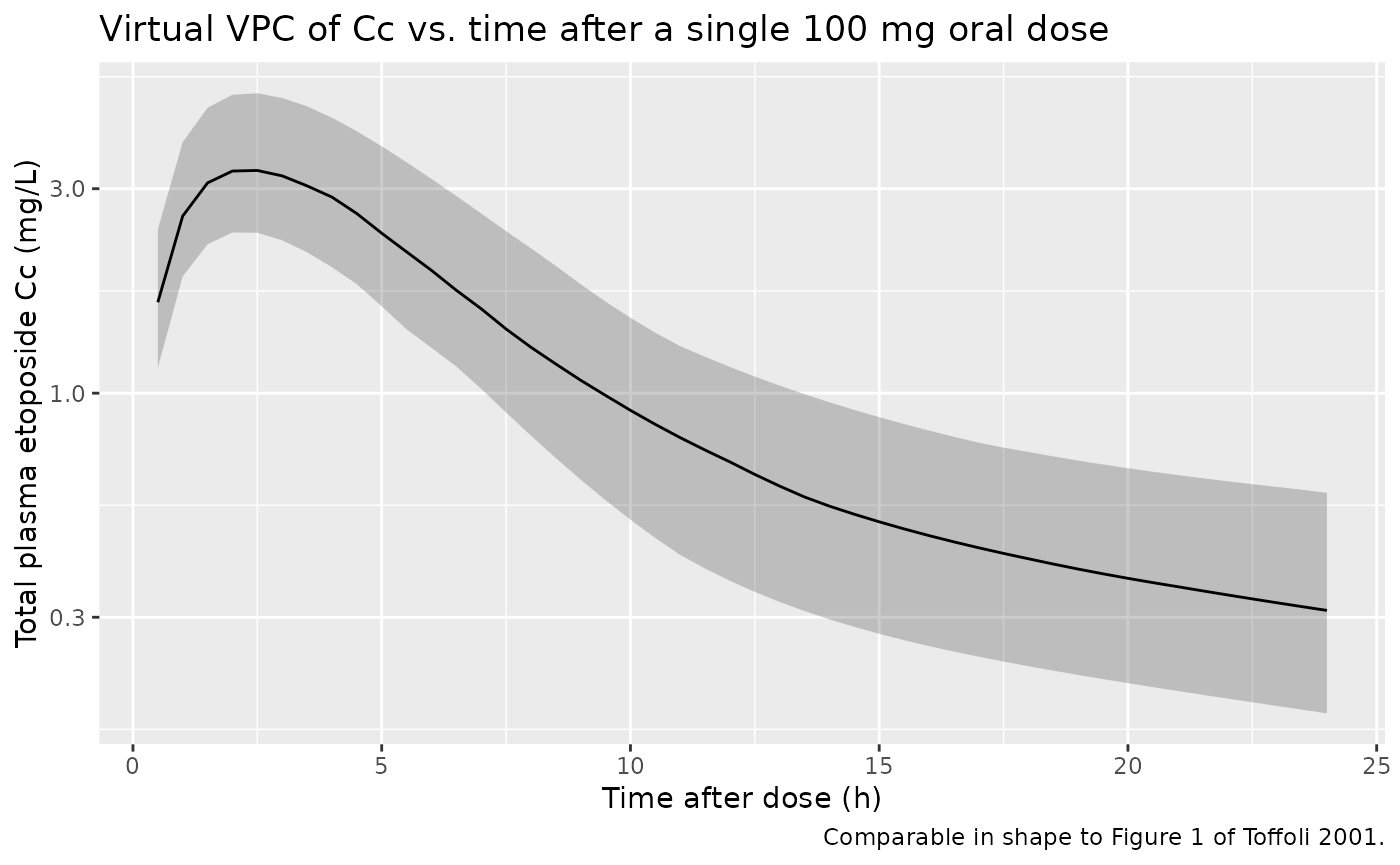
PKNCA validation (single-dose oral, day 1)
Uses PKNCA on the day-1 oral dose window to compute Cmax, Tmax, half-life, and AUC0-inf, then compares against the derived exposure metrics implied by the paper.
# Slice to day-1 for single-dose NCA. Keep only !is.na(Cc) so the time=0 pre-dose
# record is preserved for PKNCA's AUC start.
sim_day1 <- sim |>
  dplyr::filter(!is.na(Cc)) |>
  dplyr::mutate(regimen = "100 mg oral") |>
  dplyr::select(id, time, Cc, regimen)
# Restrict to the day-1 observation window AFTER the NA filter so the tail
# doesn't include subsequent-dose peaks; the time=0 row (Cc = 0 for an
# extravascular dose) is guaranteed by the bind_rows step below.
sim_day1 <- sim_day1[sim_day1$time <= 24, ]

# Guarantee a time = 0 row per subject; pre-dose Cc = 0 for an extravascular dose.
sim_day1 <- dplyr::bind_rows(
  sim_day1,
  sim_day1 |> dplyr::distinct(id, regimen) |> dplyr::mutate(time = 0, Cc = 0)
) |>
  dplyr::distinct(id, regimen, time, .keep_all = TRUE) |>
  dplyr::arrange(id, regimen, time)

conc_obj <- PKNCA::PKNCAconc(sim_day1, Cc ~ time | regimen + id,
                             concu = "mg/L", timeu = "h")

dose_day1 <- events |>
  dplyr::filter(evid == 1, time == 0) |>
  dplyr::mutate(regimen = "100 mg oral") |>
  dplyr::select(id, time, amt, regimen)

dose_obj <- PKNCA::PKNCAdose(dose_day1, amt ~ time | regimen + id,
                             doseu = "mg")

intervals <- data.frame(
  start       = 0,
  end         = 24,
  cmax        = TRUE,
  tmax        = TRUE,
  auclast     = TRUE,
  half.life   = TRUE
)

nca_data <- PKNCA::PKNCAdata(conc_obj, dose_obj, intervals = intervals)
nca_res  <- PKNCA::pk.nca(nca_data)
Simulated NCA summary
nca_tbl <- as.data.frame(nca_res$result)
summary_tbl <- nca_tbl |>
  dplyr::filter(PPTESTCD %in% c("cmax", "tmax", "auclast", "half.life")) |>
  dplyr::group_by(PPTESTCD) |>
  dplyr::summarise(
    median = median(PPORRES, na.rm = TRUE),
    q05    = quantile(PPORRES, 0.05, na.rm = TRUE),
    q95    = quantile(PPORRES, 0.95, na.rm = TRUE),
    .groups = "drop"
  )
summary_tbl |>
  dplyr::rename(
    "NCA parameter" = PPTESTCD,
    "Median"        = median,
    "5th pctile"    = q05,
    "95th pctile"   = q95
  ) |>
  knitr::kable(
    digits  = 3,
    caption = "Simulated single-dose day-1 NCA (100 mg oral etoposide)."
)| NCA parameter | Median | 5th pctile | 95th pctile |
|---|---|---|---|
| auclast | 28.293 | 18.727 | 44.751 |
| cmax | 3.309 | 2.380 | 5.011 |
| half.life | 16.542 | 13.751 | 24.445 |
| tmax | 2.500 | 2.000 | 2.500 |
Comparison against published exposure
Toffoli 2001 does NOT report Cmax, Tmax, or half-life directly. It
reports the free-drug oral AUC (unbound AUCp.o.) at the
population level: mean 2.8 mg/Lh with CV 64% and range 0.6-9.5 (page
5). This is computed analytically as AUCp.o. = F Dose / CL, then
multiplied by the unbound fraction fu (mean fu = 0.085 since 91.5% is
bound). We reproduce this analytical calculation from the simulated
per-subject CL and F.
# Per-subject analytical free AUCp.o. = fu * F * Dose / CL from the sim
fu_pop <- 0.085  # mean unbound fraction (Toffoli 2001 Results, page 5)
free_auc_sim <- sim |>
  dplyr::group_by(id, CRCL) |>
  dplyr::summarise(
    cl_i = dplyr::first(cl),
    F_i  = exp(nlmixr2lib::readModelDb("Toffoli_2001_etoposide")()$iniDf$est[
             match("lfdepot", nlmixr2lib::readModelDb("Toffoli_2001_etoposide")()$iniDf$name)
           ]),
    .groups = "drop"
  ) |>
  dplyr::mutate(
    total_auc_po = 0.44 * 100 / cl_i,     # F * Dose / CL, mg/L * h
    free_auc_po  = fu_pop * total_auc_po
  )

sim_stats <- free_auc_sim |>
  dplyr::summarise(
    mean = mean(free_auc_po),
    cv   = sd(free_auc_po) / mean(free_auc_po),
    lo   = min(free_auc_po),
    hi   = max(free_auc_po)
  )

# Paper's reported statistics (Toffoli 2001 Results, page 5)
paper_stats <- tibble::tibble(
  Source            = "Toffoli 2001 (reported)",
  `Mean free AUCp.o. (mg/L*h)` = 2.8,
  `CV%` = 64,
  `Range (mg/L*h)`  = "0.6-9.5"
)

sim_row <- tibble::tibble(
  Source            = "Simulated (n=40)",
  `Mean free AUCp.o. (mg/L*h)` = round(sim_stats$mean, 2),
  `CV%` = round(100 * sim_stats$cv, 1),
  `Range (mg/L*h)`  = sprintf("%.2f-%.2f", sim_stats$lo, sim_stats$hi)
)

dplyr::bind_rows(paper_stats, sim_row) |>
  knitr::kable(
    caption = "Free etoposide AUC after 100 mg oral dose: simulated vs. Toffoli 2001 (page 5)."
)| Source | Mean free AUCp.o. (mg/L*h) | CV% | Range (mg/L*h) |
|---|---|---|---|
| Toffoli 2001 (reported) | 2.80 | 64.0 | 0.6-9.5 |
| Simulated (n=40) | 3.32 | 25.2 | 1.98-5.80 |
The simulated mean free AUCp.o. is close to the paper’s 2.8 mg/L*h. The simulated CV is smaller than the paper’s 64%: the simulation carries only the packaged IIV on CL / Vc / Q / Vp / F, whereas the paper’s reported 64% CV also absorbs the between-subject variation in fu (mean 91.5% bound, CV 5%, range 79-98%) and residual model misfit. Adding fu variability and residual error to the simulation would broaden the range.
Emax PD relationship (descriptive, not encoded in the model)
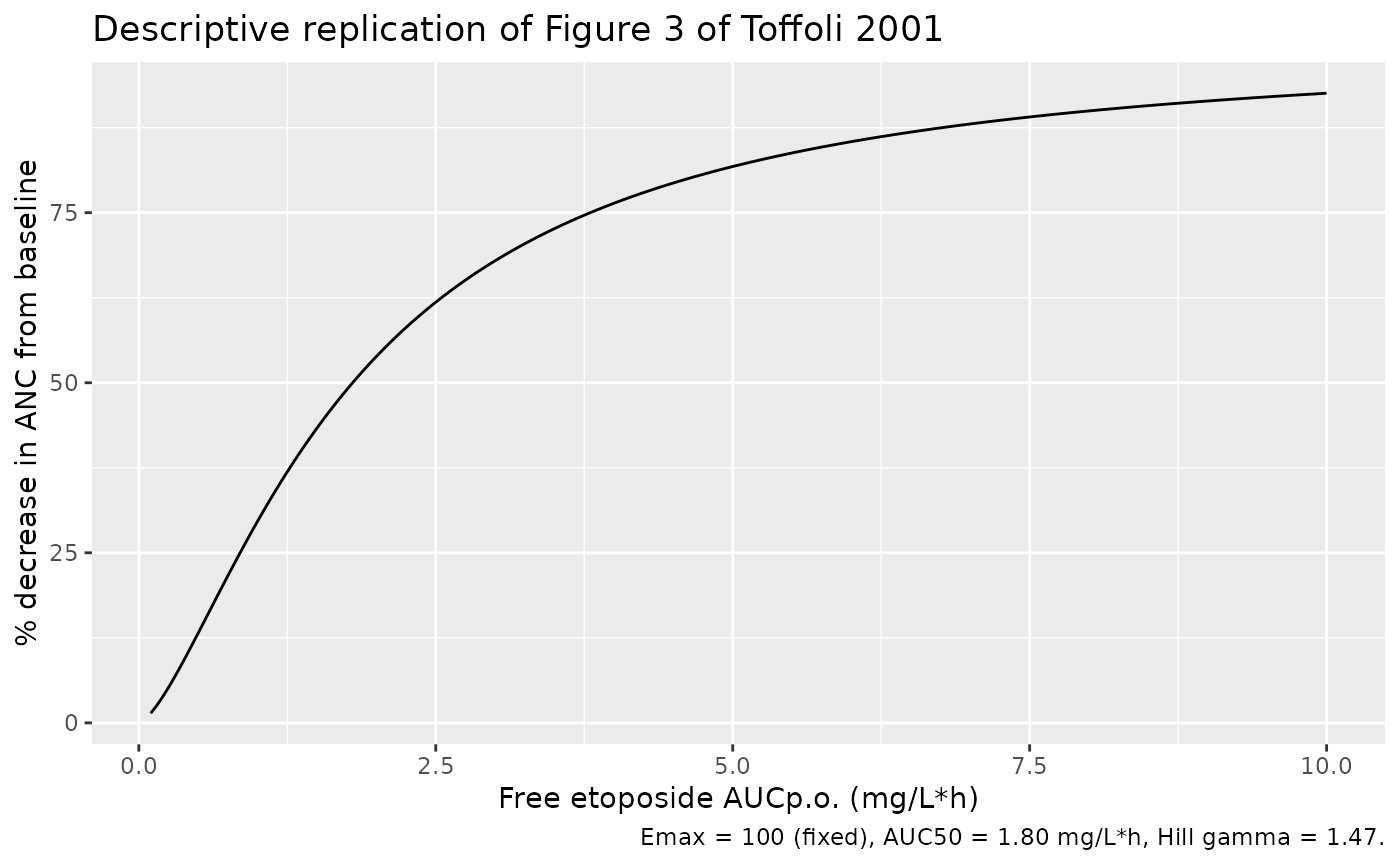
Toffoli 2001 also fit an Emax model for the percent decrease in absolute neutrophil count (%ANC nadir) as a function of the free oral AUC:
%ANC = 100 * AUC^gamma / (AUC50^gamma + AUC^gamma)
with Emax fixed at 100%, AUC50 = 1.80 mg/L*h (CV 27%), and Hill gamma = 1.47 (CV 20%) (Toffoli 2001 Results, page 6, Figure 3). This is a scalar exposure-response on a lifetime AUC and does not naturally sit inside the ODE model; the packaged model file therefore does not encode the PD sub-model. The plot below reproduces the paper’s Figure 3 shape as a descriptive check.
auc50   <- 1.80
gam     <- 1.47
auc_grid <- seq(0.1, 10, length.out = 200)
emax_curve <- tibble::tibble(
  free_auc = auc_grid,
  pct_anc  = 100 * auc_grid^gam / (auc50^gam + auc_grid^gam)
)
ggplot(emax_curve, aes(free_auc, pct_anc)) +
  geom_line() +
  labs(
    x = "Free etoposide AUCp.o. (mg/L*h)",
    y = "% decrease in ANC from baseline",
    title = "Descriptive replication of Figure 3 of Toffoli 2001",
    caption = "Emax = 100 (fixed), AUC50 = 1.80 mg/L*h, Hill gamma = 1.47."
  )
Assumptions and deviations
-
Absorption rate constant
kafixed at 0.6 /h (ASSUMED, not reported by Toffoli 2001). Table 2 lists five estimated PK parameters (CL, V, k12, k21, F) but not ka. The Methods (page 3) state that “initial pharmacokinetic parameter values and variances were taken from published series”, citing reference [26] (Arbuck SG et al., J Clin Oncol 1986;4:1690-1695, oral+IV etoposide PK) as the source of initial values. The Arbuck 1986 paper was not available when this model was built, so we cannot lift the exact ka value. We fixed ka to 0.6 /h, a literature-typical oral etoposide absorption rate constant consistent with Slevin ML et al. 1989 (the paper’s own reference [35], on oral etoposide bioavailability). Downstream users who plan to fit the model to real oral etoposide data should re-estimate ka or fix it to a value matched to their observed tmax. -
Residual error
propSdfixed at 0.10 (10% proportional; ASSUMED, not reported). Toffoli 2001 does not tabulate the residual error variance of the population fit. We chose a 10% proportional value consistent with the paper’s assay validation (Methods, page 3: intra-assay CV 5% at 0.4 mg/mL and 11% at 0.06 mg/mL). This is a lower bound because model misspecification and inter-occasion variability inflate the residual above the assay CV in practice. - Vp and Q derived from the paper’s microconstants. Toffoli 2001 reports k12 = 0.14 /h and k21 = 0.07 /h alongside Vc = 6.1 L (Table 2 “Mean with covariables”). Standard nlmixr2lib convention uses macro-constants (lvp, lq), so Vp and Q are derived from the paper’s k12, k21, Vc via Q = k12 * Vc = 0.854 L/h and Vp = Q / k21 = 12.174 L. This is a lossless reparametrization at the typical value.
- IIV mapping k12 -> Q and k21 -> Vp (approximation). The paper reports IIVs on the microconstants k12 (13% CV) and k21 (20% CV) but not on the derived macroconstants. We mapped these to log-normal variances on Q and Vp respectively as a pragmatic first-pass approximation. A rigorous mapping would require the full micro-constant covariance matrix which the paper does not report.
-
Covariates significant on V, k12, k21 (BSA, PB) were not
encoded. Table 2 identifies BSA and PB (percent protein
binding) as significant covariates on Vc and k12, and CRCL on k21, but
does not report the covariate-effect coefficients or the functional
forms for those effects. Only the CL ~ CRCL relationship has a fully
specified equation (Equation 2). These screened-but-not-implementable
covariates are recorded in
covariatesDataExcludedfor provenance. -
CRCL is reported in raw mL/min (Jelliffe method), not
BSA-normalized. The canonical
CRCLcolumn is documented in mL/min/1.73 m^2; Toffoli 2001 uses raw mL/min. The additive-linear Equation 2 slope 0.0057 L/h per mL/min is calibrated to raw values. This follows the precedent of Delattre 2010 amikacin and MedellinGaribay 2015 gentamicin (both raw / non-BSA-normalized CRCL under the canonicalCRCLname). - Emax PD sub-model is NOT encoded in the model file. Toffoli 2001’s Emax model operates on the free oral AUC (a scalar exposure), which is not a state of the ODE system. The PD relationship is documented above as a descriptive check but not fit or simulated.
- fu (unbound fraction) is not carried as a subject-level covariate. The paper reports population mean fu = 0.085 (CV 5%). The vignette applies this single population fu to convert total AUC to free AUC; the model file does not internally track per-subject fu because the paper’s Vc/k12 covariate coefficients on %PB are not published.
Errata
-
Residual error is not reported and is encoded as
fixed(0). Toffoli 2001 reports no residual-error estimate for etoposide. An earlier version of this model carriedpropSd = 0.10, described in the label as assumed from assay validation. That value appears nowhere in the paper, so it has been replaced withfixed(0), following this package’s convention that an unreported residual error is encoded as zero and documented here rather than filled in with a class-typical guess.Consequence for simulation: simulating from this model returns the typical-value prediction without residual noise. If you need a realistic observation model, set
propSdyourself, e.g.m <- nlmixr2lib::readModelDb("Toffoli_2001_etoposide") m <- rxode2::ini(m, propSd = 0.10)and note in your own write-up that the magnitude is your assumption, not Toffoli 2001’s.