Lamivudine (Archary 2019)
Source:vignettes/articles/Archary_2019_lamivudine.Rmd
Archary_2019_lamivudine.RmdModel and source
- Citation: Archary M, McIlleron H, Bobat R, LaRussa P, Sibaya T, Wiesner L, Hennig S. Population pharmacokinetics of abacavir and lamivudine in severely malnourished human immunodeficiency virus-infected children in relation to treatment outcomes. Br J Clin Pharmacol. 2019;85(8):1881-1890. doi:10.1111/bcp.13998
- Description: One-compartment population PK model for lamivudine in severely malnourished HIV-infected children (Archary 2019); CL/F matures with age via a sigmoid Emax function, Vc/F decreases linearly with serum triglyceride, and ka steps up between day 1 and day 14 of antiretroviral treatment
- Article: https://doi.org/10.1111/bcp.13998
This is the lamivudine half of the paired Archary
2019 extraction; the abacavir half is in
Archary_2019_abacavir.
Population
Archary 2019 reports a population PK analysis of oral lamivudine in 75 severely malnourished, HIV-infected paediatric inpatients (age 0.1-10.8 years, median 1.4 years; weight 1.88-19.6 kg, median 7 kg) admitted to King Edward VIII Hospital, Durban, South Africa as part of the MATCH (Malnutrition and ART Timing in Children with HIV) trial (PACTR201609001751384). Patients were randomized to early ART (within 14 days of admission, before nutritional recovery) or delayed ART (after nutritional recovery). The lamivudine analysis used 627 plasma concentrations sampled 0.8-12.4 hours post-dose on day 1 and day 14 of ART; 69 of the 75 patients had day-14 samples. Demographics by treatment arm are summarised in Table 1 of the source. Notable for the lamivudine model: cohort triglyceride median was 2.3 mmol/L (early arm) / 2.2 mmol/L (delayed arm) per Table 1, but the model equation centres triglyceride at 5.3 mmol/L (the value the source text describes as the “average triglyceride concentration … in this population”) – the discrepancy is documented in Errata below.
The same information is available programmatically:
readModelDb("Archary_2019_lamivudine")$population after the
model is loaded.
Source trace
Per-parameter origin (also recorded as in-file comments next to each
ini() entry of
inst/modeldb/specificDrugs/Archary_2019_lamivudine.R):
| Equation / parameter | Value | Source location |
|---|---|---|
lka |
log(0.30) | Archary 2019 Table 2 (ka day 1 = 0.30 /h) |
lcl |
log(12.2) | Archary 2019 Table 2 (CL/F = 12.2 L/h per 7 kg) |
lvc |
log(8.22) | Archary 2019 Table 2 (Vc/F = 8.22 L per 7 kg) |
e_wt_cl |
0.75 | Archary 2019 Methods 2.3 (“Allometric exponents were fixed to 0.75 for CL/F”) |
e_wt_vc |
1 | Archary 2019 Methods 2.3 (“… and 1 for apparent volume of distribution”) |
mat_hill |
1.47 | Archary 2019 Table 2 (“Maturation shape parameter 1.47”) |
mat_age50 |
0.25 | Archary 2019 Table 2 (“Age at 50% of mature CL/F 0.25 y”) |
e_trig_vc |
-0.13 | Archary 2019 Table 2 + Section 3.3 (“decreasing Vc/F of 13.3% for every 1 mmol/L increase in triglyceride”) |
trig_ref |
5.3 | Archary 2019 Section 3.3 (“from the average triglyceride concentration of 5.3 mmol/L in this population”); see Errata for the Table 1 disagreement |
e_day14_ka |
0.1333 | Archary 2019 Table 2 (day-14 ka 0.34 vs day-1 ka 0.30; 0.34 / 0.30 - 1 = 0.1333) |
etalcl + etalvc |
(0.1646, 0.1646, 0.3616) | Archary 2019 Table 2 (IIV CL/F 42.3% -> var 0.1646; IIV Vc/F 66% -> var 0.3616; correlation 0.674 -> cov = 0.674 * sqrt(0.1646 * 0.3616) = 0.1646) |
propSd |
0.36 | Archary 2019 Table 2 (Proportional RUV 36.0%) |
d/dt(depot), d/dt(central)
|
n/a | Archary 2019 Section 3.3 (1-compartment with first-order oral absorption) |
Cc <- central / vc |
n/a | Standard linear-CL parameterisation; dose mg, volume L -> mg/L = ug/mL |
Cc ~ prop(propSd) |
n/a | Archary 2019 Methods 2.3 (“RUV was estimated using proportional … error models”) |
Virtual cohort
Original observed data are not publicly available (Archary 2019 Data Availability Statement). The cohort below is a virtual reproduction of the WHO weight-band liquid-formulation dosing for the cohort-median 7 kg infant (the WHO 6-9.9 kg band gives 60 mg lamivudine BID), simulated for both day 1 and day 14 of ART at the cohort-median age (1.4 years) and triglyceride (2.3 mmol/L per Table 1 – not the 5.3 mmol/L equation reference).
set.seed(20260508L)

n_per_group   <- 50L      # subjects per cohort cell
ref_wt        <- 7        # kg, paper's median weight
ref_age       <- 1.4      # y, paper's median age
ref_trig_demo <- 2.3      # mmol/L, paper's Table 1 cohort triglyceride median (not the equation reference 5.3)
sample_hours  <- c(0, 0.25, 0.5, 0.75, 1, 1.5, 2, 3, 4, 6, 8, 10, 12)

make_cohort <- function(dose_amt_mg, day14_value, id_offset) {
  ids <- seq_len(n_per_group) + id_offset
  dose_rows <- tibble::tibble(
    id   = ids,
    time = 0,
    amt  = dose_amt_mg,
    evid = 1L,
    cmt  = 1L
  )
  obs_rows <- tibble::tibble(
    id   = rep(ids, each = length(sample_hours)),
    time = rep(sample_hours, times = length(ids)),
    amt  = 0,
    evid = 0L,
    cmt  = NA_integer_
  )
  dplyr::bind_rows(dose_rows, obs_rows) |>
    dplyr::mutate(
      WT     = ref_wt,
      AGE    = ref_age,
      TRIG   = ref_trig_demo,
      DAY14  = day14_value,
      cohort = paste0(
        "day ",
        ifelse(day14_value == 1L, "14", "1"),
        " (", dose_amt_mg, " mg, AGE = ", ref_age, " y)"
      )
    )
}

events <- dplyr::bind_rows(
  make_cohort(60, 0L,    0L),                                  # day 1
  make_cohort(60, 1L,  100L)                                   # day 14
) |>
  dplyr::arrange(id, time, dplyr::desc(evid))

stopifnot(!anyDuplicated(unique(events[, c("id", "time", "evid")])))
Simulation
mod <- rxode2::rxode2(readModelDb("Archary_2019_lamivudine"))
#> ℹ parameter labels from comments will be replaced by 'label()'

sim <- rxode2::rxSolve(
  mod,
  events = events,
  keep   = c("WT", "AGE", "TRIG", "DAY14", "cohort")
) |>
  as.data.frame()
For deterministic typical-value lines (replicating Figure 2’s median curve without IIV / residual scatter):
mod_typical <- mod |> rxode2::zeroRe()
sim_typical <- rxode2::rxSolve(
mod_typical,
events = events,
keep = c("WT", "AGE", "TRIG", "DAY14", "cohort")
) |>
as.data.frame()
#> ℹ omega/sigma items treated as zero: 'etalcl', 'etalvc'
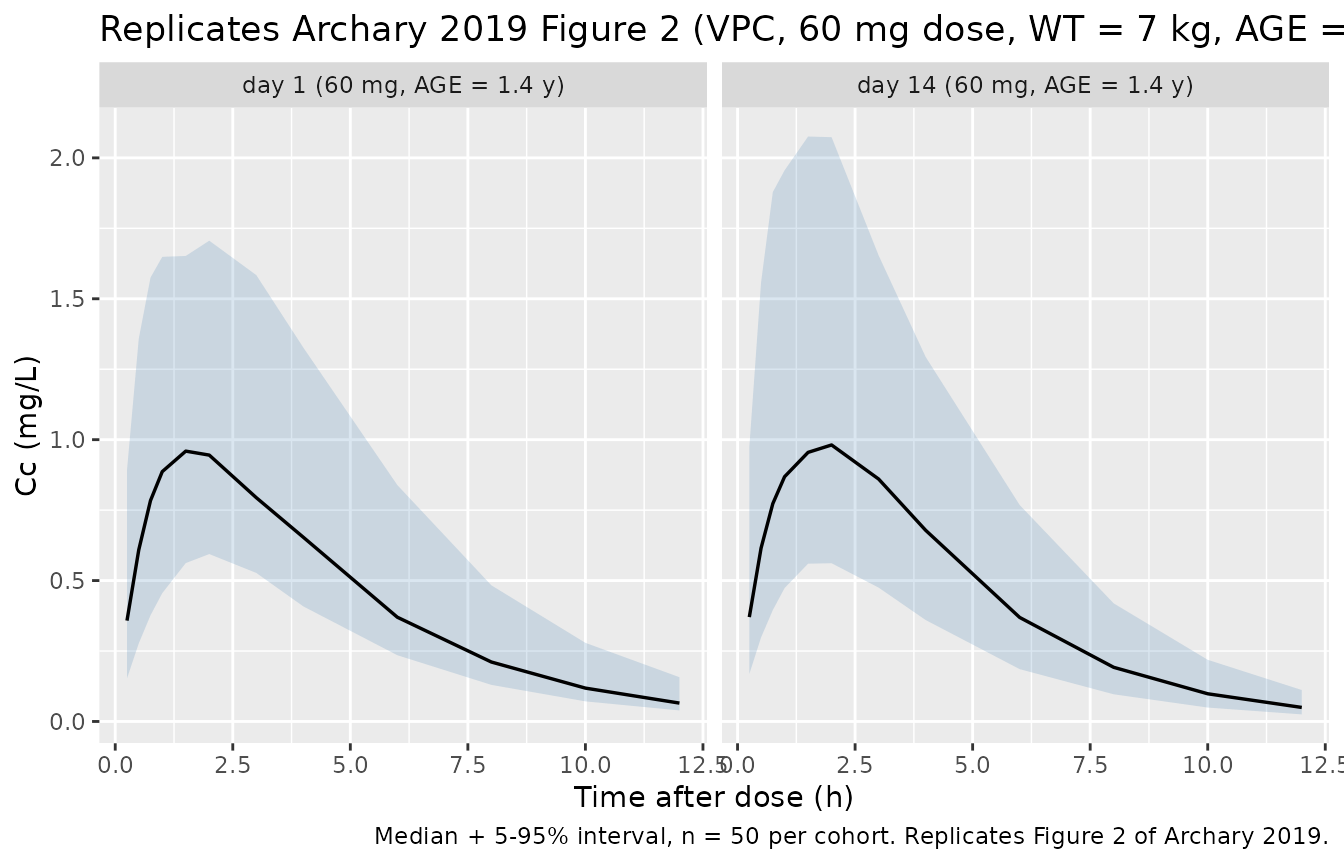
#> Warning: multi-subject simulation without without 'omega'Replicate Figure 2: VPC
Archary 2019 Figure 2 shows a single-panel prediction-corrected VPC of lamivudine concentrations vs time after dose (no panelling by day or arm). The cohort below reproduces that shape at the cohort-median 7 kg weight; the day-1 vs day-14 split is shown for completeness, since the ka step is the only typical-value time-varying feature in the lamivudine model.
sim_quantiles <- sim |>
  dplyr::filter(time > 0, !is.na(Cc)) |>
  dplyr::group_by(cohort, time) |>
  dplyr::summarise(
    Q05 = stats::quantile(Cc, 0.05, na.rm = TRUE),
    Q50 = stats::quantile(Cc, 0.50, na.rm = TRUE),
    Q95 = stats::quantile(Cc, 0.95, na.rm = TRUE),
    .groups = "drop"
  )

ggplot(sim_quantiles, aes(time, Q50)) +
  geom_ribbon(aes(ymin = Q05, ymax = Q95), alpha = 0.2, fill = "steelblue") +
  geom_line(linewidth = 0.6) +
  facet_wrap(~ cohort, ncol = 2) +
  labs(
    x = "Time after dose (h)",
    y = "Cc (mg/L)",
    title = "Replicates Archary 2019 Figure 2 (VPC, 60 mg dose, WT = 7 kg, AGE = 1.4 y)",
    caption = "Median + 5-95% interval, n = 50 per cohort. Replicates Figure 2 of Archary 2019."
  )
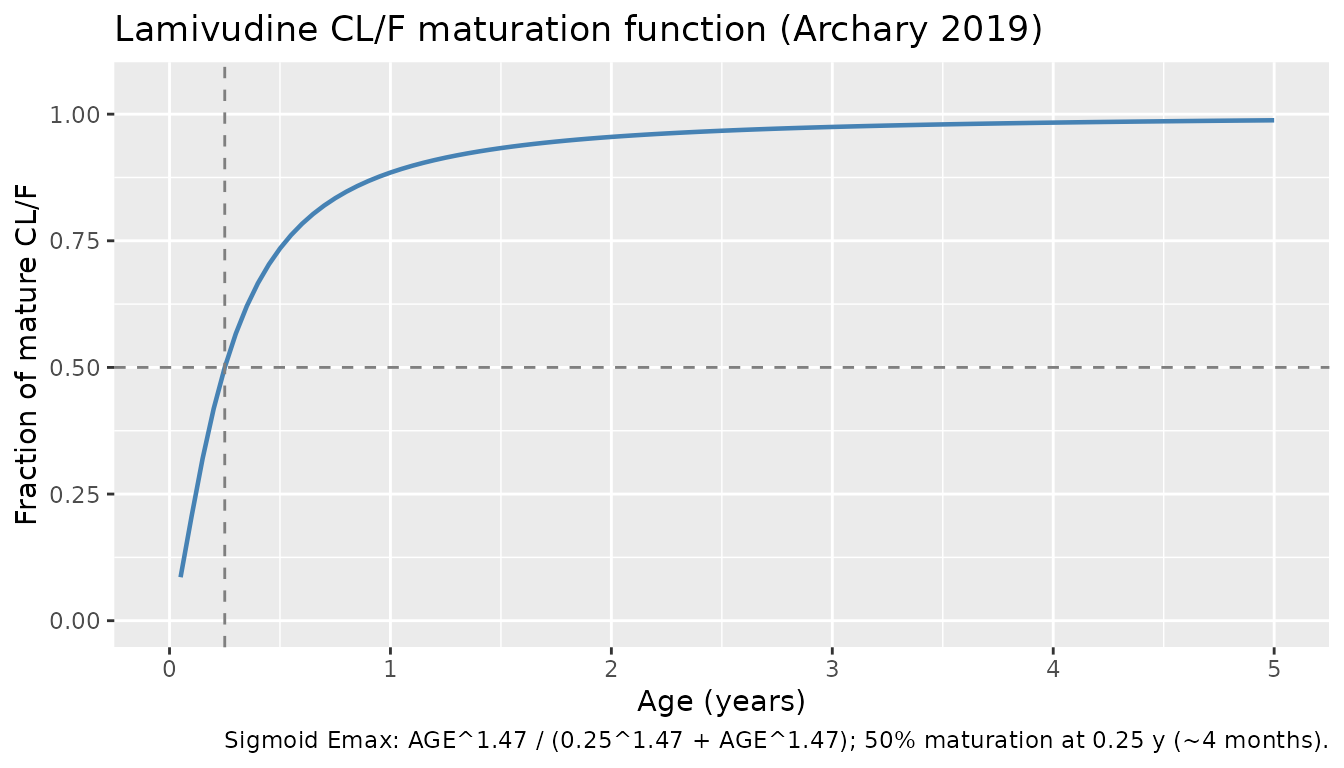
Maturation curve: CL/F vs age
Archary 2019 finds a sigmoid-Emax maturation of CL/F with age, with 50% maturation reached at 0.25 years (~4 months) and Hill exponent 1.47. The plot below isolates that maturation curve from the rest of the model.
mat_hill  <- 1.47
mat_age50 <- 0.25
age_grid  <- seq(0.05, 5, by = 0.05)
mat_frac  <- age_grid^mat_hill / (mat_age50^mat_hill + age_grid^mat_hill)

ggplot(data.frame(age = age_grid, frac = mat_frac), aes(age, frac)) +
  geom_line(linewidth = 0.8, colour = "steelblue") +
  geom_hline(yintercept = 0.5, linetype = "dashed", colour = "grey50") +
  geom_vline(xintercept = mat_age50, linetype = "dashed", colour = "grey50") +
  scale_x_continuous(limits = c(0, 5), breaks = seq(0, 5, by = 1)) +
  scale_y_continuous(limits = c(0, 1.05), breaks = seq(0, 1, by = 0.25)) +
  labs(
    x = "Age (years)",
    y = "Fraction of mature CL/F",
    title = "Lamivudine CL/F maturation function (Archary 2019)",
    caption = "Sigmoid Emax: AGE^1.47 / (0.25^1.47 + AGE^1.47); 50% maturation at 0.25 y (~4 months)."
  )
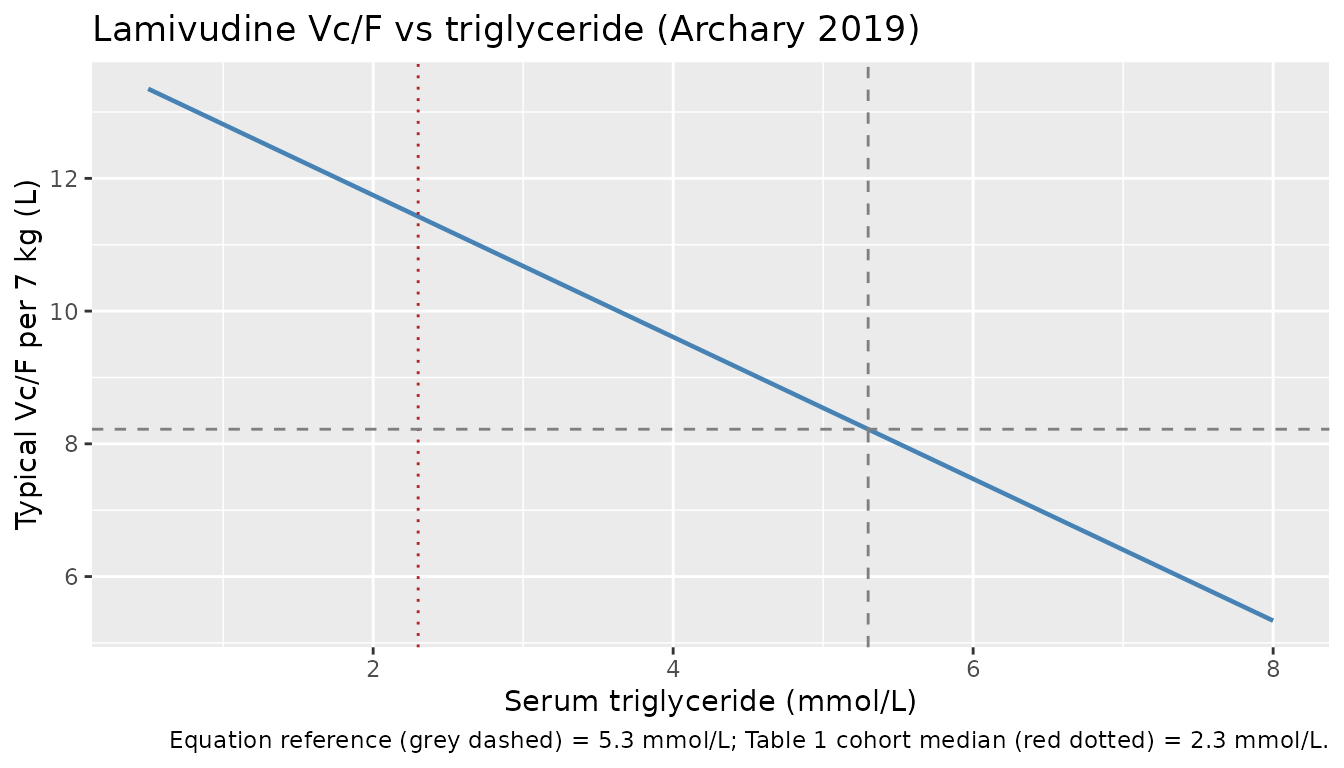
Triglyceride effect on Vc/F
The model encodes a linear deviation of Vc/F with triglyceride, centred at 5.3 mmol/L (per the source equation). The plot below shows the typical-value Vc/F (per 7 kg) over the relevant range. Note that the Table 1 cohort median triglyceride is ~2.3 mmol/L, not 5.3 mmol/L – see Errata.
e_trig_vc <- -0.13
trig_ref  <- 5.3
trig_grid <- seq(0.5, 8, by = 0.1)
vc_per_7kg <- 8.22 * (1 + e_trig_vc * (trig_grid - trig_ref))

ggplot(data.frame(trig = trig_grid, vc = vc_per_7kg), aes(trig, vc)) +
  geom_line(linewidth = 0.8, colour = "steelblue") +
  geom_vline(xintercept = trig_ref, linetype = "dashed", colour = "grey50") +
  geom_vline(xintercept = 2.3, linetype = "dotted", colour = "firebrick") +
  geom_hline(yintercept = 8.22, linetype = "dashed", colour = "grey50") +
  labs(
    x = "Serum triglyceride (mmol/L)",
    y = "Typical Vc/F per 7 kg (L)",
    title = "Lamivudine Vc/F vs triglyceride (Archary 2019)",
    caption = "Equation reference (grey dashed) = 5.3 mmol/L; Table 1 cohort median (red dotted) = 2.3 mmol/L."
  )
PKNCA validation
NCA on the simulated stochastic cohort, by day cell:
pkn_in <- sim |>
  dplyr::filter(!is.na(Cc)) |>
  dplyr::mutate(treatment = cohort)

dose_pkn <- events |>
  dplyr::filter(evid == 1L) |>
  dplyr::mutate(treatment = cohort)

conc_obj <- PKNCA::PKNCAconc(pkn_in, Cc ~ time | treatment + id)
dose_obj <- PKNCA::PKNCAdose(dose_pkn, amt ~ time | treatment + id,
                             route = "extravascular")

intervals <- data.frame(
  start    = 0,
  end      = 12,
  cmax     = TRUE,
  tmax     = TRUE,
  auclast  = TRUE
)

nca_data <- PKNCA::PKNCAdata(conc_obj, dose_obj, intervals = intervals)
nca_res  <- PKNCA::pk.nca(nca_data)

nca_summary <- nca_res$result |>
  dplyr::filter(PPTESTCD %in% c("cmax", "tmax", "auclast")) |>
  dplyr::group_by(treatment, PPTESTCD) |>
  dplyr::summarise(
    median = stats::median(PPORRES, na.rm = TRUE),
    p05    = stats::quantile(PPORRES, 0.05, na.rm = TRUE),
    p95    = stats::quantile(PPORRES, 0.95, na.rm = TRUE),
    .groups = "drop"
  )

knitr::kable(
  nca_summary,
  caption = "Simulated lamivudine NCA parameters by day cell (60 mg dose, WT = 7 kg, AGE = 1.4 y, n = 50 per cell)."
)| treatment | PPTESTCD | median | p05 | p95 |
|---|---|---|---|---|
| day 1 (60 mg, AGE = 1.4 y) | auclast | 5.3281863 | 3.151355 | 10.655156 |
| day 1 (60 mg, AGE = 1.4 y) | cmax | 0.9658237 | 0.551161 | 2.066523 |
| day 1 (60 mg, AGE = 1.4 y) | tmax | 1.5000000 | 1.225000 | 2.000000 |
| day 14 (60 mg, AGE = 1.4 y) | auclast | 4.7667189 | 2.701061 | 9.171715 |
| day 14 (60 mg, AGE = 1.4 y) | cmax | 1.0017429 | 0.470713 | 1.988081 |
| day 14 (60 mg, AGE = 1.4 y) | tmax | 1.5000000 | 1.000000 | 2.550000 |
Comparison against published values
Archary 2019 Section 3.4 reports the median (IQR) lamivudine AUC0-12 across all study days for two outcome strata at week 12: 3.4 [2.3-5.1] hmg/L for treatment-failure patients and 3.8 [2.3-5.7] hmg/L for treatment-success patients. The simulated AUC0-12 medians above (single 60 mg dose, cohort-median 7 kg / 1.4 y / 2.3 mmol/L triglyceride) should sit in the same broad range – they will skew somewhat higher because the simulation uses the demographic- median triglyceride (2.3 mmol/L) which inflates Vc/F by ~39% relative to the equation reference (5.3 mmol/L), but the overall single-digit h*mg/L magnitude is consistent with the source.
Assumptions and deviations
-
Year-letter on the file name resolves to 2019, not
2018. The task metadata names the file as
Archary_2018_*.Rbut the source PDF masthead is unambiguouslyBr J Clin Pharmacol. 2019;1-10(received 9 Nov 2018, accepted 15 May 2019, published 2019). Per Phase 1 step 2 of the extraction skill the file naming is corrected toArchary_2019_lamivudine.Rto match the publication year on disk. -
Two-models-per-paper extraction (operator decision sidecar
request-001 Q1). Archary 2019 BJCP describes two independent
popPK models in one paper (abacavir 2-compartment + lamivudine
1-compartment); the operator approved option 1A (extract both drugs as
paired model files + paired vignettes in a single PR). The abacavir half
is in
Archary_2019_abacavir. -
Day-1-vs-day-14 step encoded via a binary
DAY14covariate (operator decision sidecar request-001 Q2 = option 2i). Archary 2019 reports a step change in typical ka between day 1 (0.30 /h) and day 14 (0.34 /h) of ART. The operator approved encoding the step as a binaryDAY14covariate (0 = day 1, 1 = day 14) on ka via the multiplicative shift(1 + e_day14_ka * DAY14)withe_day14_ka = 0.34/0.30 - 1 = 0.1333. The lamivudine ka step is much smaller than the abacavir CL/F step (13% vs 76%) and the source reports its statistical significance asdOFV = -7.3(vsdOFV = -80.8for the abacavir CL/F step).DAY14is registered as a specific-scope canonical entry ininst/references/covariate-columns.md. -
Triglyceride centring at 5.3 mmol/L disagrees with the Table
1 cohort median of 2.2-2.3 mmol/L. The source equation centres
TRIG at 5.3 mmol/L (Section 3.3 prose: “from the average triglyceride
concentration of 5.3 mmol/L in this population”), but Table 1 of the
same paper reports the cohort median triglyceride as 2.3 mmol/L (early
arm) and 2.2 mmol/L (delayed arm). The discrepancy is internal to the
paper. The packaged model uses the equation-reported centring (5.3
mmol/L) since that is what makes the published parameter table
self-consistent (Table 2 lamivudine Vc/F = 8.22 L per 7 kg is the value
at TRIG = 5.3 mmol/L). For the simulated cohort in this vignette we use
the demographic-median triglyceride (2.3 mmol/L per Table 1), which
yields a typical Vc/F of 8.22 * (1 - 0.13 * (2.3 - 5.3)) = 11.4 L per 7
kg – ~39% higher than the centring-reference value – and a
correspondingly lower Cmax / longer apparent half-life. Consumers who
want to match the source’s parameter-table-reference Vc/F exactly should
set
TRIG = 5.3in the event dataset. - Apparent Vc/F is unusually large for a paediatric lamivudine cohort. The source’s reported CL/F of 1.5 L/h/kg is higher than the 0.39-1.03 L/h/kg range from prior paediatric lamivudine studies (paper Discussion); the source attributes the difference to “reduced bioavailability in this malnutrition cohort rather than an increased elimination of the drug.” The packaged model preserves the source’s reported CL/F (12.2 L/h per 7 kg ~= 1.74 L/h/kg) and Vc/F (8.22 L per 7 kg ~= 1.17 L/kg at TRIG = 5.3, ~= 1.63 L/kg at TRIG = 2.3); these are apparent parameters including the unknown F. The corresponding apparent terminal half-life is short (around 30-50 minutes for the cohort-median child) – this matches the source’s parameter table, not the ~1-2 h apparent half-life typical of normo-nourished paediatric lamivudine populations.
-
Block omega for CL/Vc with correlation 67.4%. The
source reports IIV CL/F 42.3%, IIV Vc/F 66%, and “Covariance IIV CL/F
and IIV Vc/F 67.4%” (Table 2). The 67.4% is interpreted as the Pearson
correlation
rho(as is conventional when reported as a percentage); the corresponding lower-triangle omega block entries are(0.1646, 0.1646, 0.3616)wherevar(CL) = log(1 + 0.423^2) = 0.1646,var(Vc) = log(1 + 0.66^2) = 0.3616, andcov = rho * sqrt(var(CL) * var(Vc)) = 0.674 * sqrt(0.1646 * 0.3616) = 0.1646. -
IOV CL/F = 59.7% is not encoded in the model file.
Archary 2019 Table 2 reports an IOV (between-occasion-within-subject)
variability on CL/F of 59.7% across the three sampling occasions (day 1,
day 13 pre-dose, day 14). nlmixr2’s IOV pattern requires per-occasion
eta multiplexing (see
Jonsson_2011_ethambutol.Rfor a 4-occasion analogue). For the typical-value / cohort-median simulation use-case this packaged model targets, the IOV is omitted; consumers who need to reproduce the source’s full variance decomposition should add IOV-multiplexed etas downstream. -
No explicit residual lower-LoQ floor (Methods 2.3 BQL
handling). The source set the first lamivudine concentration
below the lower limit of quantification (0.0195 ug/mL) within a dosing
interval to
LoQ / 2and discarded subsequent BQL samples; for lamivudine 4.0% (n = 25) of samples were BQL but none were discarded. The packaged model does not implement BQL handling; PKNCA users supplying real (non-simulated) data should apply the same M5/M6-style BQL handling at data-assembly time. -
linCmt()not used. The model is written with explicitd/dt(depot)andd/dt(central)ODEs to make the day-14 step on ka, the maturation function on CL/F, and the triglyceride effect on Vc/F maximally visible alongside the structural ODEs. AlinCmt()parameterisation would be equally correct.