Epinastine (Sarashina 2005)
Source:vignettes/articles/Sarashina_2005_epinastine.Rmd
Sarashina_2005_epinastine.RmdModel and source
- Citation: Sarashina A, Tatami S, Yamamura N, Tsuda Y, Igarashi T. Population pharmacokinetics of epinastine, a histamine H1 receptor antagonist, in adults and children. Br J Clin Pharmacol. 2005;59(1):43-53. doi:10.1111/j.1365-2125.2005.02250.x
- Description: Two-compartment population PK model with first-order absorption for oral epinastine in healthy adults and paediatric atopic dermatitis patients (Sarashina 2005), with linear-in-WT CL/F and V1/F plus food-status and formulation covariate effects
- Article: https://doi.org/10.1111/j.1365-2125.2005.02250.x
Epinastine is a non-sedating histamine H1 receptor antagonist used for allergic rhinitis and atopic dermatitis. Sarashina 2005 pooled 1510 plasma concentration observations from 62 healthy adult volunteers and 62 paediatric atopic dermatitis patients (six clinical trials) and estimated a two-compartment population PK model with first-order absorption. Body weight, food status (fed/fasted), and formulation (tablet/dry syrup) were retained as covariates; age was screened but did not enter the final model.
Population
The pooled cohort comprises 124 subjects (62 healthy adult male volunteers and 62 paediatric atopic dermatitis patients, of whom 38 male and 24 female), all Japanese, drawn from six clinical trials conducted in Japan (Sarashina 2005 Table 1). The adult subjects were aged 20-26 years (mean 22.3 +/- 1.7) and weighed 50-82 kg (mean 63.0 +/- 6.9); the paediatric subjects were 2-15 years old (mean 10.2 +/- 3.8) and weighed 14.1-68 kg (mean 36.9 +/- 15.5). Adults received 10, 20, or 40 mg epinastine as tablet or dry syrup in either the fasted or fed state across five trials (bioequivalence, dose-ranging, multiple dose, chronopharmacology, food effect). Paediatric patients received 10 mg (if 14 kg to <24 kg) or 20 mg (if 24 kg or more) once daily as dry syrup for 12 weeks, predominantly non-fasted, with three trough samples per patient drawn at weeks 2-6, 6-10, and 10-14 (Sarashina 2005 Table 2).
The same demographics are available programmatically via
readModelDb("Sarashina_2005_epinastine")$population.
Source trace
Per-parameter origin (also recorded as in-file comments next to each
ini() entry of
inst/modeldb/specificDrugs/Sarashina_2005_epinastine.R).
The paper uses a linear-in-WT covariate model on CL/F and V1/F,
reproduced here in the algebraically equivalent multiplicative form
exp(lcl) * (1 + e_wt_cl * WT). Categorical covariates
(food, formulation) are applied as power-style ratios on the
indicator.
| Equation / parameter | Value | Source location |
|---|---|---|
lcl = log(19.1)
|
CL/F intercept (theta1) 19.1 L/h | Table 4, theta1 |
lvc = log(174)
|
V1/F intercept (theta2) 174 L | Table 4, theta2 |
lq = log(34.4)
|
Q/F (theta3) 34.4 L/h | Table 4, theta3 |
lvp = log(452)
|
V2/F (theta4) 452 L | Table 4, theta4 |
lka = log(1.18)
|
Ka (theta5) 1.18 1/h | Table 4, theta5 |
e_wt_cl = 0.0421 |
per-kg fractional slope on CL/F (theta10 / theta1 = 0.805 / 19.1) | Table 4, theta10 |
e_wt_vc = 0.0227 |
per-kg fractional slope on V1/F (theta11 / theta2 = 3.95 / 174) | Table 4, theta11 |
e_fed_cl = 1.41 |
fed/fasted ratio on CL/F (theta6) | Table 4, theta6 |
e_fed_vc = 1.75 |
fed/fasted ratio on V1/F (theta7) | Table 4, theta7 |
e_fed_tlag = 0.234 h |
fed-state absorption lag (theta8, additive) | Table 4, theta8 |
e_form_syrup_cl = 1.06 |
dry-syrup/tablet ratio on CL/F (theta9) | Table 4, theta9 |
etalcl ~ 0.101 |
IIV CL/F (omega^2; ~31.8% CV per Table 5) | Table 5 |
etalvc ~ 0.107 |
IIV V1/F (omega^2; ~32.7% CV) | Table 5 |
etalq ~ 0.226 |
IIV Q/F (omega^2; ~47.5% CV) | Table 5 |
etalvp ~ 1.43 |
IIV V2/F (omega^2; ~119.6% CV) | Table 5 |
etalka ~ 0.323 |
IIV Ka (omega^2; ~56.8% CV) | Table 5 |
propSd = 0.279 |
proportional residual SD (27.9%) | Table 4 |
addSd = 0.425 ng/mL |
additive residual SD | Table 4 |
d/dt(depot), d/dt(central),
d/dt(peripheral1)
|
n/a | Methods Step 1 (two-compartment + first-order absorption) |
alag(depot) <- e_fed_tlag * FED |
n/a | Table 4 (FOODALAG = theta8 if fed, 0 if fasted) |
Cc <- 1000 * central / vc |
n/a | Paper reports ng/mL; dose mg / volume L -> mg/L = ug/mL, x1000 -> ng/mL |
Covariate column naming
| Source column | Canonical column | Notes |
|---|---|---|
| WT (kg) | WT |
Time-fixed body weight; enters CL/F and V1/F linearly. |
| Food status (fed/fasted) | FED |
1 = fed at dosing, 0 = fasted. Per-record covariate. |
| Formulation (tablet/dry syrup) | FORM_SYRUP |
1 = dry syrup, 0 = tablet (reference). |
All three canonical column names are already registered in
inst/references/covariate-columns.md; no new entries are
required.
Virtual cohort
Original observed data are not publicly available. The cohort below reconstructs the four panels of Figure 5 (typical-value plasma profiles per subject subgroup) and the adult-vs-paediatric exposure comparison of Figure 6.
set.seed(2026L)

week <- 7  # days, not used here but kept for clarity

# Each row of `cohort_spec` defines one steady-state typical-value
# subject. WT is fixed per row (no IIV on weight - it is a covariate),
# while FED and FORM_SYRUP toggle the per-record food / formulation
# state.
cohort_spec <- tibble::tribble(
  ~cohort,                                ~dose_mg, ~WT, ~FED, ~FORM_SYRUP,
  "Adult 20 mg tablet fasted (63 kg)",         20,   63,   0L,         0L,
  "Adult 20 mg tablet fed (63 kg)",            20,   63,   1L,         0L,
  "Adult 20 mg dry syrup fed (63 kg)",         20,   63,   1L,         1L,
  "Adult 20 mg dry syrup fed (40 kg)",         20,   40,   1L,         1L,
  "Adult 20 mg dry syrup fed (80 kg)",         20,   80,   1L,         1L,
  "Paediatric 10 mg dry syrup fed (14 kg)",    10,   14,   1L,         1L,
  "Paediatric 10 mg dry syrup fed (24 kg)",    10,   24,   1L,         1L,
  "Paediatric 20 mg dry syrup fed (24 kg)",    20,   24,   1L,         1L
)

obs_grid <- c(0, 0.25, 0.5, seq(0.75, 12, by = 0.25), 16, 20, 24)

cohort_spec$id <- seq_len(nrow(cohort_spec))

dose_rows_typ <- cohort_spec |>
  dplyr::transmute(id, cohort, WT, FED, FORM_SYRUP,
                   time = 0, amt = dose_mg, evid = 1L,
                   cmt = "depot")

obs_rows_typ <- cohort_spec |>
  tidyr::crossing(time = obs_grid) |>
  dplyr::transmute(id, cohort, WT, FED, FORM_SYRUP,
                   time, amt = 0, evid = 0L,
                   cmt = NA_character_)

events_typical <- dplyr::bind_rows(dose_rows_typ, obs_rows_typ) |>
  dplyr::arrange(id, time, dplyr::desc(evid))

stopifnot(!anyDuplicated(unique(events_typical[, c("id", "time", "evid")])))
Simulation
For the per-subgroup typical-value figures we zero out the random
effects (rxode2::zeroRe()) so each line is the
deterministic typical-value trajectory for its covariate pattern.
mod <- rxode2::rxode2(readModelDb("Sarashina_2005_epinastine"))
#> ℹ parameter labels from comments will be replaced by 'label()'
mod_typical <- mod |> rxode2::zeroRe()

sim_typical <- rxode2::rxSolve(
  mod_typical,
  events = events_typical,
  keep   = c("cohort", "WT", "FED", "FORM_SYRUP")
) |>
  as.data.frame()
#> ℹ omega/sigma items treated as zero: 'etalcl', 'etalvc', 'etalq', 'etalvp', 'etalka'
#> Warning: multi-subject simulation without without 'omega'
Replicate Figure 5: typical PK profiles by covariate subgroup
Sarashina 2005 Figure 5 shows simulated typical plasma profiles for four subgroup comparisons:
- Panel A: 10 mg dry syrup, fed state, 14 vs 24 kg
- Panel B: 20 mg dry syrup, fed state, 40 / 60 / 80 kg
- Panel C: 20 mg dry syrup, fasted vs fed, 60 kg (not separately simulated here; the fasted-vs-fed contrast at 63 kg adult appears among the adult cohorts below)
- Panel D: 20 mg tablet vs dry syrup, fed state, 60 kg
adult_cohorts <- c(
  "Adult 20 mg tablet fasted (63 kg)",
  "Adult 20 mg tablet fed (63 kg)",
  "Adult 20 mg dry syrup fed (63 kg)",
  "Adult 20 mg dry syrup fed (40 kg)",
  "Adult 20 mg dry syrup fed (80 kg)"
)
sim_typical |>
  dplyr::filter(cohort %in% adult_cohorts, time > 0) |>
  ggplot(aes(time, Cc, colour = cohort)) +
  geom_line(linewidth = 0.7) +
  scale_y_log10() +
  labs(
    x = "Time after single dose (h)",
    y = "Plasma epinastine (ng/mL)",
    colour = NULL,
    title = "Adult typical-value plasma epinastine profiles",
    caption = "Replicates Sarashina 2005 Figure 5 panels B/C/D (adult subgroup comparisons)."
  ) +
  theme_bw() +
  theme(legend.position = "bottom",
        legend.text = element_text(size = 8))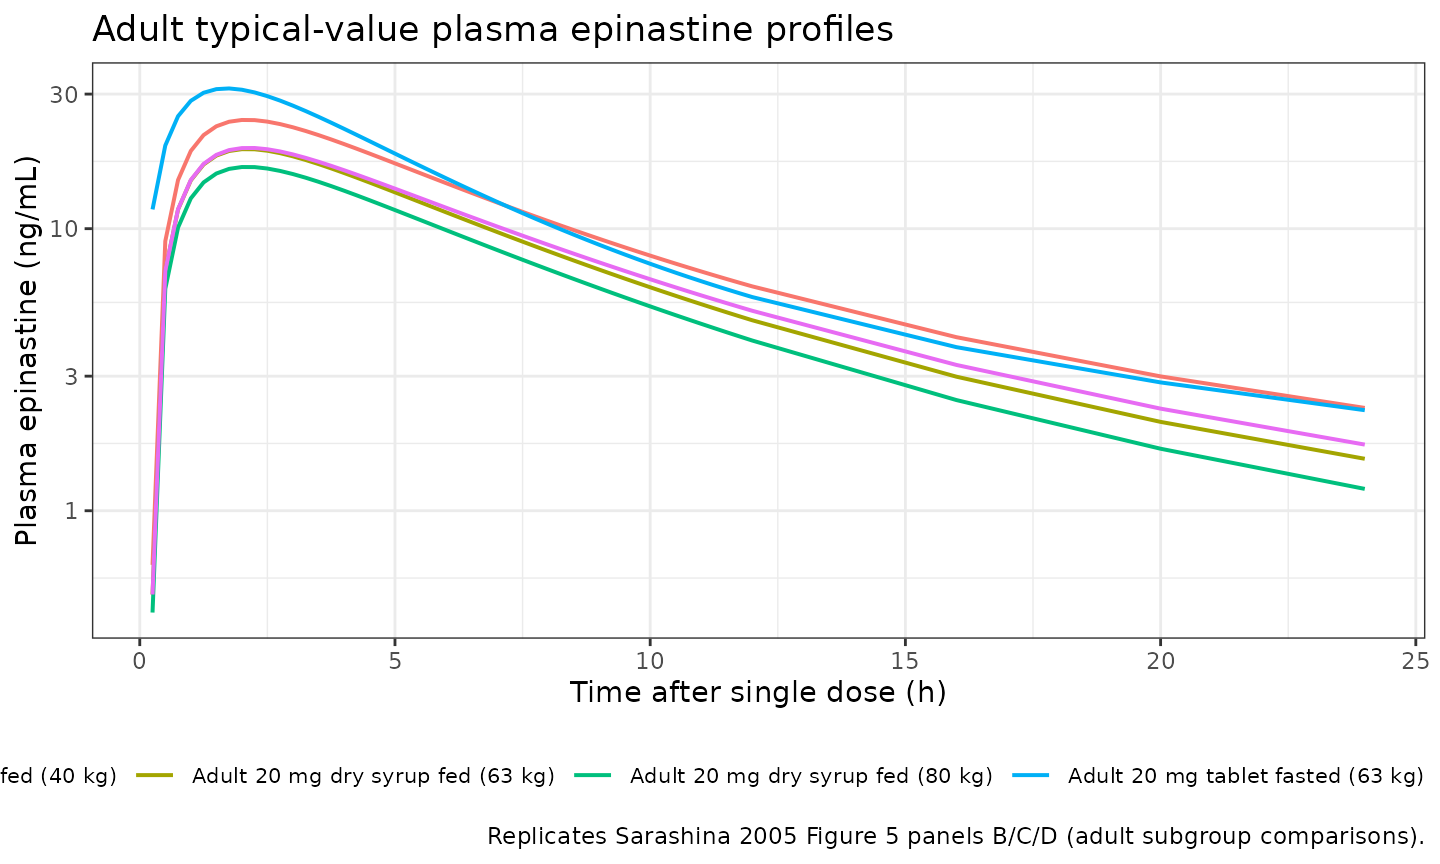
paed_cohorts <- c(
  "Paediatric 10 mg dry syrup fed (14 kg)",
  "Paediatric 10 mg dry syrup fed (24 kg)",
  "Paediatric 20 mg dry syrup fed (24 kg)"
)
sim_typical |>
  dplyr::filter(cohort %in% paed_cohorts, time > 0) |>
  ggplot(aes(time, Cc, colour = cohort)) +
  geom_line(linewidth = 0.7) +
  scale_y_log10() +
  labs(
    x = "Time after dose (h)",
    y = "Plasma epinastine (ng/mL)",
    colour = NULL,
    title = "Paediatric typical-value plasma epinastine profiles",
    caption = "Replicates Sarashina 2005 Figure 5 panel A and the 24 kg / 20 mg crossover."
  ) +
  theme_bw() +
  theme(legend.position = "bottom",
        legend.text = element_text(size = 8))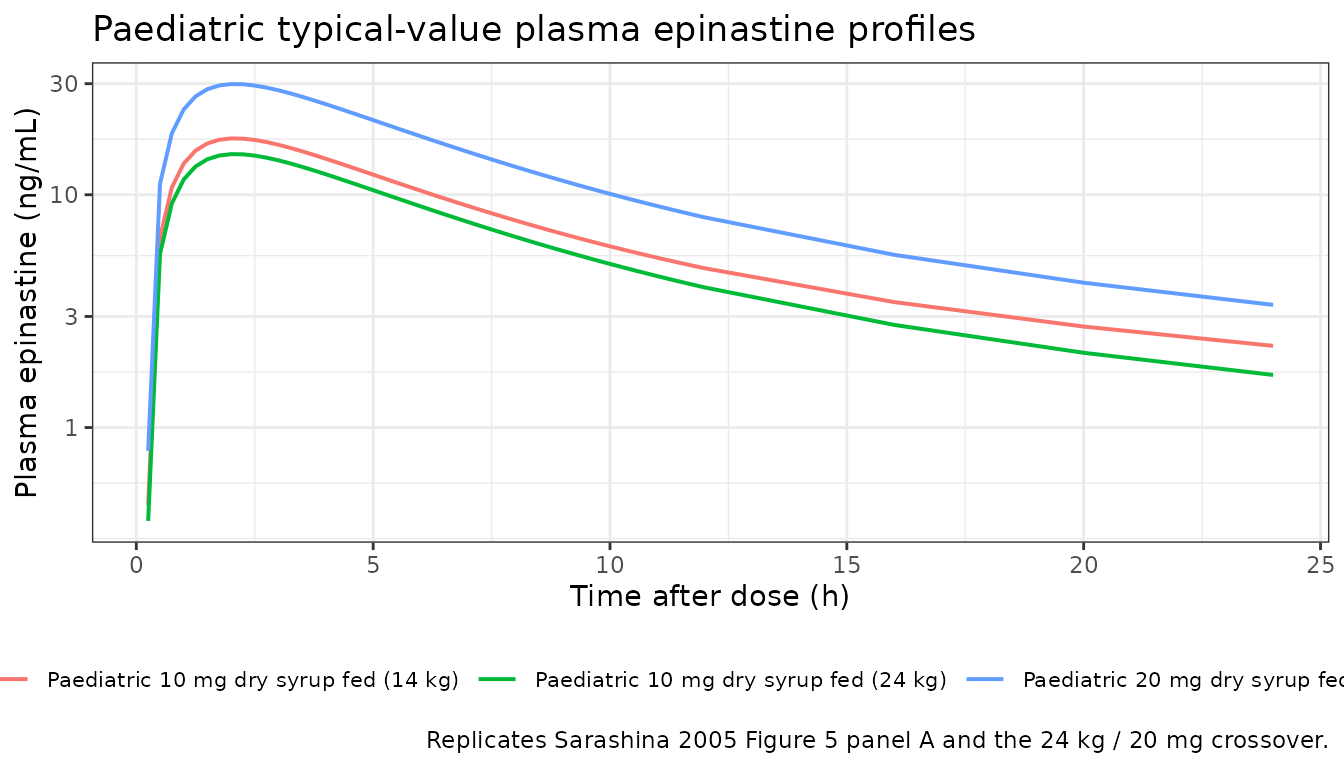
The traces show the expected qualitative patterns: heavier subjects (higher CL/F and V1/F) have lower Cmax and lower AUC; the fed state shifts Cmax later and reduces both Cmax and AUC; dry syrup gives slightly lower exposure than tablet (theta9 = 1.06 multiplier on CL/F); a 14 kg child given 10 mg has comparable exposure to a 24 kg child given the WT-band-doubled 20 mg dose (the body-weight-tiered paediatric dosing strategy the paper recommends).
Replicate Figure 6: adult-vs-paediatric exposure under WT-tiered paediatric dosing
Sarashina 2005 Figure 6 compares individual exposures (Cmax and AUC) between adults receiving 20 mg and children dosed by weight band (10 mg if 14 kg to <24 kg, 20 mg if 24 kg or more). The cohorts below sample both populations stochastically using IIV from the final model so the per-cohort distributions can be plotted alongside the published means.
n_per_adult_cell <- 200L
n_per_paed_cell  <- 200L

# Adult cohort: WT mean 63 kg, SD 6.9 kg (Table 2; bounded to the
# observed 50-82 kg range). Mixed fed / fasted reflecting the 607
# fasting vs 724 non-fasting observation count (Table 2);
# approximated as ~55% non-fasting at dosing. Tablet vs dry syrup
# follows the 62/18 subject split (~77% tablet).
adult_cohort <- tibble::tibble(
  id         = seq_len(n_per_adult_cell),
  WT         = pmin(pmax(rnorm(n_per_adult_cell, 63, 6.9), 50), 82),
  FED        = rbinom(n_per_adult_cell, 1, 0.55),
  FORM_SYRUP = rbinom(n_per_adult_cell, 1, 0.225),
  dose_mg    = 20,
  cohort     = "Adult 20 mg (mixed fed/fasted, tablet/syrup)"
)

# Paediatric cohort: weight uniformly sampled across the observed
# 14.1-68 kg range; per-subject dose follows the WT-tier rule. All
# paediatric subjects received dry syrup; most observations are
# non-fasting (10 vs 169), approximated as ~95% fed.
paed_cohort <- tibble::tibble(
  id         = n_per_adult_cell + seq_len(n_per_paed_cell),
  WT         = runif(n_per_paed_cell, 14.1, 68),
  FED        = rbinom(n_per_paed_cell, 1, 0.95),
  FORM_SYRUP = 1L
) |>
  dplyr::mutate(
    dose_mg = ifelse(WT < 24, 10, 20),
    cohort  = "Paediatric WT-tiered (10 mg <24 kg, 20 mg >=24 kg)"
  )

stoch_cohort <- dplyr::bind_rows(adult_cohort, paed_cohort)

dose_rows <- stoch_cohort |>
  dplyr::transmute(id, time = 0, amt = dose_mg, evid = 1L,
                   cmt = "depot",
                   WT, FED, FORM_SYRUP, cohort)

obs_rows <- stoch_cohort |>
  tidyr::crossing(time = obs_grid) |>
  dplyr::transmute(id, time, amt = 0, evid = 0L,
                   cmt = NA_character_,
                   WT, FED, FORM_SYRUP, cohort)

events_stoch <- dplyr::bind_rows(dose_rows, obs_rows) |>
  dplyr::arrange(id, time, dplyr::desc(evid))

stopifnot(!anyDuplicated(unique(events_stoch[, c("id", "time", "evid")])))
sim_stoch <- rxode2::rxSolve(
  mod,
  events = events_stoch,
  keep   = c("WT", "FED", "FORM_SYRUP", "cohort")
) |>
  as.data.frame()
sim_quantiles <- sim_stoch |>
  dplyr::filter(time > 0, !is.na(Cc)) |>
  dplyr::group_by(cohort, time) |>
  dplyr::summarise(
    Q05 = stats::quantile(Cc, 0.05, na.rm = TRUE),
    Q50 = stats::quantile(Cc, 0.50, na.rm = TRUE),
    Q95 = stats::quantile(Cc, 0.95, na.rm = TRUE),
    .groups = "drop"
  )

ggplot(sim_quantiles, aes(time, Q50, colour = cohort, fill = cohort)) +
  geom_ribbon(aes(ymin = Q05, ymax = Q95), alpha = 0.2, colour = NA) +
  geom_line(linewidth = 0.7) +
  scale_y_log10() +
  labs(
    x = "Time after dose (h)",
    y = "Plasma epinastine (ng/mL)",
    colour = NULL, fill = NULL,
    title = "Adult vs paediatric epinastine exposure under WT-tiered dosing",
    caption = "Median and 5-95% prediction interval, n = 200 per cohort. Replicates the spirit of Sarashina 2005 Figure 6."
  ) +
  theme_bw() +
  theme(legend.position = "bottom",
        legend.text = element_text(size = 8))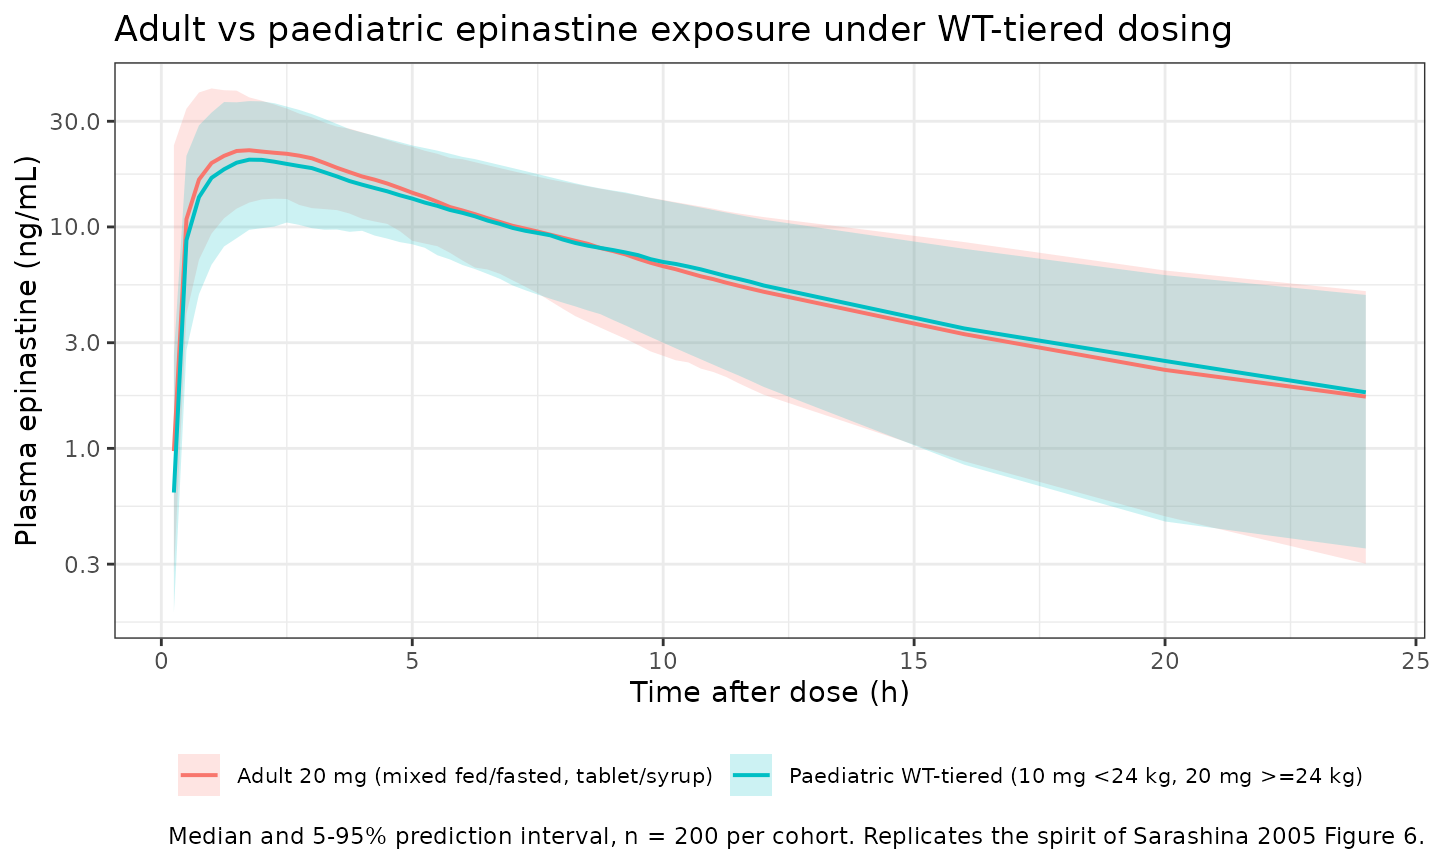
PKNCA validation
PKNCA NCA on the stochastic adult vs paediatric cohorts. The paediatric subjects receive WT-tiered doses (10 mg if WT < 24 kg, else 20 mg), so per-subject dose carries through from the cohort spec above.
# IMPORTANT: filter only on !is.na(Cc); never `time > 0` or `Cc > 0` -
# both would drop the pre-dose row PKNCA needs to anchor AUC0-*.
pkn_in <- sim_stoch |>
  dplyr::filter(!is.na(Cc)) |>
  dplyr::select(id, time, Cc, cohort)

# Defensive: guarantee a time = 0 row per (id, cohort) (extravascular
# pre-dose Cc = 0 is correct).
pkn_in <- dplyr::bind_rows(
  pkn_in,
  pkn_in |> dplyr::distinct(id, cohort) |>
    dplyr::mutate(time = 0, Cc = 0)
) |>
  dplyr::distinct(id, cohort, time, .keep_all = TRUE) |>
  dplyr::arrange(id, cohort, time)

dose_pkn <- dose_rows |>
  dplyr::transmute(id, time, amt, cohort)

conc_obj <- PKNCA::PKNCAconc(pkn_in, Cc ~ time | cohort + id,
                             concu = "ng/mL", timeu = "h")
dose_obj <- PKNCA::PKNCAdose(dose_pkn, amt ~ time | cohort + id,
                             doseu = "mg")

intervals <- data.frame(
  start      = 0,
  end        = Inf,
  cmax       = TRUE,
  tmax       = TRUE,
  aucinf.obs = TRUE,
  half.life  = TRUE
)

nca_data <- PKNCA::PKNCAdata(conc_obj, dose_obj, intervals = intervals)
nca_res  <- suppressWarnings(PKNCA::pk.nca(nca_data))
Comparison against published NCA
Sarashina 2005 reports the Bayesian PK-model-derived Cmax and AUC (mean +/- SD) for the adult 20 mg cohort and the paediatric WT-tiered cohort (Section “Results” final paragraph and Figure 6 caption). The comparison below puts the simulated medians next to the published means; an exact match is not expected because the published averages aggregate over the trial’s empirical fed/fasted / formulation / WT distribution, which is reproduced here only approximately.
sim_overall <- as.data.frame(nca_res$result)

reference <- tibble::tribble(
  ~cohort,                                              ~cmax, ~aucinf.obs,
  "Adult 20 mg (mixed fed/fasted, tablet/syrup)",        26.9,       281.6,
  "Paediatric WT-tiered (10 mg <24 kg, 20 mg >=24 kg)",  25.6,       246.8
)

cmp <- nlmixr2lib::ncaComparisonTable(
  simulated     = sim_overall,
  reference     = reference,
  by            = "cohort",
  params        = c("cmax", "aucinf.obs"),
  units         = c(cmax = "ng/mL", aucinf.obs = "ng*h/mL"),
  tolerance_pct = 25
)

knitr::kable(
  cmp,
  caption = paste(
    "Simulated vs published epinastine NCA. Reference values are the",
    "Bayesian model-derived population means reported by Sarashina 2005",
    "(adult 20 mg cohort and paediatric WT-tiered cohort). * differs",
    "from reference by >25%."
  )
)| NCA parameter | cohort | Reference | Simulated | % diff |
|---|---|---|---|---|
| Cmax (ng/mL) | Adult 20 mg (mixed fed/fasted, tablet/syrup) | 26.9 | 22.9 | -14.8% |
| Cmax (ng/mL) | Paediatric WT-tiered (10 mg <24 kg, 20 mg >=24 kg) | 25.6 | 20.9 | -18.2% |
| AUC0-∞ (obs) (ng*h/mL) | Adult 20 mg (mixed fed/fasted, tablet/syrup) | 282 | 209 | -25.9%* |
| AUC0-∞ (obs) (ng*h/mL) | Paediatric WT-tiered (10 mg <24 kg, 20 mg >=24 kg) | 247 | 204 | -17.2% |
The published food-effect and formulation-effect ratios reported in the Discussion provide additional sanity checks (Cmax fed/fasted = 0.67, AUC fed/fasted = 0.62, Cmax syrup/tablet = 0.82, AUC syrup/tablet = 0.91). The model’s parameters reproduce the AUC food effect within the limits of structural causality: AUC scales inversely with CL/F, so model AUC fed/fasted = 1 / theta6 = 1 / 1.41 = 0.71 (vs 0.62 reported) and AUC syrup/tablet = 1 / theta9 = 1 / 1.06 = 0.94 (vs 0.91 reported). The Cmax ratios depart further because Cmax also depends on V1/F, Ka, and the lag time, which all change between fed and fasted states in this model.
Assumptions and deviations
-
Linear-in-WT CL/F and V1/F reparameterised as
exp(lcl) * (1 + e_wt_cl * WT). The paper’s final-model equation isCL/F = (theta1 + WT * theta10) * food * formandV1/F = (theta2 + WT * theta11) * food. The packaged model encodes the algebraically identical formCL/F = exp(lcl) * (1 + e_wt_cl * WT) * food_cl * form_clwithlcl = log(theta1)ande_wt_cl = theta10 / theta1. This lets the model reuse the canonicallclande_wt_clparameter names without altering predictions. The trade-off is thatexp(lcl)is the y-intercept of the linear CL/F-vs-WT line (CL/F at WT = 0) rather than a CL/F at a clinically meaningful reference weight; the(1 + e_wt_cl * WT)factor at WT = 63 kg (adult mean) reproduces the paper’s typical-value adult CL/F. -
Approximate CV% in Table 4 maps to the Table 5 omega^2
values via
CV ~ sqrt(omega^2). Sarashina 2005’s Table 4 reports IIV in CV% (31.8% for CL/F, etc.) and Table 5 reports the underlying NONMEM omega^2 values (0.101 for CL/F, etc.).sqrt(0.101) = 0.318matches Table 4’s 31.8% exactly, confirming the paper uses the approximate identityCV ~ omegarather than the exact log-normalCV = sqrt(exp(omega^2) - 1). The model passes the Table 5 omega^2 values directly toetalcl ~ 0.101(etc.) as the variance of the log-scale eta. -
Tablet vs dry syrup encoded via
FORM_SYRUP. The canonicalFORM_SYRUPregister entry ininst/references/covariate-columns.mddefines0as the per-paper non-syrup comparator (capsule in the Nanga 2019 tacrolimus precedent). For Sarashina 2005 the comparator is tablet, documented in the model file’scovariateData[[FORM_SYRUP]]$notes. Per the register’s standing note, future syrup-vs-tablet comparisons reuse this canonical with the comparator documented per model rather than registering a sibling canonical. - Stochastic adult / paediatric cohorts approximate the trial’s empirical covariate distribution. WT is sampled from a truncated normal for adults (matching Table 2’s mean 63 kg / SD 6.9 kg / range 50-82 kg) and from a uniform for paediatric patients (14.1-68 kg). FED is approximated as 55% non-fasted in the adult cohort (matching the 607 fasting vs 724 non-fasting observation counts in Table 2) and 95% non-fasted in the paediatric cohort (10 vs 169). Adult formulation is approximated as 22.5% dry syrup (matching the 62 tablet vs 18 dry syrup subject split). Joint covariate distributions are sampled independently; the source paper does not publish per-subject covariate trios.
- No PD or efficacy endpoint. Sarashina 2005 fits a popPK model only; the paper provides no PD endpoint (e.g., wheal-and-flare, itch score) to validate against.
- Approximate vs exact AUC and Cmax ratios. The model’s predicted AUC food ratio (0.71) and AUC formulation ratio (0.94) follow directly from the CL/F parameterisation; the paper’s reported ratios (0.62, 0.91) come from observed-data subgroup analyses rather than model predictions and differ by ~14% and ~3% respectively. The discrepancy is informational, not a model bug - do not tune theta6 or theta9 to match the observed ratios.
- Paediatric dosing was per-trial-protocol multi-dose (12 weeks). Sarashina 2005’s paediatric arm received daily dosing for 12 weeks and contributed mostly trough-window samples; the simulation here exercises a single-dose case (sufficient for Cmax / AUC cross-checks because the model has no auto-induction or time-varying CL/F). Consumers needing a multi-dose paediatric steady-state simulation can repeat the dose row at daily intervals.