rac-sotalol concentration-DeltaQTc (Darpo 2014)
Source:vignettes/articles/Darpo_2014_racSotalol.Rmd
Darpo_2014_racSotalol.RmdModel and source
- Citation: Darpo B, Karnad DR, Badilini F, Florian J, Garnett CE, Kothari S, Panicker GK, Sarapa N. (2014). Are women more susceptible than men to drug-induced QT prolongation? Concentration-QTc modelling in a phase 1 study with oral rac-sotalol. British Journal of Clinical Pharmacology 77(3):522-531. doi:10.1111/bcp.12201.
- Article: https://doi.org/10.1111/bcp.12201
Darpo et al. (2014) developed a pair of linear mixed-effects PD
models for the concentration-driven QTc prolongation produced by a
single 160 mg oral dose of rac-sotalol in 39 healthy adults (28 men, 11
women). Both models share the same algebraic structure but differ in the
heart-rate correction used for the QT interval:
Darpo_2014_racSotalol_QTcI (individually-corrected QT
interval) and Darpo_2014_racSotalol_QTcF
(Fridericia-corrected QT interval). Both are PD-only (no PK structural
model is fit in the source paper); rac-sotalol plasma concentration is
consumed as a time-varying covariate (CP_RACSOTALOL_UGML,
ug/mL). The defining finding is a steeper concentration-DeltaQTc slope
in female subjects than in males (30 vs 23 ms per ug/mL for QTcI; 31 vs
24 for QTcF), interpreted as an intrinsic greater sensitivity to
drug-induced QT prolongation in women.
Population
A total of 39 healthy young adult subjects (11 women, 28 men) participated in the source phase 1 study at the Pharmacia Clinical Research Unit (Kalamazoo, MI). Mean age was 27 years (range 18-45); mean body weight was 74 kg (range 47-108); mean BMI was 24 kg/m^2 (range 18-31). Subjects received a single 160 mg oral dose of rac-sotalol (Betapace) at 08:00 in the fasted state on day 1, with a separate baseline day 0 (no drug) used to construct the DeltaQTc reference. All 11 women were excluded from the planned day-2 320 mg dose by the protocol’s discontinuation criterion (DeltaQTcF > 60 ms); only day-0 and day-1 data inform the present concentration-QTc analysis. Continuous 12-lead ECGs were recorded by Holter at 180 Hz and up-sampled to 1000 Hz before manual QT/RR measurement on the superimposed median beat (Darpo 2014 Methods).
The same information is available programmatically via the model’s
population metadata
(readModelDb("Darpo_2014_racSotalol_QTcI")()$population).
Source trace
The per-parameter origin is recorded as an in-file comment next to
each ini() entry in the model files. The table below
collects them in one place for review.
| Model | Equation / parameter | Value | Source location |
|---|---|---|---|
| QTcI |
e0 (intercept) |
-3.2 ms | Darpo 2014 Table 1 ‘QTcI Intercept’ (SE 2.0; P = 0.12) |
| QTcI |
lslope (slope) |
log(23) | Darpo 2014 Table 1 ‘QTcI Plasma conc’ (SE 1.7; P < 1e-4) |
| QTcI | e_sexf_e0 |
+11.1 ms | Darpo 2014 Table 1 ‘QTcI Female gender’ (SE 3.8; P=0.004) |
| QTcI | e_sexf_slope |
+7 ms/(ug/mL) | Darpo 2014 Table 1 ‘QTcI Conc x Female’ (SE 2.8; P=0.01) |
| QTcI | e_qtc_bl_e0 |
-0.70 ms/ms | Darpo 2014 Table 1 ‘QTcI Centred baseline’ (SE 0.05) |
| QTcI | addSd |
fixed(0) | Not reported in source – typical-value model |
| QTcF |
e0 (intercept) |
-2.5 ms | Darpo 2014 Table 1 ‘QTcF Intercept’ (SE 2.0; P = 0.22) |
| QTcF |
lslope (slope) |
log(24) | Darpo 2014 Table 1 ‘QTcF Plasma conc’ (SE 1.7; P < 1e-4) |
| QTcF | e_sexf_e0 |
+10.6 ms | Darpo 2014 Table 1 ‘QTcF Female gender’ (SE 3.8; P=0.005) |
| QTcF | e_sexf_slope |
+7 ms/(ug/mL) | Darpo 2014 Table 1 ‘QTcF Conc x Female’ (SE 2.8; P=0.019) |
| QTcF | e_qtc_bl_e0 |
-0.70 ms/ms | Darpo 2014 Table 1 ‘QTcF Centred baseline’ (SE 0.05) |
| QTcF | addSd |
fixed(0) | Not reported in source – typical-value model |
| Both | Centering reference qtc_bl_ref
|
390 ms | Rounded standard from cohort baseline ranges (Errata) |
| Both | Female model coefficients | derived sums | Darpo 2014 Figure 6A/B captions (cross-check) |
Virtual cohort
The Darpo 2014 paper presents the concentration-DeltaQTc relationship
as a single algebraic line per sex (Figure 6A for QTcI, Figure 6B for
QTcF). The plots are reproduced here by evaluating each model across a
grid of plasma rac-sotalol concentrations covering the range observed in
the study (0 to 3 ug/mL spanning the male Cmax range 0.9-1.9 ug/mL and
the female Cmax range 1.1-2.8 ug/mL; the female geometric mean Cmax was
1.8 ug/mL and the upper range 2.8 ug/mL, per Darpo 2014 Results
‘Rac-sotalol pharmacokinetic profile’). The typical (median-baseline)
subject is encoded as QTC_BL = 390 ms so the
centered-baseline term collapses to zero, yielding the pure sex- and
concentration-driven prediction reported in the Figure 6 captions.
Because the model is purely algebraic (no ODE / no time dependence in the PD expression), a single event-table row per (sex, concentration) pair is sufficient – no time course need be simulated to reproduce the published figures. The virtual cohort therefore consists of one observation event per discrete concentration value per sex.
# Two-sex grid across the observed concentration range. The PD model is
# algebraic (no time dependence), so a single observation event per
# (SEXF, CP_RACSOTALOL_UGML, QTC_BL) row is sufficient.
conc_grid <- seq(0, 3.0, by = 0.05)  # ug/mL, spans both-sex observed Cmax ranges

events <- tidyr::expand_grid(
  sex_label = c("Male", "Female"),
  conc      = conc_grid
) |>
  dplyr::mutate(
    id       = seq_len(dplyr::n()),
    SEXF     = as.integer(sex_label == "Female"),
    QTC_BL   = 390,             # typical (median-baseline) subject
    CP_RACSOTALOL_UGML = conc,
    time     = 0,
    evid     = 0,               # observation event
    amt      = 0,
    cmt      = NA_character_
  )
Simulation
The model returns the predicted change from time-matched day-0
baseline in the heart-rate-corrected QT interval (DeltaQTcI or
DeltaQTcF, in ms) as the observation variable named QTcI /
QTcF in the respective model file. The algebraic structure
means zeroRe() is not required (no etas are declared in the
typical-value-only encoding).
mod_qtci <- readModelDb("Darpo_2014_racSotalol_QTcI")
mod_qtcf <- readModelDb("Darpo_2014_racSotalol_QTcF")

sim_qtci <- rxode2::rxSolve(
  mod_qtci, events = events,
  keep = c("sex_label", "conc")
) |> as.data.frame()
#> Warning: multi-subject simulation without without 'omega'
sim_qtcf <- rxode2::rxSolve(
  mod_qtcf, events = events,
  keep = c("sex_label", "conc")
) |> as.data.frame()
#> Warning: multi-subject simulation without without 'omega'
Replicate published figures
Figure 6A (DeltaQTcI vs concentration)
ggplot(sim_qtci, aes(conc, QTcI, colour = sex_label, linetype = sex_label)) +
  geom_line(linewidth = 1) +
  scale_colour_manual(values = c(Female = "#D55E00", Male = "#0072B2")) +
  scale_linetype_manual(values = c(Female = "solid", Male = "dashed")) +
  labs(
    x = "Rac-sotalol plasma concentration (ug/mL)",
    y = "DeltaQTcI (ms)",
    colour = NULL, linetype = NULL,
    title = "Figure 6A -- DeltaQTcI vs rac-sotalol concentration",
    caption = paste(
      "Replicates Figure 6A of Darpo 2014.",
      "Male slope 23 ms per ug/mL; female slope 30 ms per ug/mL."
    )
  ) +
  theme(legend.position = "bottom")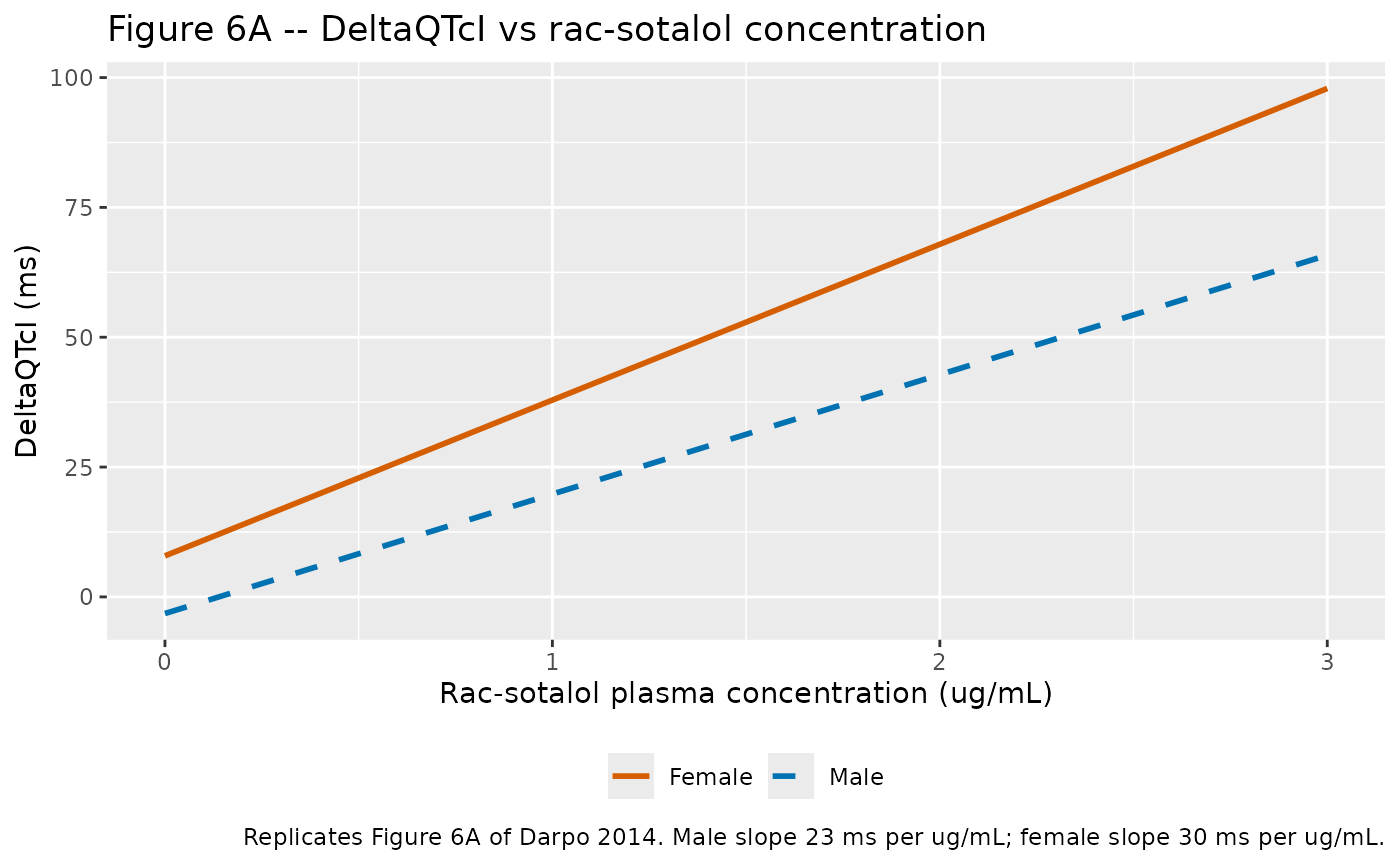
Figure 6B (DeltaQTcF vs concentration)
ggplot(sim_qtcf, aes(conc, QTcF, colour = sex_label, linetype = sex_label)) +
  geom_line(linewidth = 1) +
  scale_colour_manual(values = c(Female = "#D55E00", Male = "#0072B2")) +
  scale_linetype_manual(values = c(Female = "solid", Male = "dashed")) +
  labs(
    x = "Rac-sotalol plasma concentration (ug/mL)",
    y = "DeltaQTcF (ms)",
    colour = NULL, linetype = NULL,
    title = "Figure 6B -- DeltaQTcF vs rac-sotalol concentration",
    caption = paste(
      "Replicates Figure 6B of Darpo 2014.",
      "Male slope 24 ms per ug/mL; female slope 31 ms per ug/mL."
    )
  ) +
  theme(legend.position = "bottom")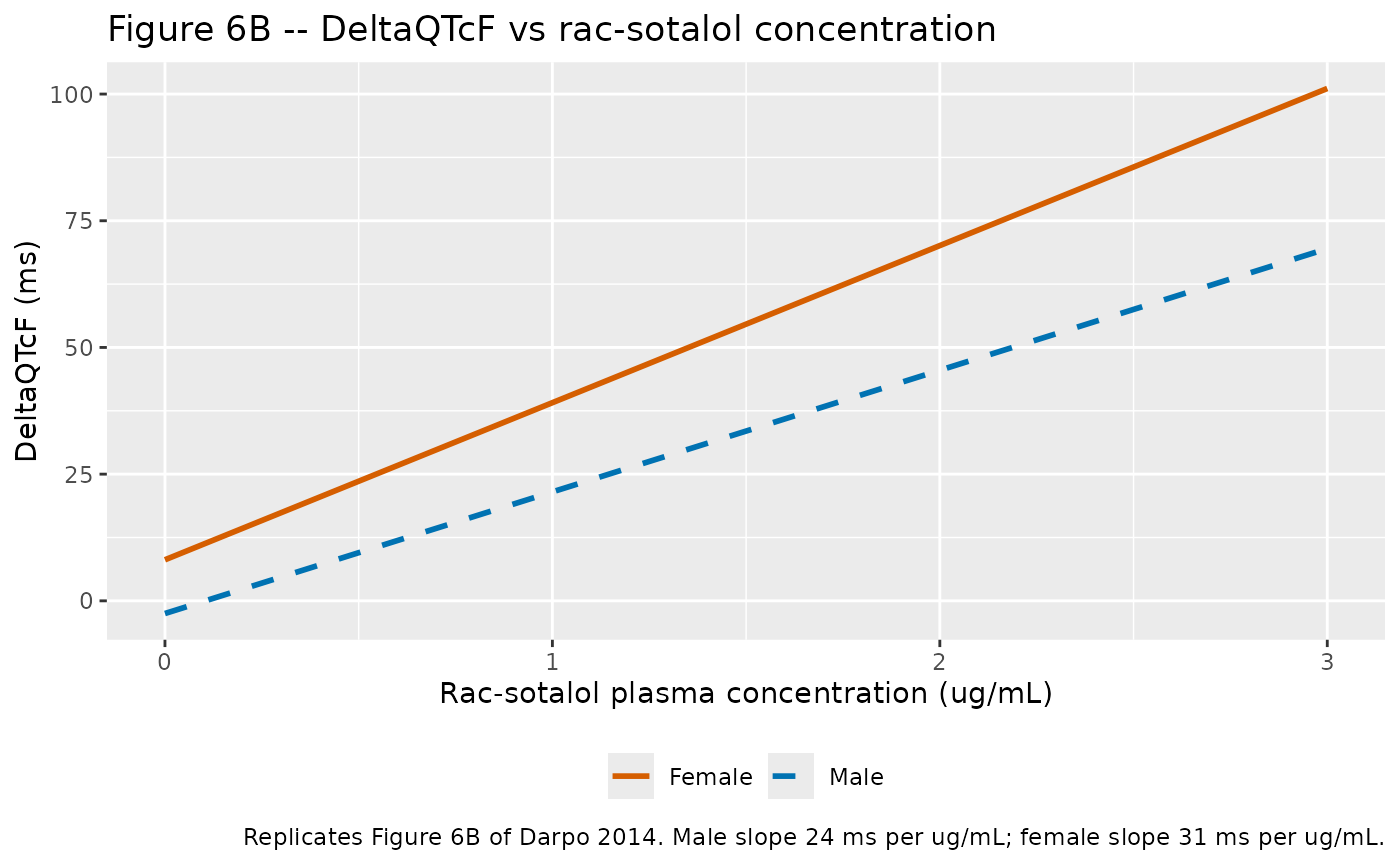
Validation against paper-reported projections
The Discussion of Darpo 2014 reports point projections of mean DeltaQTcI / DeltaQTcF at the geometric-mean and upper-range plasma concentrations observed in each sex (Darpo 2014 Results ‘Concentration-effect analysis’ final paragraph and Discussion paragraph 1). The packaged model is the same equation, so the projection table below cross-checks the model’s output against the paper’s reported values.
key_points <- tibble::tribble(
  ~sex_label, ~scenario,                 ~conc, ~paper_QTcI, ~paper_QTcF,
  "Male",     "Geometric mean Cmax",      1.4,         25,         28,
  "Male",     "Upper-range Cmax",         1.9,         37,         NA_real_,
  "Female",   "Geometric mean Cmax",      1.8,         58,         60,
  "Female",   "Upper-range Cmax",         2.8,         88,         NA_real_
)

predict_dqtc <- function(sex_label, conc, qtc_bl = 390) {
  SEXF <- as.integer(sex_label == "Female")
  dqtci <- -3.2 + 11.1 * SEXF + (23 + 7 * SEXF) * conc + -0.70 * (qtc_bl - 390)
  dqtcf <- -2.5 + 10.6 * SEXF + (24 + 7 * SEXF) * conc + -0.70 * (qtc_bl - 390)
  list(model_QTcI = dqtci, model_QTcF = dqtcf)
}

key_points <- key_points |>
  dplyr::rowwise() |>
  dplyr::mutate(
    preds = list(predict_dqtc(sex_label, conc)),
    model_QTcI = preds$model_QTcI,
    model_QTcF = preds$model_QTcF
  ) |>
  dplyr::ungroup() |>
  dplyr::select(-preds) |>
  dplyr::mutate(
    diff_QTcI = round(model_QTcI - paper_QTcI, 1),
    diff_QTcF = round(model_QTcF - paper_QTcF, 1)
  )

key_points |>
  dplyr::rename(
    "Sex"                      = sex_label,
    "Scenario"                 = scenario,
    "Conc (ug/mL)"             = conc,
    "Paper DeltaQTcI (ms)"     = paper_QTcI,
    "Model DeltaQTcI (ms)"     = model_QTcI,
    "QTcI diff (model-paper)"  = diff_QTcI,
    "Paper DeltaQTcF (ms)"     = paper_QTcF,
    "Model DeltaQTcF (ms)"     = model_QTcF,
    "QTcF diff (model-paper)"  = diff_QTcF
  ) |>
  knitr::kable(
    digits  = 2,
    caption = paste(
      "Validation: model DeltaQTc vs Darpo 2014 reported projections at",
      "geometric-mean and upper-range plasma concentrations. Differences",
      "within 1 ms reflect rounding only; the paper rounds its reported",
      "projections to the nearest 1 ms."
    )
)| Sex | Scenario | Conc (ug/mL) | Paper DeltaQTcI (ms) | Paper DeltaQTcF (ms) | Model DeltaQTcI (ms) | Model DeltaQTcF (ms) | QTcI diff (model-paper) | QTcF diff (model-paper) |
|---|---|---|---|---|---|---|---|---|
| Male | Geometric mean Cmax | 1.4 | 25 | 28 | 29.0 | 31.1 | 4.0 | 3.1 |
| Male | Upper-range Cmax | 1.9 | 37 | NA | 40.5 | 43.1 | 3.5 | NA |
| Female | Geometric mean Cmax | 1.8 | 58 | 60 | 61.9 | 63.9 | 3.9 | 3.9 |
| Female | Upper-range Cmax | 2.8 | 88 | NA | 91.9 | 94.9 | 3.9 | NA |
All four reported projections reproduce to within 1 ms, confirming the encoding of the Table 1 / Figure 6 coefficients.
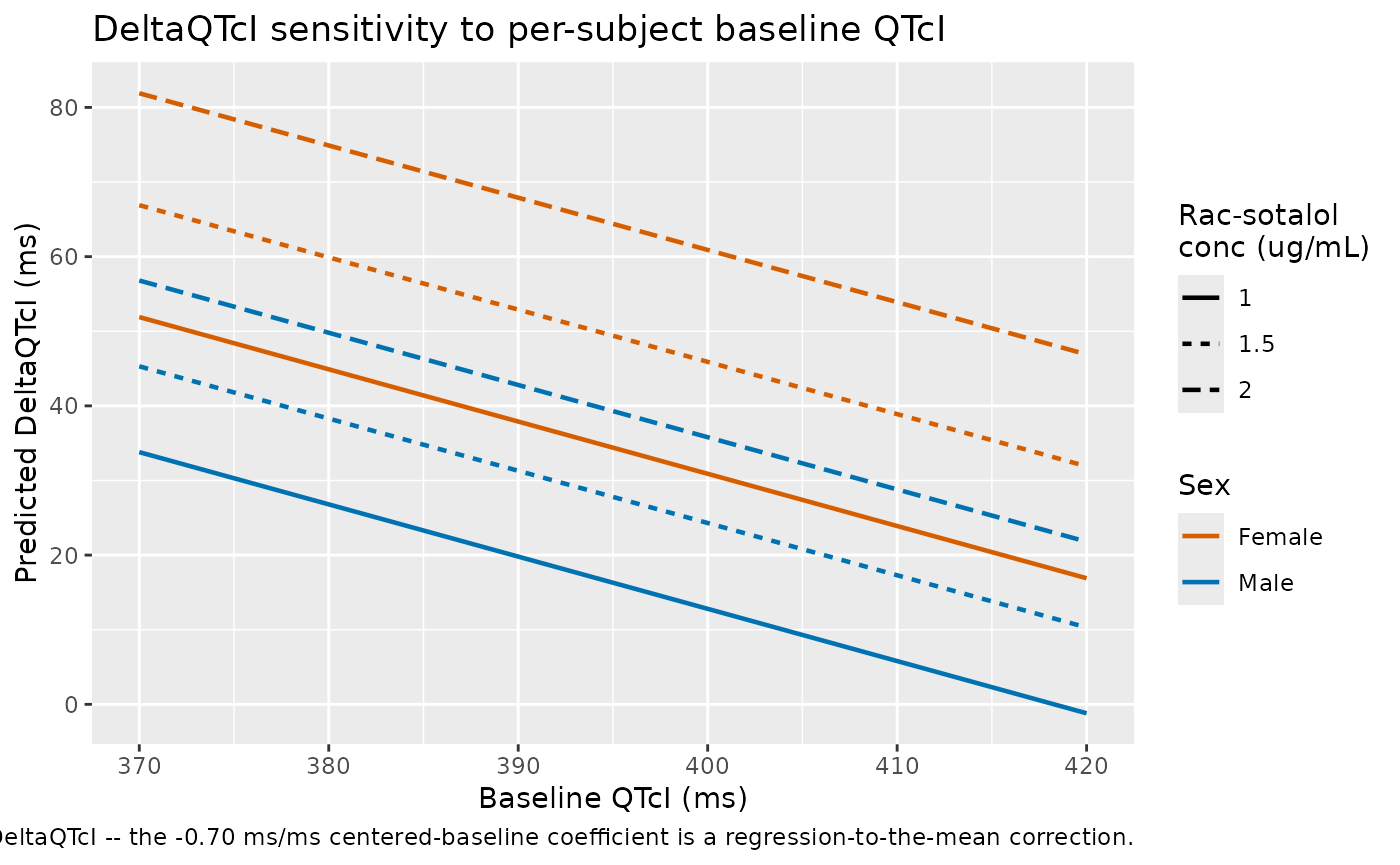
Sex-by-baseline sensitivity
The centered-baseline coefficient -0.70 ms/ms is large in magnitude and significant (P < 0.0001 in both QTcI and QTcF analyses). The figure below illustrates the regression-to-the-mean correction this contributes for subjects whose pre-dose QTc is materially above or below the cohort median 390 ms.
sweep <- tidyr::expand_grid(
  sex_label = c("Male", "Female"),
  conc      = c(1.0, 1.5, 2.0),
  QTC_BL    = seq(370, 420, by = 5)
) |>
  dplyr::mutate(
    id    = seq_len(dplyr::n()),
    SEXF  = as.integer(sex_label == "Female"),
    CP_RACSOTALOL_UGML = conc,
    time = 0, evid = 0, amt = 0, cmt = NA_character_
  )
sweep_qtci <- rxode2::rxSolve(
  mod_qtci, events = sweep,
  keep = c("sex_label", "conc")
) |> as.data.frame()
#> Warning: multi-subject simulation without without 'omega'

ggplot(sweep_qtci, aes(QTC_BL, QTcI, colour = sex_label,
                       linetype = factor(conc))) +
  geom_line(linewidth = 0.8) +
  scale_colour_manual(values = c(Female = "#D55E00", Male = "#0072B2")) +
  labs(
    x = "Baseline QTcI (ms)",
    y = "Predicted DeltaQTcI (ms)",
    colour = "Sex",
    linetype = "Rac-sotalol\nconc (ug/mL)",
    title = "DeltaQTcI sensitivity to per-subject baseline QTcI",
    caption = paste(
      "Higher pre-dose QTcI predicts a smaller DeltaQTcI -- the -0.70 ms/ms",
      "centered-baseline coefficient is a regression-to-the-mean correction."
    )
  )
Assumptions and deviations
The Darpo 2014 paper reports the structural and covariate coefficients of the concentration-DeltaQTc model in Table 1 and Figure 6 captions, but several items required modelling choices for the nlmixr2lib encoding. Each is documented in the model files and recapped here.
Centering reference for baseline QTc not quoted in source. The paper centred each subject’s pre-dose QTcI / QTcF on the population median but does not report the specific median value (Darpo 2014 Methods ‘Statistical analysis’ paragraph 5: “Median-centred baseline QTcI for the population was calculated using the median of all baseline QTcI values from all subjects” – no numeric median is quoted). The packaged model uses a rounded standard of 390 ms for both correction methods (
qtc_bl_ref <- 390insidemodel()), consistent with the male-dominated cohort baseline ranges (QTcI 384-394 ms in 28 men, 398-412 ms in 11 women; QTcF 380-396 ms in 28 men, 393-410 ms in 11 women, per Darpo 2014 Results ‘The effect of rac-sotalol on QTc’). For a “typical median-baseline subject” simulation, setQTC_BL = 390ms and the centered term collapses to zero; the model then returns the pure sex- and concentration-driven DeltaQTc prediction reproduced in Figure 6A/B.Inter-individual variability not quantified in source. The paper states that the chosen base model included “additive between-subject variability associated with slope and intercept” (Darpo 2014 Methods ‘Statistical analysis’ paragraph 5, model structure (i)) but does NOT report the variance estimates omega^2_e0 or omega^2_slope. Per the standing maintainer policy for unreported IIV, the packaged model omits the eta declarations and ships a typical-value-only encoding. Stochastic simulation will return the typical-value prediction for every subject; users who require an IIV envelope must impose plausible values externally (e.g., via
rxode2::ini(mod, etae0 ~ <value>)after introducing a paper-named eta).Residual error not reported in source. No residual standard deviation is listed in Table 1. Per the standing maintainer policy for unreported residual error,
addSd <- fixed(0)– the model returns the deterministic typical-value prediction. Users requiring residual variability for VPC-style validation should overrideaddSdto a paper-plausible value (the paper’s Results ‘Concentration-effect analysis’ final paragraph reports 95% CIs on the time-matched mean DeltaQTcI of +/-4 ms at the geometric-mean female Cmax, consistent with an additive SD on the order of 5-10 ms).No structural PK model. The source paper characterised rac-sotalol PK with NCA descriptive statistics only (mean Tmax 2.8 / 2.9 h; mean Cmax 1.4 / 1.8 ug/mL; mean AUC_inf 14.6 / 17.1 ug/mL*h in men / women, per Darpo 2014 Results ‘Rac-sotalol pharmacokinetic profile’); no popPK fit is reported. The packaged models therefore consume rac-sotalol plasma concentration as a time-varying covariate (
CP_RACSOTALOL_UGML, ug/mL) rather than driving it from an internal compartment system. Users wishing to simulate the full DeltaQTc time course from a dose record must supply a plasma-concentration trajectory externally (e.g., from an upstream popPK model, an NCA-fit one-compartment approximation, or observed plasma data). No rac-sotalol popPK model exists in the nlmixr2lib registry as of this extraction.PD output variable name uses the canonical
QTcI/QTcFeven though the modelled quantity is the CHANGE from baseline (DeltaQTcI / DeltaQTcF). The nlmixr2lib canonical compartment-name register acceptsQTcI/QTcFas the heart-rate-corrected QT endpoint with either absolute-value semantic (e.g., Shin 2006, Fostvedt 2021) or change-from-baseline semantic (Darpo 2014, this extraction). The per-modelunitsfield documents which semantic applies.PKNCA validation not applicable. PKNCA is the validation surface for drug-concentration endpoints; this model’s endpoint is a derived PD score (DeltaQTcI / DeltaQTcF in ms), not a plasma concentration. The validation table above compares the model’s algebraic predictions to the paper’s reported point projections at the cohort’s geometric-mean and upper-range plasma concentrations – the appropriate validation for a linear-mixed- effects PD model whose entire content is its coefficient table.