GHB brain uptake at the blood-brain barrier (Roiko 2012)
Source:vignettes/articles/Roiko_2012_ghb_brain_uptake.Rmd
Roiko_2012_ghb_brain_uptake.RmdModel and source
Roiko, Felmlee and Morris characterised the brain distribution of the
drug of abuse gamma-hydroxybutyric acid (GHB) in two ways: by in vivo
microdialysis of the rat frontal cortex after intravenous doses of 400,
600 and 800 mg/kg, and by concentration-dependent uptake of
[3H]GHB into two immortalised brain capillary endothelial
cell lines used as in vitro models of the blood-brain barrier.
Only the in vitro arm produced a fitted model. The in vivo arm was analysed noncompartmentally in Phoenix WinNonlin 6.0 (log-linear trapezoidal AUC, AUC ratios for the partition coefficient, one-way ANOVA on sleep times), so it carries no structural parameters and is not extracted. Its published numbers are used below as the in vivo context against which the in vitro Michaelis constant is interpreted, which is exactly the argument the paper itself makes.
The in vitro arm produced two independent weighted-nonlinear-regression fits, one per cell line, so it is packaged as two model files:
rbe4 <- rxode2::rxode(readModelDb("Roiko_2012_ghb_rbe4"))       # rat cell line
hcmec <- rxode2::rxode(readModelDb("Roiko_2012_ghb_hcmecd3")) # human cell line- Citation: Roiko SA, Felmlee MA, Morris ME. Brain uptake of the drug of abuse gamma-hydroxybutyric acid in rats. Drug Metab Dispos. 2012;40(1):212-218. doi:10.1124/dmd.111.041749. PMID: 22019629. PMCID: PMC3250048. Michaelis-Menten equation and the two rejected alternatives: Materials and Methods, ‘Data and Statistical Analysis’, equations 2, 3 and 4. Km and Vmax estimates for RBE4 cells: Results, ‘GHB Uptake in Brain Endothelial Cells’, and the Abstract; the fitted curve is Figure 6B. Uptake time course and incubation design: Materials and Methods, ‘GHB Cell Uptake Studies’, and Figure 6A. Plasma and brain extracellular-fluid concentrations used as the in vivo context: Tables 1 and 2.
- Article: https://doi.org/10.1124/dmd.111.041749
- PubMed Central: https://www.ncbi.nlm.nih.gov/pmc/articles/PMC3250048/
Descriptions:
-
Roiko_2012_ghb_rbe4— In vitro (RBE4 rat brain capillary endothelial cell line). Michaelis-Menten model of the carrier-mediated uptake of the drug of abuse gamma-hydroxybutyric acid (GHB) across an in vitro model of the rat blood-brain barrier. The published fit is the single-transporter Michaelis-Menten velocity v = Vmax * C / (Km + C) (equation 2 of the source), where C is the GHB concentration in the uptake buffer and v the uptake rate normalised to cell protein; a Michaelis-Menten route plus a parallel diffusional clearance (equation 3) and a two-transporter model (equation 4) were both fitted and rejected on Akaike information criterion, coefficient of variation and residual plots, so no passive-diffusion term is carried here. Uptake was linear through 30 s, and the concentration-response was measured at a 15 s incubation, so the buffer concentration is held static and the model describes initial-rate conditions. GHB is a substrate of the proton-dependent monocarboxylate transporters MCT1, MCT2 and MCT4, of which MCT1 predominates in RBE4 cells; the fitted Km of 23.3 mM lies above the peak plasma GHB concentrations of 8.4 to 15.6 mM reached at the 400 to 800 mg/kg intravenous doses studied in the same paper, which is the quantitative basis for the paper’s conclusion that GHB brain uptake is not capacity-limited over that dose range. Sibling model: Roiko_2012_ghb_hcmecd3, the same uptake reaction characterised in the human brain capillary endothelial cell line hCMEC/D3. -
Roiko_2012_ghb_hcmecd3— In vitro (hCMEC/D3 human brain capillary endothelial cell line). Michaelis-Menten model of the carrier-mediated uptake of the drug of abuse gamma-hydroxybutyric acid (GHB) across an in vitro model of the human blood-brain barrier. The published fit is the single-transporter Michaelis-Menten velocity v = Vmax * C / (Km + C) (equation 2 of the source), where C is the GHB concentration in the uptake buffer and v the uptake rate normalised to cell protein; a Michaelis-Menten route plus a parallel diffusional clearance (equation 3) and a two-transporter model (equation 4) were both fitted and rejected on Akaike information criterion, coefficient of variation and residual plots, so no passive-diffusion term is carried here. Uptake was linear through 30 s, and the concentration-response was measured at a 15 s incubation, so the buffer concentration is held static and the model describes initial-rate conditions. GHB is a substrate of the proton-dependent monocarboxylate transporters MCT1, MCT2 and MCT4, of which MCT1 and MCT4 messenger RNA have been detected in hCMEC/D3 cells; the human Km of 18.1 mM is slightly lower and the human Vmax slightly lower than the rat estimates, so the two cell lines describe near-identical uptake kinetics. Sibling model: Roiko_2012_ghb_rbe4, the same uptake reaction characterised in the rat brain capillary endothelial cell line RBE4.
Population
Both models describe cell monolayers, not subjects.
Roiko_2012_ghb_rbe4 was fitted to the immortalised
rat brain capillary endothelial line RBE4 (passages 39
to 44) and Roiko_2012_ghb_hcmecd3 to the immortalised
human line hCMEC/D3 (passages 28 to 33), both provided
by Prof. P. Couraud. Cells were grown to confluence on type-I
rat-tail-collagen-coated 35 mm wells, equilibrated for 30 min at 37 C in
an uptake buffer at pH 7.4, brought to room temperature for 5 min, and
then incubated with GHB at 0.01, 0.1, 1, 3, 5, 10, 30 and 50 mM for 15
s. Each point is the mean of three experiments performed in
triplicate.
The 15 s incubation was chosen deliberately: a separate time-course
experiment with 58 nM [3H]GHB showed rapid
linear uptake through 30 s, so the
concentration-response was measured under initial-rate conditions in
which substrate depletion and loss of radiolabel are negligible.
The companion in vivo arm dosed male Sprague-Dawley rats (280 to 320 g, n = 4 per dose) with GHB 400, 600 or 800 mg/kg intravenously and sampled plasma and frontal-cortex extracellular fluid for 6 h.
The same information is available programmatically:
str(rbe4$population, max.level = 1)
#> List of 12
#>  $ species            : chr "in vitro (RBE4 rat brain capillary endothelial cell line)"
#>  $ n_subjects         : int NA
#>  $ n_studies          : int 1
#>  $ organism           : chr "Immortalised rat brain capillary endothelial cell line RBE4, passages 39 to 44, provided by Prof. P. Couraud (U"| __truncated__
#>  $ system             : chr "Confluent monolayers plated on individual type-I rat-tail-collagen-coated 35 mm wells, grown in 1:1 alpha-minim"| __truncated__
#>  $ medium             : chr "Uptake buffer containing NaCl 138 mM, CaCl2 1.8 mM, KCl 5.4 mM, MgSO4 0.8 mM, Na2HPO4 1.0 mM, D-glucose 5.5 mM "| __truncated__
#>  $ temperature        : chr "Cells equilibrated 30 min at 37 C, then equilibrated to room temperature for 5 min; all uptake incubations were"| __truncated__
#>  $ incubation_time    : chr "15 s for the concentration-dependence experiment, chosen to minimise loss due to metabolism and loss of the rad"| __truncated__
#>  $ concentration_range: chr "Materials and Methods lists 0.01, 0.1, 1, 3, 5, 10, 30 and 50 mM GHB and the Results describe the fitted range "| __truncated__
#>  $ replication        : chr "Mean +/- S.D. of three experiments, each performed in triplicate (Figure 6)"
#>  $ disease_state      : chr "not applicable (in vitro)"
#>  $ notes              : chr "The companion in vivo arm of the same paper dosed male Sprague-Dawley rats (280 to 320 g) with GHB 400, 600 or "| __truncated__
Source trace
Every ini() entry carries an in-file comment naming its
source location. They are collected here for review.
| Equation / parameter | Value | Source location |
|---|---|---|
| Uptake rate law, v = Vmax * C / (Km + C) | equation 2 | Materials and Methods, ‘Data and Statistical Analysis’; selected over equations 3 and 4 on AIC, CV% and residual plots |
| Km (RBE4, rat) | 23.3 +/- 5 mM | Results, ‘GHB Uptake in Brain Endothelial Cells’; Abstract; Figure 6B |
| Vmax (RBE4, rat) | 258 +/- 41 pmol/mg/min | Results, ‘GHB Uptake in Brain Endothelial Cells’; Abstract; Figure 6B |
| Km (hCMEC/D3, human) | 18.1 +/- 3 mM | Results, ‘GHB Uptake in Brain Endothelial Cells’; Abstract; Figure 6D |
| Vmax (hCMEC/D3, human) | 248 +/- 34 pmol/mg/min | Results, ‘GHB Uptake in Brain Endothelial Cells’; Abstract; Figure 6D |
| Incubation time, 15 s | 0.25 min | Materials and Methods, ‘GHB Cell Uptake Studies’ |
| Linear-uptake window, 30 s | 0.5 min | Results, ‘GHB Uptake in Brain Endothelial Cells’; Figures 6A and 6C |
| Studied concentrations | 0.01 to 50 mM | Materials and Methods, ‘GHB Cell Uptake Studies’; but see the Errata note on Figures 6B and 6D |
| Residual error | not reported (held at 0) | Materials and Methods, ‘Data and Statistical Analysis’ names only ‘weighted nonlinear regression analysis’ |
| Plasma Cmax by dose | 8.4, 11.7, 15.6 mM | Table 1 (400, 600, 800 mg/kg) |
| Brain ECF / plasma partition coefficient | 0.079, 0.070, 0.070 | Table 2 (400, 600, 800 mg/kg) |
A free transcription check falls out of the paper’s own duplication:
the Abstract reports the estimates species-first as
Km = 18.1 mM (human), 23.3 mM (rat) and
Vmax = 248 and 258 pmol/mg/min for human and rat, while the
Results report them cell-line-first as 23.3 mM / 258 for
RBE4 and 18.1 mM / 248 for hCMEC/D3. The two passages list
the species in opposite order, so a swapped assignment
in either model file would contradict one of them.
Dimensional analysis
Mechanistic models are where unit errors hide, so every term is written out.
| Symbol | Units | Role |
|---|---|---|
| ghb_buffer | mM | GHB concentration in the uptake buffer; a state so that it can be set by a dosing record, but held constant by d/dt = 0 |
| ghb_cell | pmol / mg cell protein | GHB accumulated inside the monolayer; what the scintillation counter measures after normalising to protein |
| km_uptake | mM | Michaelis constant; same units as ghb_buffer, as the sum Km + C requires |
| vmax_uptake | pmol / mg protein / min | Maximum uptake velocity |
| vGhbUptake | pmol / mg protein / min | vmax_uptake * (mM / mM) = vmax_uptake units; the fitted endpoint of Figures 6B and 6D |
| d/dt(ghb_cell) | pmol / mg protein / min | equals vGhbUptake, so the state integrates to pmol / mg protein |
| vmax_uptake / km_uptake | pmol / mg protein / min / mM = nL / mg protein / min | low-concentration limit of the uptake clearance |
The Michaelis-Menten quotient is dimensionless in C, so
vGhbUptake inherits the units of vmax_uptake
exactly and d/dt(ghb_cell) is consistent with a state in
pmol / mg protein on a min time base. There is
no unit conversion anywhere in either model() block — the
paper’s Km is already in the units of its own
C axis, which is why no /1000 bridge of the
kind needed for microsomal models appears here.
Simulation helper
The in vitro “dose” is the GHB concentration placed in the buffer at
time zero, so each studied concentration is simulated as its own
subject. Observation records are placed on the ODE state
ghb_buffer; rxode2 returns the algebraic
observable vGhbUptake alongside it.
uptakeEvents <- function(conc, times) {
  dose <- data.frame(
    id = seq_along(conc), time = 0, amt = conc,
    evid = 1L, cmt = "ghb_buffer"
  )
  obs <- expand.grid(id = seq_along(conc), time = times)
  obs$amt <- NA_real_
  obs$evid <- 0L
  obs$cmt <- "ghb_buffer"
  ev <- rbind(dose, obs[, names(dose)])
  ev[order(ev$id, ev$time, -ev$evid), ]
}

solveUptake <- function(model, conc, times = c(0, 0.25)) {
  ev <- uptakeEvents(conc, times)
  # Both models this is called with (rbe4, hcmecd3) are eta-free, so no
  # `omega = NA` is needed -- and passing it errors on the released rxode2
  # (5.1.6: "invalid 'times' argument").
  out <- rxode2::rxSolve(model, ev, returnType = "data.frame")
  # rxSolve omits the `id` column when only one subject is solved, so it is
  # restored here before it is used to look the concentration back up.
  out$id <- if (is.null(out$id)) 1L else as.integer(as.character(out$id))
  out$conc <- conc[out$id]
  out
}
Validation 1: structural identities of the fitted rate law
These are exact algebraic consequences of equation 2. Both sides of each check use the same parameter values, so the only difference is solver round-off and a tight bound is the correct assertion.
kmRat <- 23.3
kmHuman <- 18.1
vmaxRat <- 258
vmaxHuman <- 248

# (a) v at C = Km must be exactly Vmax / 2.
halfRat <- solveUptake(rbe4, kmRat) %>% dplyr::filter(time == 0.25)
halfHuman <- solveUptake(hcmec, kmHuman) %>% dplyr::filter(time == 0.25)

stopifnot(
  abs(halfRat$vGhbUptake - vmaxRat / 2) < 1e-8,
  abs(halfHuman$vGhbUptake - vmaxHuman / 2) < 1e-8
)

# (b) Eadie-Hofstee: regressing v on v/C must give slope -Km and intercept Vmax.
studied <- c(0.01, 0.1, 1, 3, 5, 10, 30, 50)
ehRat <- solveUptake(rbe4, studied) %>%
  dplyr::filter(time == 0.25) %>%
  dplyr::mutate(vOverC = vGhbUptake / conc)
#> Warning: multi-subject simulation without without 'omega'
fitRat <- stats::lm(vGhbUptake ~ vOverC, data = ehRat)

stopifnot(
  abs(unname(stats::coef(fitRat)[["vOverC"]]) + kmRat) < 1e-6,
  abs(unname(stats::coef(fitRat)[["(Intercept)"]]) - vmaxRat) < 1e-6
)

round(stats::coef(fitRat), 6)
#> (Intercept)      vOverC
#>       258.0       -23.3
# (c) Initial-rate conditions: because the buffer is held static, accumulation
#     over the 15 s incubation must be exactly 0.25 min * v -- i.e. the model is
#     in the linear window the authors measured (uptake linear through 30 s)
#     rather than in a depleting regime.
linRat <- solveUptake(rbe4, studied, times = c(0, 0.25, 0.5)) %>%
  dplyr::filter(time > 0)
#> Warning: multi-subject simulation without without 'omega'

stopifnot(
  max(abs(linRat$ghb_cell - linRat$time * linRat$vGhbUptake)) < 1e-8
)
Validation 2: replicating Figures 6B and 6D
The fitted curve is the paper’s own published fit, so reproducing it confirms that the packaged parameters generate the plotted relationship. Points mark the eight concentrations actually studied.
grid <- sort(unique(c(studied, exp(seq(log(0.01), log(50), length.out = 120)))))

curves <- dplyr::bind_rows(
  solveUptake(rbe4, grid) %>% dplyr::mutate(cellLine = "RBE4 (rat)"),
  solveUptake(hcmec, grid) %>% dplyr::mutate(cellLine = "hCMEC/D3 (human)")
) %>%
  dplyr::filter(time == 0.25)
#> Warning: multi-subject simulation without without 'omega'
#> Warning: multi-subject simulation without without 'omega'

points <- curves %>% dplyr::filter(conc %in% studied)

ggplot2::ggplot(curves, ggplot2::aes(conc, vGhbUptake, colour = cellLine)) +
  ggplot2::geom_line(linewidth = 0.8) +
  ggplot2::geom_point(data = points, size = 2) +
  ggplot2::labs(
    x = "GHB concentration in buffer (mM)",
    y = "GHB uptake rate (pmol/mg protein/min)",
    colour = "Cell line"
  ) +
  ggplot2::theme_bw()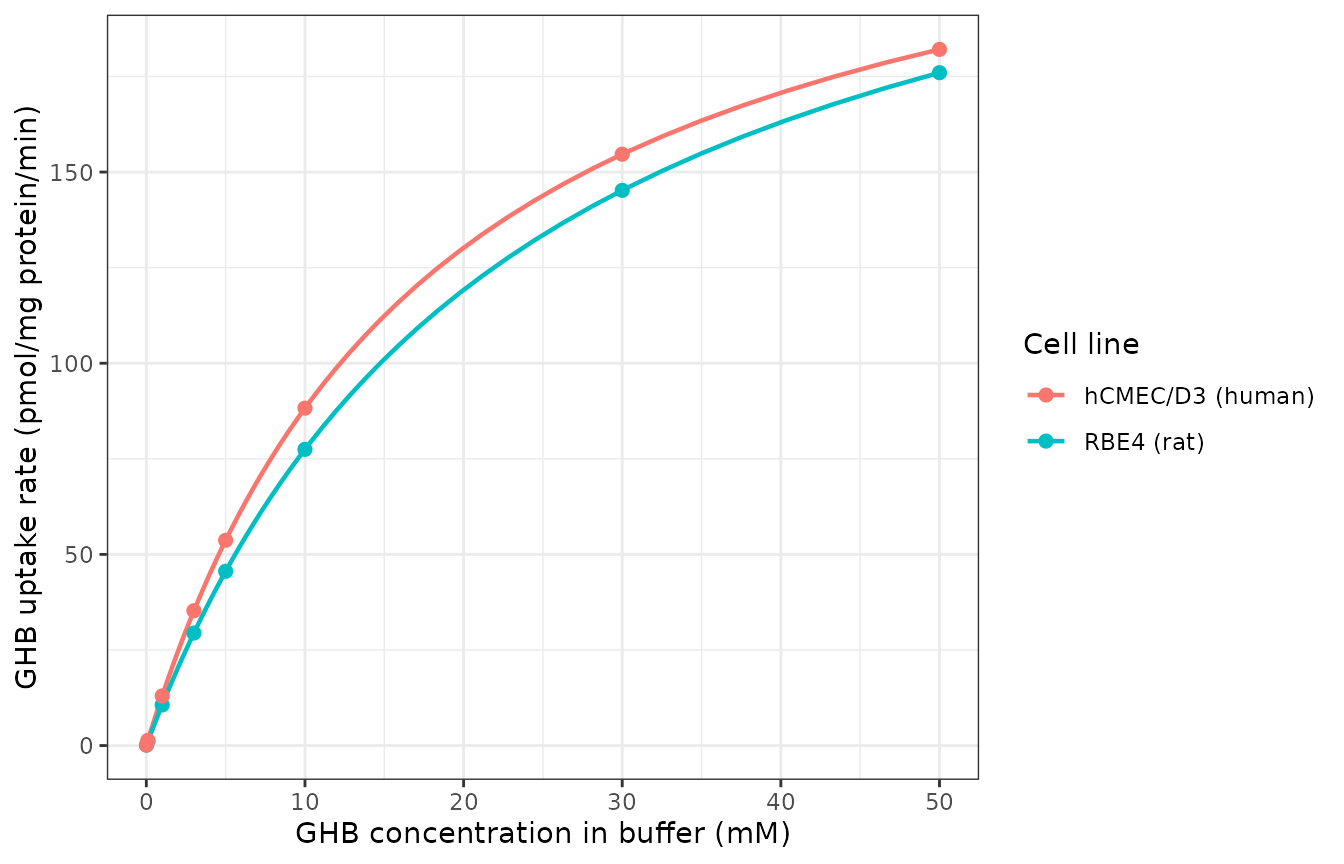
Replicates Figures 6B (RBE4, rat) and 6D (hCMEC/D3, human) of Roiko 2012: concentration-dependent uptake of GHB in brain capillary endothelial cells at pH 7.4, 15 s incubation.
The published panels are the sharper test, because the curve
drawn through the data in Figures 6B and 6D is the authors’ own fit and
therefore encodes Km and Vmax jointly. Values
read off those printed curves are compared with the packaged models
below.
# PROVENANCE: these targets were read off the printed fitted curves of
# Figures 6B and 6D at 200 dpi. They are graphical reads, not tabulated
# values -- the paper prints no velocity table -- so the tolerance is set to
# 10%, which is wider than the reading error and far tighter than the
# difference a mis-transcribed constant would produce.
readoff <- tibble::tribble(
  ~cellLine,           ~conc, ~published,
  "RBE4 (rat)",           10,        78,
  "RBE4 (rat)",           30,       145,
  "RBE4 (rat)",           50,       175,
  "hCMEC/D3 (human)",     10,        90,
  "hCMEC/D3 (human)",     30,       152
)

predicted <- dplyr::bind_rows(
  solveUptake(rbe4, c(10, 30, 50)) %>% dplyr::mutate(cellLine = "RBE4 (rat)"),
  solveUptake(hcmec, c(10, 30)) %>% dplyr::mutate(cellLine = "hCMEC/D3 (human)")
) %>%
  dplyr::filter(time == 0.25) %>%
  dplyr::select(cellLine, conc, model = vGhbUptake)
#> Warning: multi-subject simulation without without 'omega'
#> Warning: multi-subject simulation without without 'omega'

readoffChk <- readoff %>%
  dplyr::left_join(predicted, by = c("cellLine", "conc")) %>%
  dplyr::mutate(pctDiff = 100 * (model - published) / published)

stopifnot(
  nrow(readoffChk) == 5L,
  !anyNA(readoffChk$model),
  all(abs(readoffChk$pctDiff) < 10)
)

readoffChk %>%
  dplyr::mutate(dplyr::across(c(model, pctDiff), ~ round(.x, 1))) %>%
  dplyr::rename(
    "Cell line" = cellLine,
    "GHB (mM)" = conc,
    "Published curve (pmol/mg/min)" = published,
    "Packaged model (pmol/mg/min)" = model,
    "Difference (%)" = pctDiff
  ) %>%
knitr::kable()| Cell line | GHB (mM) | Published curve (pmol/mg/min) | Packaged model (pmol/mg/min) | Difference (%) |
|---|---|---|---|---|
| RBE4 (rat) | 10 | 78 | 77.5 | -0.7 |
| RBE4 (rat) | 30 | 145 | 145.2 | 0.1 |
| RBE4 (rat) | 50 | 175 | 176.0 | 0.6 |
| hCMEC/D3 (human) | 10 | 90 | 88.3 | -1.9 |
| hCMEC/D3 (human) | 30 | 152 | 154.7 | 1.8 |
Swapping the two cell lines’ constants would move the 10 mM rat prediction from 78 to 88 pmol/mg/min and break this check, so it also confirms the species assignment independently of the Abstract-versus-Results cross-read above.
Validation 3: the two cell lines describe near-identical kinetics
The paper’s conclusion from the in vitro arm is that “the similarity in the in vitro uptake characteristics of GHB in human and rat brain endothelial cells indicates that both serve as useful systems to study GHB brain uptake”. That is a quantitative claim the packaged models can be held to: across the entire studied range the human-to-rat velocity ratio should stay close to one.
ratio <- points %>%
  dplyr::select(conc, cellLine, vGhbUptake) %>%
  tidyr::pivot_wider(names_from = cellLine, values_from = vGhbUptake) %>%
  dplyr::mutate(humanOverRat = `hCMEC/D3 (human)` / `RBE4 (rat)`)

stopifnot(
  # Never more than 25% apart anywhere in the studied range.
  all(ratio$humanOverRat > 1 & ratio$humanOverRat < 1.25),
  # The gap is widest at low concentration, where the ratio tends to the ratio
  # of the intrinsic uptake clearances Vmax/Km, and narrows toward Vmax-limited
  # uptake at the top of the range.
  which.max(ratio$humanOverRat) == 1L,
  which.min(ratio$humanOverRat) == nrow(ratio)
)

ratio %>%
  dplyr::mutate(dplyr::across(-conc, ~ round(.x, 3))) %>%
  dplyr::rename(
    "GHB (mM)" = conc,
    "Human / rat" = humanOverRat
  ) %>%
knitr::kable()| GHB (mM) | RBE4 (rat) | hCMEC/D3 (human) | Human / rat |
|---|---|---|---|
| 0.01 | 0.111 | 0.137 | 1.237 |
| 0.10 | 1.103 | 1.363 | 1.236 |
| 1.00 | 10.617 | 12.984 | 1.223 |
| 3.00 | 29.430 | 35.261 | 1.198 |
| 5.00 | 45.583 | 53.680 | 1.178 |
| 10.00 | 77.477 | 88.256 | 1.139 |
| 30.00 | 145.216 | 154.678 | 1.065 |
| 50.00 | 175.989 | 182.085 | 1.035 |
The limiting ratio at low concentration is the ratio of intrinsic uptake clearances, which is reproduced exactly from the four published constants:
Validation 4: the in vitro Km against the paper’s in vivo conclusion
This is the check that ties the two arms of the paper together, and
it is the one that would catch a mis-transcribed Michaelis constant. The
paper’s central claim is that GHB brain distribution “is not
capacity-limited over the range of doses studied”, and its stated reason
is that the fitted Km values (18.1 and 23.3 mM) sit
above the plasma concentrations reached at 400 to 800
mg/kg (peak 8.4 to 15.6 mM, Table 1).
Two consequences follow, both testable with published numbers only.
Fractional saturation. Even at the highest observed plasma peak the transporter must be less than half saturated.
plasmaCmax <- c(`400 mg/kg` = 8.4, `600 mg/kg` = 11.7, `800 mg/kg` = 15.6)

satRat <- plasmaCmax / (kmRat + plasmaCmax)
satHuman <- plasmaCmax / (kmHuman + plasmaCmax)

stopifnot(
  all(satRat < 0.5),
  all(satHuman < 0.5)
)

round(rbind(`RBE4 (rat)` = satRat, `hCMEC/D3 (human)` = satHuman), 3)
#>                  400 mg/kg 600 mg/kg 800 mg/kg
#> RBE4 (rat)           0.265     0.334     0.401
#> hCMEC/D3 (human)     0.317     0.393     0.463
Predicted versus observed dose-dependence of brain
partitioning. If uptake into brain follows the fitted rate law
and efflux is unsaturated over this range, the unbound partition
coefficient is proportional to the uptake clearance
Vmax / (Km + C), so the model predicts how much
Kp,uu should fall as dose rises. Table 2 of the paper
reports the measured values, which were not
significantly different across doses. The model is evaluated at the
observed plasma peaks, the concentrations at which any capacity
limitation would be largest.
observedKpuu <- c(`400 mg/kg` = 0.079, `600 mg/kg` = 0.070, `800 mg/kg` = 0.070)

clUptake <- function(model, conc) {
  out <- solveUptake(model, conc) %>% dplyr::filter(time == 0.25)
  out$vGhbUptake / out$conc
}

predRat <- clUptake(rbe4, unname(plasmaCmax))
#> Warning: multi-subject simulation without without 'omega'
predHuman <- clUptake(hcmec, unname(plasmaCmax))
#> Warning: multi-subject simulation without without 'omega'

comparison <- tibble::tibble(
  dose = names(plasmaCmax),
  cmax = unname(plasmaCmax),
  observed = unname(observedKpuu / observedKpuu[1]),
  predRat = predRat / predRat[1],
  predHuman = predHuman / predHuman[1]
)

stopifnot(
  # The model reproduces the direction and the magnitude of the (statistically
  # non-significant) decline in Kp,uu with dose.
  all(comparison$predRat <= 1 & comparison$predRat > 0.75),
  all(comparison$predHuman <= 1 & comparison$predHuman > 0.75),
  max(abs(comparison$predRat - comparison$observed)) < 0.1,
  max(abs(comparison$predHuman - comparison$observed)) < 0.12
)

comparison %>%
  dplyr::mutate(dplyr::across(c(observed, predRat, predHuman), ~ round(.x, 3))) %>%
  dplyr::rename(
    "GHB dose" = dose,
    "Plasma Cmax (mM)" = cmax,
    "Observed Kp,uu ratio (Table 2)" = observed,
    "Predicted uptake-clearance ratio, rat" = predRat,
    "Predicted uptake-clearance ratio, human" = predHuman
  ) %>%
knitr::kable()| GHB dose | Plasma Cmax (mM) | Observed Kp,uu ratio (Table 2) | Predicted uptake-clearance ratio, rat | Predicted uptake-clearance ratio, human |
|---|---|---|---|---|
| 400 mg/kg | 8.4 | 1.000 | 1.000 | 1.000 |
| 600 mg/kg | 11.7 | 0.886 | 0.906 | 0.889 |
| 800 mg/kg | 15.6 | 0.886 | 0.815 | 0.786 |
The rat model predicts an 18% fall in uptake clearance between the
400 and 800 mg/kg peaks; the measured Kp,uu fell 11%, with
standard deviations of 0.01 to 0.02 on values of 0.070 to 0.079. The
predicted effect is therefore of the same sign and the same order as the
observed one, and small enough to be invisible to the paper’s
Kruskal-Wallis test — which is precisely the paper’s argument, now
reproduced numerically from the packaged constants. Substituting a
Km an order of magnitude lower would predict a fall of more
than 60% and break this check.
Why there is no PKNCA section
The package’s validation pattern for endogenous and mechanistic
models applies here. Neither model has a dose, an
absorption-distribution-elimination profile, or a concentration-time
curve to integrate — ghb_buffer is static by construction
and ghb_cell rises linearly over a 15 s initial-rate
window. The paper’s own noncompartmental analysis was run on the
in vivo microdialysis arm, which these models do not
describe. NCA of the in vitro states would compute a number with no
published counterpart — a check that cannot fail and so tests nothing.
The structural-identity, figure-replication, species-comparison and in
vivo-consistency checks above are the validations this model class
supports.
Assumptions and deviations
Only the in vitro arm is extracted. The in vivo microdialysis arm was analysed noncompartmentally (Phoenix WinNonlin 6.0, log-linear trapezoidal AUC) with sleep times compared by one-way ANOVA. It yields no structural parameters, no compartmental model and no ODE, so there is nothing to package. Its Table 1 and Table 2 values are reproduced in the model files’
population$notesand used above as validation targets.Two files, not one. The paper fitted RBE4 and hCMEC/D3 separately, by weighted nonlinear regression per cell line, and never fitted a species covariate. Packaging them jointly would require inventing one. This follows the same reasoning as the sibling in vitro pair
Hyland_2008_maraviroc_hlm/Hyland_2008_maraviroc_rcyp3a4.Equations 3 and 4 are not carried. The paper fitted a Michaelis-Menten route plus parallel diffusional clearance (equation 3, adding
P * C) and a two-transporter model (equation 4), and rejected both on AIC, coefficient of variation and residual plots. NeitherPnor the second transporter’s constants are reported. Unlike the impurity constant inHyland_2008_maraviroc_hlm— which sits inside the retained equation and is therefore carried at zero —Pbelongs to a rejected alternative, so adding it would misstate which model the authors selected.The source PDF’s symbol font corrupts the displayed equations. Equations 2 to 4 extract as
v = (Vmax + C) / (Km x C)because the font substitutes the glyphs for “times” and “plus”. The intended form is the standard Michaelis-Menten expression, which is what the text (“a single-transporter model”, “the simple Michaelis-Menten equation”), the Figure 6 fits, and the units of the reported constants all require. The same substitution affects=,+/-and the unit exponents throughout the article.The Methods concentration list does not match Figure 6. Materials and Methods states that both cell lines were incubated with “0.01, 0.1, 1, 3, 5, 10, 30 and 50 mM” GHB. Figure 6B (RBE4) plots an additional point near 20 mM that the list omits, and Figure 6D (hCMEC/D3) has an x axis stopping at 30 mM with no point above it. The human fit is therefore supported by data only to about 30 mM; the model’s behaviour above that concentration rests on the Michaelis-Menten form rather than on observations. This is recorded in each model’s
population$concentration_range, and it is why the read-off check above stops at 30 mM for hCMEC/D3.No residual-error model. The paper reports “weighted nonlinear regression analysis” without naming a weighting scheme, reports no sigma, and prints no assay coefficient of variation for the
[3H]GHB scintillation-counting endpoint.propSdis thereforefixed(0)in both files rather than invented, making these typical-value models. The error bars in Figure 6 are the standard deviation of three experiments; their values are not printed.No inter-experiment or inter-passage variability. The reported
+/-values onKmandVmaxare standard deviations of the parameter estimates, not a variance component, so they are recorded in thelabel()text rather than encoded as random effects.pH and inhibitor effects are documented but not modelled. Uptake of 10 mM GHB at pH 6.5 was 126% of that at pH 7.4 in RBE4 cells, and 2.5 mM alpha-cyano-4-hydroxycinnamate reduced uptake of 10 mM GHB to 60% of control in RBE4 and 66% in hCMEC/D3 cells. Each is a single-concentration observation, which cannot distinguish an effect on
Vmaxfrom an effect onKm; encoding either as a model term would require choosing between two observationally equivalent structures the data cannot separate. They are recorded inpopulation$notesinstead.The buffer is held static and no depletion is modelled. This reproduces the authors’ initial-rate design (15 s incubation inside a 30 s linear window). Neither the buffer volume nor the cell protein per well is reported, so a depletion term could not be computed even if it were wanted.
Validation 4is a consistency check, not a fit. TreatingKp,uuas proportional toVmax / (Km + C)assumes efflux from brain is unsaturated over this concentration range and evaluates uptake at the plasma peak rather than over the full profile. The paper makes the same argument qualitatively; the code above only makes its magnitude explicit. It is not evidence that the in vitro constants quantitatively predict the in vivo partition coefficient, whose absolute value (about 0.07 to 0.1) the in vitro data cannot address.Observation variable naming.
checkModelConventions()warns that the single outputvGhbUptakeis not the canonicalCc. The warning is accepted rather than fixed: the fitted endpoint is a reaction velocity in pmol/mg protein/min, and renaming itCcwould misstate its units and its meaning. Same decision, and same reasoning, asHyland_2008_maraviroc_hlm.No erratum. Crossref reports no
update-toorupdated-byrelation for10.1124/dmd.111.041749, and no correction notice was found for the article. The paper has no supplementary material.