Model and source
- Citation: Fouad SA, Malaak FA, El-Nabarawi MA, Abu Zeid K, Ghoneim AM. (2021). Preparation of solid dispersion systems for enhanced dissolution of poorly water soluble diacerein: In-vitro evaluation, optimization and physiologically based pharmacokinetic modeling. PLoS ONE 16(1):e0245482. doi:10.1371/journal.pone.0245482.
- Description: PBPK reduction (Simcyp version 17, minimal PBPK with ADAM absorption). One-compartment oral pharmacokinetic model of diacerein in healthy adults, reduced from the Simcyp model Fouad 2021 used to compare plain crystalline diacerein with an optimised PEG 8000 solid dispersion (drug:polymer 1:4 w/w). The source model has no single adjusting compartment, a predicted Vss of 0.093 L/kg and an in-vivo oral clearance input of 1.5 L/h (30% CV), with hepatic and gut extraction both equal to 1, so the plasma profile is one-compartmental. Absorption is driven by the formulation’s in-vitro dissolution profile (released drug per hour, linearly interpolated, held flat after 1 h) followed by first-order absorption of dissolved drug at the Simcyp-predicted first-order equivalent ka (2.098 1/h, fraction absorbed 0.992). No parameter is fitted. The reduction reproduces the source’s simulated Cmax and AUC0-24 for both formulations to within about 6%, but peaks earlier because gastric emptying and small-intestinal transit are not represented. The model is valid for single doses and for repeat doses given at least 1 h apart. The geriatric simulation used a different (mechanistic diffusion-layer) dissolution model and Simcyp geriatric physiology and is not reproducible from this model.
- Article: https://doi.org/10.1371/journal.pone.0245482
- Supporting information (S1-S8 Files): https://www.ncbi.nlm.nih.gov/pmc/articles/PMC7816977/
What this model is, and what it is not
Fouad 2021 prepared solid dispersions of the poorly water-soluble anti-osteoarthritis drug diacerein, selected an optimised system (PEG 8000, drug:polymer 1:4 w/w) by an I-optimal factorial design, and used the Simcyp Population-based Simulator (version 17) to predict how the faster in-vitro dissolution of that system would change plasma exposure after a single 50 mg oral dose in healthy adults and in geriatric subjects (Table 6, Figure 15).
The article describes the compound layer only briefly (Table 3). The Simcyp workbooks deposited as S6-S8 Files record the whole input set, and they show that the healthy-adult model is:
-
absorption: the ADAM model, fed by the
formulation’s measured in-vitro dissolution profile (a “discrete”
profile, linearly interpolated), with a global effective permeability of
4.80e-4 cm/s. For a dissolved dose Simcyp converts that permeability to
a first-order equivalent of
ka= 2.098 1/h with 99.2% absorbed. - distribution: the minimal PBPK model with no single adjusting compartment, and a Vss predicted by the Rodgers and Rowland method of 0.093 L/kg.
- elimination: an in-vivo oral clearance of 1.5 L/h (30% CV). The gut-wall and hepatic availabilities are both 1.
With no adjusting compartment the minimal PBPK model has a single
systemic volume, so its plasma profile is one-compartmental. This
package ships that reduction. Doses go into depot, which
holds undissolved drug. Drug is released into gut_lumen at
the slope of the dissolution profile, and dissolved drug is absorbed at
the first-order ka into central. The
formulation covariate FORM_DCN_SD selects the plain-drug or
the optimised-solid-dispersion dissolution profile. The sections below
show that, with no fitted parameter, the reduction reproduces the
article’s Cmax and AUC0-24 for both formulations to within about 6%.
What is not reproduced. The model leaves out the ADAM model’s gastric emptying and small-intestinal transit, so it peaks earlier than the source. The geriatric simulation (S7 File) used a different, mechanistic diffusion-layer dissolution model with Simcyp geriatric physiology, and its deposited results do not match the printed Table 6 row. See Assumptions and deviations.
Population
The source simulations used the Simcyp Sim-Healthy Volunteers population (version 17), fasted, with a single 50 mg oral dose taken with water. The deposited healthy-adult workbooks give ages 20-60 years, 50% female, and one trial of 10 subjects. The Methods text instead describes ten trials of ten subjects and an age range of 40-55 years. The source model was checked against the single-dose bioequivalence study of Nguyen et al. (reference 1 of the article) of diacerein 50 mg capsules in healthy Vietnamese volunteers.
The same information is available programmatically via
readModelDb("Fouad_2021_diacerein")()$population.
Source trace
| Parameter / equation | Value | Source location |
|---|---|---|
lka |
2.098 1/h | S6 File, ‘Input Sheet’, Absorption: ka (1/h) (input
type ‘Predicted’, from Peff,man 4.80e-4 cm/s) |
lfdepot |
0.992 | S6 File, ‘Input Sheet’, Absorption: fa (predicted);
‘Summary’ Fg (Sub) = Fh (Sub) = 1 |
lvc |
6.512 L at 70 kg | S6 File, ‘Input Sheet’, Distribution: Vss (L/kg) =
0.09303 (predicted, Method 2), x 70 kg; minimal PBPK with
Vsac = 1e-5 L/kg |
lcl |
1.5 L/h | Table 3 (CL (L/h) 1.5); S6 File ‘Input Sheet’,
Elimination: CL (po) (L/h) = 1.5, ‘In Vivo Clearance’ |
etalcl |
0.0862 | S6 File ‘Input Sheet’, CV CL (po) (%) = 30; log(1 +
0.30^2) |
propSd |
0 (fixed) | Not reported; PBPK simulation analysis with no residual-error model |
| plain-drug release profile | 0, 13.27, 32.90, 42.30, 48.30% at 0-1 h | S6 File ‘Input Sheet’, ‘Dissolution Profile (All)’ (S2 File, row ‘Diacerein (Raw)’, at 15-min steps) |
| solid-dispersion release profile | 0, 95.197, 96.148, 98.349, 99.127% at 0-1 h | S2 File, sheet ‘Dissolution Data’, row ‘OPTIMIZED’ (15-60 min) |
vc <- exp(lvc) * WT / 70 |
n/a | Vss is predicted per kg |
d/dt(depot), d/dt(gut_lumen),
d/dt(central)
|
n/a | Discrete dissolution input (ADAM), first-order absorption of dissolved drug, one systemic volume (minimal PBPK without SAC) |
Reproducing the packaged values
ini_vals <- rxode2::rxode(readModelDb("Fouad_2021_diacerein"))$iniDf
packaged <- setNames(ini_vals$est, ini_vals$name)

vss_perkg <- 0.093026958 # S6 File, 'Vss (L/kg)'
stopifnot(
  abs(exp(packaged[["lka"]]) - 2.098) < 1e-8,
  abs(exp(packaged[["lfdepot"]]) - 0.992) < 1e-8,
  abs(exp(packaged[["lcl"]]) - 1.5) < 1e-8,
  abs(exp(packaged[["lvc"]]) - vss_perkg * 70) < 1e-3,
  abs(packaged[["etalcl"]] - log(1 + 0.30^2)) < 1e-4
)
cat("Packaged ini() values match the deposited Simcyp inputs.\n")
#> Packaged ini() values match the deposited Simcyp inputs.
Typical-value checks
These checks use one 70 kg subject per formulation with the random effect set to zero, so they are deterministic.
mod <- readModelDb("Fouad_2021_diacerein")
mod_typ <- rxode2::zeroRe(rxode2::rxode(mod))

tgrid <- sort(unique(c(seq(0, 4, by = 0.01), seq(4, 96, by = 0.1))))
typ_events <- function(form) {
  dplyr::bind_rows(
    data.frame(id = 1L, time = 0, amt = 50, evid = 1L, cmt = "depot"),
    data.frame(id = 1L, time = tgrid, amt = 0, evid = 0L, cmt = "central")
  ) |>
    dplyr::mutate(WT = 70, FORM_DCN_SD = form)
}
typ <- dplyr::bind_rows(lapply(c(0, 1), function(form) {
  as.data.frame(rxode2::rxSolve(mod_typ, typ_events(form),
                                atol = 1e-10, rtol = 1e-10)) |>
    dplyr::mutate(FORM_DCN_SD = form)
}))
#> ℹ omega/sigma items treated as zero: 'etalcl'
#> ℹ omega/sigma items treated as zero: 'etalcl'

trap <- function(t, y) sum(diff(t) * (head(y, -1) + tail(y, -1)) / 2)
typ_sum <- typ |>
  dplyr::group_by(FORM_DCN_SD) |>
  dplyr::summarise(
    cmax = max(Cc),
    tmax = time[which.max(Cc)],
    auc24 = trap(time[time <= 24], Cc[time <= 24]),
    aucinf = trap(time, Cc) + dplyr::last(Cc) / (1.5 / (vss_perkg * 70)),
    undissolved = dplyr::last(depot),
    .groups = "drop"
  ) |>
  dplyr::mutate(
    frac_dissolved = c(0.4830, 0.99127),
    f_expected = 0.992 * frac_dissolved
  )
knitr::kable(typ_sum, digits = 3,
caption = "Typical 70 kg subject, 50 mg single dose.")| FORM_DCN_SD | cmax | tmax | auc24 | aucinf | undissolved | frac_dissolved | f_expected |
|---|---|---|---|---|---|---|---|
| 0 | 2.756 | 1.68 | 15.893 | 15.972 | 25.850 | 0.483 | 0.479 |
| 1 | 5.720 | 1.35 | 32.627 | 32.779 | 0.436 | 0.991 | 0.983 |
Mass balance. Clearance times AUC0-inf must equal the absorbed dose. That is the dissolved fraction at 1 h times the 99.2% absorbed.
stopifnot(
  all(abs(1.5 * typ_sum$aucinf / (50 * typ_sum$f_expected) - 1) < 1e-3),
  # The undissolved plain-drug residue stays in the depot, as in the source.
  abs(typ_sum$undissolved[1] - 50 * (1 - 0.4830)) < 1e-3
)
Fraction absorbed. For plain diacerein the model
absorbs 0.479 of the dose. The deposited run reports
fa (Subs) = 0.470, 1.9% lower. This fraction is set by the
dissolution profile alone, so the agreement confirms that the profile is
held at 48.3% after 1 h rather than extrapolated.
Which Vss was used. Table 3 of the article lists
Vss = 0.23 L/kg from Nicolas 1998. The deposited workbooks
use the Simcyp-predicted 0.093 L/kg. Only the predicted value reproduces
the Table 6 exposures:
cmax_023 <- sapply(c(0, 1), function(form) {
  max(as.data.frame(rxode2::rxSolve(mod_typ, typ_events(form),
                                    params = c(lvc = log(0.23 * 70))))$Cc)
})
#> ℹ omega/sigma items treated as zero: 'etalcl'
#> ℹ omega/sigma items treated as zero: 'etalcl'
vss_tab <- data.frame(
  formulation = c("plain", "optimised SD"),
  table6_cmax = c(2.61, 5.46),
  cmax_vss_0093 = typ_sum$cmax,
  cmax_vss_023 = cmax_023
)
knitr::kable(vss_tab, digits = 2,
caption = "Typical Cmax (mg/L) under the two candidate Vss values.")| formulation | table6_cmax | cmax_vss_0093 | cmax_vss_023 |
|---|---|---|---|
| plain | 2.61 | 2.76 | 1.28 |
| optimised SD | 5.46 | 5.72 | 2.64 |
stopifnot(
  all(abs(vss_tab$cmax_vss_0093 / vss_tab$table6_cmax - 1) < 0.10),
  all(vss_tab$cmax_vss_023 / vss_tab$table6_cmax < 0.55)
)
With 0.23 L/kg the typical Cmax is less than half of the Table 6 values for both formulations, so the Table 3 entry is the literature value the authors cited, not the value the simulation used.
Virtual cohort
200 subjects per formulation, matching the deposited population’s 50%
female share. The Simcyp body weights are not reported. Weight is drawn
log-normally around a median of 75 kg (CV 15%) and restricted to 50-110
kg by redrawing, which is an assumption made here. Clearance varies by
the model’s 30% CV. Observations are placed on the central
ODE state, and Cc is returned as an algebraic observable on
those rows.
set.seed(20210120)
rxode2::rxSetSeed(20210120)
n_arm <- 200
draw_wt <- function(n) {
  wt <- numeric(0)
  while (length(wt) < n) {
    x <- 75 * exp(rnorm(n, 0, 0.15))
    wt <- c(wt, x[x >= 50 & x <= 110])
  }
  wt[seq_len(n)]
}
subjects <- data.frame(
  id = seq_len(2 * n_arm),
  FORM_DCN_SD = rep(c(0, 1), each = n_arm),
  WT = c(draw_wt(n_arm), draw_wt(n_arm))
) |>
  dplyr::mutate(treatment = ifelse(FORM_DCN_SD == 1, "optimised SD", "plain DCN"))

obs_times <- sort(unique(c(seq(0, 4, by = 0.1), seq(4.5, 24, by = 0.5))))
events <- dplyr::bind_rows(
  subjects |> dplyr::mutate(time = 0, amt = 50, evid = 1L, cmt = "depot"),
  tidyr::crossing(subjects, time = obs_times) |>
    dplyr::mutate(amt = 0, evid = 0L, cmt = "central")
) |>
  dplyr::arrange(id, time, dplyr::desc(evid))

sim <- as.data.frame(rxode2::rxSolve(mod, events, keep = c("treatment", "WT"))) |>
  dplyr::mutate(treatment = factor(treatment, c("plain DCN", "optimised SD")))
Replicating Figure 15
deposit_plain <- data.frame(
  # S6 File, sheet 'Conc Profiles CSys(CPlasma)', 'CSys Mean (mg/L)'
  # (nearest solver time to each listed time).
  time = c(0, 0.244, 0.481, 0.720, 0.966, 1.201, 1.443, 2.043, 2.520, 3.009,
           3.965, 5.047, 6.000, 8.045, 9.969, 11.883, 15.964, 20.043, 24),
  Cc = c(0, 0.05607, 0.3990, 1.011, 1.641, 2.130, 2.405, 2.557, 2.431, 2.237,
         1.829, 1.432, 1.150, 0.7242, 0.4737, 0.3137, 0.1352, 0.06104, 0.02928),
  treatment = factor("plain DCN", c("plain DCN", "optimised SD"))
)
sim_mean <- sim |>
  dplyr::group_by(treatment, time) |>
  dplyr::summarise(Cc = mean(Cc), .groups = "drop")

ggplot(sim_mean, aes(time, Cc, colour = treatment)) +
  geom_line() +
  geom_point(data = deposit_plain, shape = 1) +
  labs(x = "Time after dose (h)", y = "Mean diacerein plasma concentration (mg/L)",
       colour = NULL,
       caption = paste("Lines: this model, mean of 200 simulated subjects per formulation.",
                       "Open circles: mean profile in the deposited Simcyp run (S6 File).")) +
  theme_bw()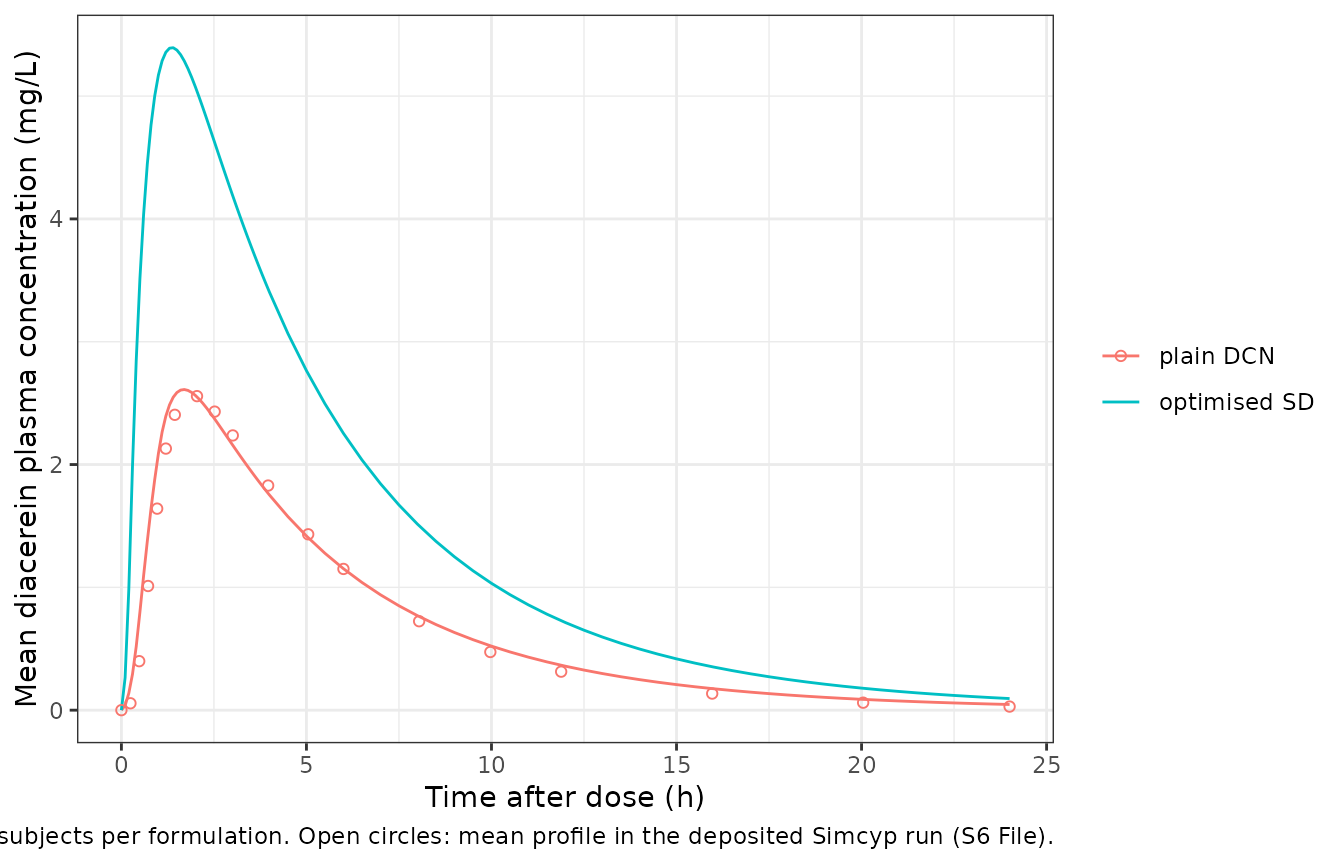
Replicates Figure 15 of Fouad 2021 (healthy adults). The model rises earlier than the Simcyp profile because gastric emptying and small-intestinal transit are not represented. From about 1.5 to 8 h the two plain-drug curves agree to within 7%. After that the model declines more slowly: the ten subjects of the deposited run have a mean oral clearance of 1.64 L/h (S6 File, ‘Summary’), 9% above the 1.5 L/h typical value, while the simulated cohort is centred on 1.5 L/h. The late tail is below 15% of Cmax and adds little to the AUC.
PKNCA validation
conc <- sim |>
  dplyr::filter(!is.na(Cc)) |>
  dplyr::select(id, treatment, time, Cc)
conc <- dplyr::bind_rows(
  conc,
  conc |> dplyr::distinct(id, treatment) |> dplyr::mutate(time = 0, Cc = 0)
) |>
  dplyr::distinct(id, treatment, time, .keep_all = TRUE) |>
  dplyr::arrange(id, time)
dose <- subjects |>
  dplyr::mutate(time = 0, amt = 50) |>
  dplyr::select(id, treatment, time, amt)

nca <- PKNCA::pk.nca(PKNCA::PKNCAdata(
  PKNCA::PKNCAconc(conc, Cc ~ time | treatment + id, concu = "mg/L", timeu = "h"),
  PKNCA::PKNCAdose(dose, amt ~ time | treatment + id, doseu = "mg"),
  intervals = data.frame(start = 0, end = 24, cmax = TRUE, tmax = TRUE,
                         auclast = TRUE)
))
nca_df <- as.data.frame(nca)
Comparison against Table 6
Table 6 reports the arithmetic mean Cmax and AUC0-24 and the median Tmax (footnotes a and b). The simulated values below use the same statistics.
simulated <- nca_df |>
  dplyr::filter(PPTESTCD %in% c("cmax", "tmax", "auclast")) |>
  dplyr::group_by(treatment, PPTESTCD) |>
  dplyr::summarise(
    PPORRES = ifelse(dplyr::first(PPTESTCD) == "tmax",
                     stats::median(PPORRES), mean(PPORRES)),
    .groups = "drop"
  ) |>
  tidyr::pivot_wider(names_from = PPTESTCD, values_from = PPORRES) |>
  dplyr::mutate(treatment = as.character(treatment))

published <- data.frame(
  treatment = c("plain DCN", "optimised SD"),
  cmax = c(2.61, 5.46),
  tmax = c(1.85, 1.80),
  auclast = c(15.48, 35.53)
)

cmp <- nlmixr2lib::ncaComparisonTable(
  simulated = simulated,
  reference = published,
  by = "treatment",
  units = c(cmax = "mg/L", tmax = "h", auclast = "mg*h/L"),
  tolerance_pct = 20
)
knitr::kable(
  cmp,
  caption = paste("Simulated vs. Fouad 2021 Table 6 (healthy adults, 50 mg).",
                  "* differs from the reference by >20%.")
)| NCA parameter | treatment | Reference | Simulated | % diff |
|---|---|---|---|---|
| Cmax (mg/L) | plain DCN | 2.61 | 2.62 | +0.4% |
| Cmax (mg/L) | optimised SD | 5.46 | 5.41 | -0.8% |
| Tmax (h) | plain DCN | 1.85 | 1.7 | -8.1% |
| Tmax (h) | optimised SD | 1.8 | 1.4 | -22.2%* |
| AUClast (mg*h/L) | plain DCN | 15.5 | 16.4 | +5.8% |
| AUClast (mg*h/L) | optimised SD | 35.5 | 33.9 | -4.7% |
chk <- dplyr::inner_join(simulated, published, by = "treatment",
                         suffix = c("_sim", "_pub")) |>
  dplyr::mutate(
    cmax_pct = 100 * (cmax_sim / cmax_pub - 1),
    auc_pct = 100 * (auclast_sim / auclast_pub - 1)
  )
# Centre-of-distribution comparisons (means of 200 subjects); a mistyped
# clearance, volume, dose or dissolution profile moves these by tens of
# percent.
stopifnot(
  nrow(chk) == 2,
  all(abs(chk$cmax_pct) < 15),
  all(abs(chk$auc_pct) < 15)
)
Cmax agrees with Table 6 to within about 1% and AUC0-24 to within about 6% for both formulations. Three differences are expected:
- Tmax is earlier, by about 0.15 h for plain diacerein and about 0.4 h for the solid dispersion. The ADAM model delays absorption through gastric emptying and transit down the small intestine, and this reduction leaves both out. The delay shows up most for the solid dispersion, whose release is almost complete within 5 minutes.
- The plain-drug AUC is about 6% higher than Table 6, because the ten deposited subjects happen to clear the drug 9% faster than the typical value (see Figure 15 above).
- The solid-dispersion AUC is about 5% lower than Table 6. The Simcyp run for this arm is not deposited, and its virtual subjects (the Methods text describes 100) are not the ten in the deposited plain-drug run. Table 6 implies a relative bioavailability of 229.5%, but with the plain drug absorbing 47.0% and at most 99.2% of any dissolved dose absorbed, the same subjects cannot exceed 0.992 / 0.470 = 211%. So the published ratio compares different virtual samples.
Assumptions and deviations
-
One-compartment reduction of a minimal PBPK model.
The source has no single adjusting compartment (
Vsac= 1e-5 L/kg), so the Simcyp-predicted Vss is used as the single systemic volume. The small liver and portal compartments are lumped into it, which is harmless here because hepatic extraction is negligible (Fh= 1). -
ADAM absorption replaced by release plus first-order
absorption. The dissolution profile is applied as the release
rate, as in the source’s “discrete” dissolution input. Dissolved drug is
absorbed at the Simcyp-predicted first-order equivalent
ka(2.098 1/h) with 99.2% absorbed. Gastric emptying, regional transit, luminal pH and fluid volumes are not represented, which makes Tmax earlier (see above). The 10% between-subject CV that the source applies to each dissolution time point is not carried over. -
Dissolution profile after 1 h. Both profiles end at
60 minutes, and the source holds them at their last value. The
undissolved remainder (51.7% of a plain dose) is therefore never
absorbed. The release clock restarts at each dose
(
tad(depot),podo(depot)), so repeat doses are handled exactly when they are at least 1 h apart. - Solid-dispersion input. The healthy-adult solid-dispersion workbook is not deposited. The S8 File, labelled “Simulation of optimized SD in healthy volunteers”, has the same inputs and results as the plain-drug S6 File. The mean in-vitro profile of the optimised system (S2 File, row ‘OPTIMIZED’) is used on the same 15-minute grid as the plain-drug run. Using the full 5-minute grid changes the typical Cmax by less than 0.1% and Tmax by 0.07 h.
- Clearance. The source’s in-vivo oral clearance (1.5 L/h) is used as the systemic clearance. With gut-wall and hepatic availability both equal to 1, the two differ only by the 0.8% of dissolved drug that is not absorbed. Clearance is not scaled by body weight.
- Body weight. The Simcyp population weights are not reported. Volume is scaled linearly from a 70 kg reference, and the virtual cohort assumes a median of 75 kg.
-
Vss in Table 3. Table 3 prints
Vss= 0.23 L/kg, but the simulation used the Simcyp-predicted 0.093 L/kg, and only the latter reproduces Table 6 (see Which Vss was used). - Cohort size. The Methods describe ten trials of ten subjects. The deposited healthy-adult workbooks contain one trial of ten, and their summary statistics are the Table 6 plain-drug row exactly.
- Geriatric simulation not reproduced. The geriatric solid-dispersion run (S7 File) replaces the discrete profile with the mechanistic diffusion-layer dissolution model (10 um monodispersed particles, a precipitation model and bile-micelle solubilisation) and uses the Simcyp Sim-Geriatric NEC population. Its deposited results (Cmax 5.27 mg/L, AUC0-24 37.47 mgh/L) also differ from the printed Table 6 row (5.70 mg/L, 40.56 mgh/L). Neither can be rebuilt from published values.
- Analyte. The source simulates diacerein itself (MW 368.29 g/mol, pKa 3.37). Its clearance, unbound fraction and cited Vss come from the review of Nicolas et al. (1998). In clinical studies diacerein is usually measured as its active metabolite, rhein. The model keeps the source’s labelling.
- Clinical comparison. The article checks the solid-dispersion prediction against the bioequivalence study of Nguyen et al. (Cmax 5.47 ug/mL, Tmax 2.5 h, AUC0-24 31.11 ug*h/mL for marketed 50 mg capsules). That study is not a solid-dispersion study, so it is not used as a validation target here.
- No residual error, no fitted parameters. The source is a simulation study. Residual error is fixed at zero, and the only between-subject variability carried over is the 30% CV on clearance.