Anthracycline + trastuzumab cardiotoxicity (de Vries Schultink 2018)
Source:vignettes/articles/deVriesSchultink_2018_cardiotoxicity.Rmd
deVriesSchultink_2018_cardiotoxicity.Rmd
library(nlmixr2lib)
library(rxode2)
#> rxode2 5.1.2 using 2 threads (see ?getRxThreads)
#>   no cache: create with `rxCreateCache()`
library(dplyr)
#>
#> Attaching package: 'dplyr'
#> The following objects are masked from 'package:stats':
#>
#>     filter, lag
#> The following objects are masked from 'package:base':
#>
#>     intersect, setdiff, setequal, union
library(tidyr)
library(ggplot2)
Cardiac biomarkers during adjuvant anthracycline + trastuzumab
de Vries Schultink and colleagues (2018) developed two non-hierarchical pharmacodynamic models for cardiac biomarkers during sequential adjuvant anthracycline + trastuzumab therapy in HER2-positive early breast cancer. Both models were fit to data from the same 206-patient cohort (the candesartan-vs-placebo cardioprotection trial, Boekhout 2016 JAMA Oncology), but with biomarker-specific subsets:
Anthracycline -> high-sensitive troponin T (hs-TnT): a kinetic-pharmacodynamic (K-PD) direct-effect model. The anthracycline dose enters a virtual body amount compartment that eliminates with rate constant
kel; serum troponin T responds instantaneously throughTRP = TRP0 * (1 + SLOPE * Aant). Epirubicin is approximately half as cardiotoxic as doxorubicin per unit dose, encoded by a multiplicative covariate effect on SLOPE.Trastuzumab -> left-ventricular ejection fraction (LVEF): an effect-compartment turnover model. Trastuzumab plasma concentration drives a cardiac-damage effect compartment that decays with recovery half-life
T1/2rec; LVEF declines via a sigmoid Emax expressionLVEF = LVEF0 * (1 - Ceff / (Ceff + EC50)). The EC50 is modulated by the per-subject peak post-anthracycline troponin T (TROPONIN_T_MAX), linking the two biomarkers: a higher peak troponin T predicts a greater sensitivity to subsequent trastuzumab-induced LVEF decline. Trastuzumab PK in this paper is a deterministic forcing function from the Bruno 2005 popPK model (registered in nlmixr2lib asBruno_2005_trastuzumab).
NT-proBNP was investigated as a third candidate biomarker but no model was developed (de Vries Schultink 2018 Results, “NT-proBNP”).
This vignette uses the two registered model files
(deVriesSchultink_2018_anthracycline_troponinT.R and
deVriesSchultink_2018_trastuzumab_LVEF.R) together to walk
through the paper’s sequential simulation: anthracycline -> troponin
T peak -> trastuzumab -> LVEF.
Source trace
| Element | Source location | Value / form |
|---|---|---|
| K-PD body-amount eq | de Vries Schultink 2018 p. 435 | d/dt(depot_kpd) = -kel * depot_kpd |
| Direct-effect troponin T | p. 435 | troponin_t = TRP0 * (1 + SLOPE * depot_kpd) |
| TRP0 baseline | Table 2 | 4.72 ng/L (RSE 3.5%) |
| K-PD kel | Table 2 | 0.00849 /day (RSE 4.0%) |
| SLOPE (doxorubicin reference) | Table 2 | 0.00884 (1/mg) (RSE 7.0%) |
| Epirubicin multiplier on SLOPE | Table 2 | 0.524 (RSE 17.5%); doxorubicin is the reference |
| Troponin T IIV | Table 2 | SLOPE 57.7% CV (shrinkage 31.0%), TRP0 39.2% CV (shrinkage 12.6%) |
| Troponin T proportional residual | Table 2 | 30.1% (shrinkage 11.2%) |
| LVEF effect compartment | p. 438 | d/dt(effect) = Cc_trastuzumab - log(2)/T1/2rec * effect |
| LVEF observation | p. 438 | LVEF = LVEF0 * (1 - effect / (effect + EC50)) |
| LVEF0 | Table 2 | 0.599 (RSE 0.6%) |
| T1/2rec | Table 2 | 67.9 day (RSE 17.2%) |
| EC50 | Table 2 | 2.18e5 (RSE 23.4%); units interpreted as mg.day/L (see Assumptions) |
| TROPONIN_T_MAX power exponent on EC50 | Table 2 / Results EC50 covariate eq | -1.16 (RSE 23.4%), median-centered at 18 ng/L |
| LVEF IIV (block) | Table 2 | LVEF0 7.07% CV, EC50 82.9% CV, correlation 0.585 |
| LVEF proportional residual | Table 2 | 7.8% (shrinkage 8.3%) |
| Trastuzumab PK (forcing) | de Vries Schultink 2018 Methods (ref [18]) | Bruno 2005 fixed effects + covariates, no PK IIV |
Population
The two models share the same cohort: 206 HER2-positive early breast cancer patients (median age 50 [25-69] years; 100% female) randomized in the Boekhout 2016 candesartan-vs-placebo cardioprotection trial. Doxorubicin was the predominant anthracycline (181 / 206 = 88%); epirubicin was used in the remaining 25 / 206 = 12%. Trastuzumab was given on either the weekly schedule (4 mg/kg loading + 2 mg/kg weekly, n = 144) or the 3-weekly schedule (8 mg/kg + 6 mg/kg q3w, n = 62), starting a median 21 [14-217] days after the last anthracycline dose and continuing for a median 23 [5-46] cycles.
The troponin T model used the 190 / 206 troponin-T-evaluable patients; the LVEF model used all 206. The companion candesartan-vs-placebo randomization was tested as a covariate on EC50 and on T1/2rec and was not retained (paper Discussion, ‘Patients in this study were randomized to receive candesartan or placebo … we do not expect that the randomization affects the anthracycline-troponin T model. … No mayor differences were found in magnitude of parameter estimates … when the trastuzumab-LVEF model was evaluated for each treatment group separately.’).
Virtual cohort
The paper does not publish individual baseline covariates. We build a
synthetic cohort matching the descriptive statistics of Table 1: 200
women, median age 50 years, median weight 70 kg (no explicit weight
range given in the paper, so we use the Bruno 2005 70 kg reference
spread by +/-14 kg), 88% receiving doxorubicin and 12% epirubicin, all
with MET_GE4 = 0 (early breast cancer, by inclusion
criterion no metastatic disease).
set.seed(2018)

n_subj <- 200L

cohort <- tibble::tibble(
  id                  = seq_len(n_subj),
  WT                  = pmin(pmax(rnorm(n_subj, 70, 14), 45), 110),
  HER2_ECD            = pmin(pmax(rlnorm(n_subj, log(8.23), 0.6), 2), 80),
  MET_GE4             = 0L,
  trast_schedule      = ifelse(runif(n_subj) < 144 / 206, "qw", "q3w"),
  anthracycline_class = ifelse(runif(n_subj) < 181 / 206, "doxorubicin", "epirubicin"),
  anth_dose_mg        = NA_real_
)

cohort$anth_dose_mg <- ifelse(
  cohort$anthracycline_class == "doxorubicin",
  110, 170
)

cohort$CONMED_DOXORUBICIN <- as.integer(cohort$anthracycline_class == "doxorubicin")
cohort$CONMED_EPIRUBICIN  <- as.integer(cohort$anthracycline_class == "epirubicin")

table(cohort$anthracycline_class, cohort$trast_schedule)
#>
#>               q3w  qw
#>   doxorubicin  46 131
#>   epirubicin    7  16
Anthracycline K-PD: simulate troponin T
The anthracycline schedule is 4 cycles q3w (median per Table 1), with
each cycle administering the patient’s median absolute anthracycline
dose (Table 1 medians: 110 mg doxorubicin, 170 mg epirubicin). Doses are
entered into the depot_kpd compartment.
n_cycles_anth <- 4L
cycle_ii      <- 21
anth_times    <- (seq_len(n_cycles_anth) - 1L) * cycle_ii

anth_obs_times <- sort(unique(c(
  seq(0, max(anth_times), length.out = 80),
  max(anth_times) + c(0, 7, 14, 21, 28, 42, 56, 84, 120, 200, 280)
)))

anth_dose_rows <- tidyr::expand_grid(
  id   = cohort$id,
  time = anth_times
) |>
  dplyr::left_join(
    cohort |> dplyr::select(id, anth_dose_mg, CONMED_DOXORUBICIN, CONMED_EPIRUBICIN),
    by = "id"
  ) |>
  dplyr::mutate(
    amt  = anth_dose_mg,
    cmt  = "depot_kpd",
    evid = 1L
  )

anth_obs_rows <- tidyr::expand_grid(
  id   = cohort$id,
  time = anth_obs_times
) |>
  dplyr::left_join(
    cohort |> dplyr::select(id, CONMED_DOXORUBICIN, CONMED_EPIRUBICIN),
    by = "id"
  ) |>
  dplyr::mutate(
    amt  = NA_real_,
    cmt  = NA_character_,
    evid = 0L
  )

anth_events <- dplyr::bind_rows(anth_dose_rows, anth_obs_rows) |>
  dplyr::arrange(id, time, dplyr::desc(evid))
mod_trp <- readModelDb("deVriesSchultink_2018_anthracycline_troponinT")

sim_trp <- rxode2::rxSolve(
  mod_trp,
  events = anth_events,
  keep   = c("CONMED_DOXORUBICIN", "CONMED_EPIRUBICIN")
) |> as.data.frame()
#> ℹ parameter labels from comments will be replaced by 'label()'
sim_trp$time <- as.numeric(sim_trp$time)
Per-subject peak troponin T (TROPONIN_T_MAX) – this scalar will feed the LVEF model:
trp_peaks <- sim_trp |>
  dplyr::filter(!is.na(troponin_t)) |>
  dplyr::group_by(id) |>
  dplyr::summarise(TROPONIN_T_MAX = max(troponin_t, na.rm = TRUE), .groups = "drop")

summary(trp_peaks$TROPONIN_T_MAX)
#>    Min. 1st Qu.  Median    Mean 3rd Qu.    Max.
#>   5.122  13.056  19.490  22.267  27.751  79.893
The paper reports a cohort-median TROPONIN_T_MAX of 18 ng/L (used as the median-centering reference in the EC50 covariate equation). The simulated cohort median should sit close to that value.
bin_summary <- sim_trp |>
  dplyr::filter(time >= 0, !is.na(troponin_t)) |>
  dplyr::mutate(
    anth = ifelse(CONMED_DOXORUBICIN == 1L, "doxorubicin", "epirubicin"),
    time_bin = cut(time, breaks = seq(0, max(time) + 1, length.out = 50),
                   include.lowest = TRUE, labels = FALSE)
  ) |>
  dplyr::group_by(anth, time_bin) |>
  dplyr::summarise(time   = mean(time),
                   median = median(troponin_t),
                   lo     = quantile(troponin_t, 0.05),
                   hi     = quantile(troponin_t, 0.95),
                   .groups = "drop")

ggplot(bin_summary, aes(time, median, fill = anth, colour = anth)) +
  geom_ribbon(aes(ymin = lo, ymax = hi), alpha = 0.20, colour = NA) +
  geom_line(linewidth = 0.9) +
  geom_hline(yintercept = 3, linetype = "dashed", colour = "grey50") +
  labs(x = "Time since first anthracycline cycle (days)",
       y = "Simulated troponin T (ng/L)",
       title = "Anthracycline K-PD: simulated troponin T profiles",
       subtitle = paste0(n_subj, " virtual subjects; 4 cycles q3w of the median anthracycline dose"),
       caption = "Dashed line = assay LLOQ 3 ng/L. Reproduces the qualitative pattern of de Vries Schultink 2018 Fig. 3 (troponin T pcVPC).") +
  theme_bw()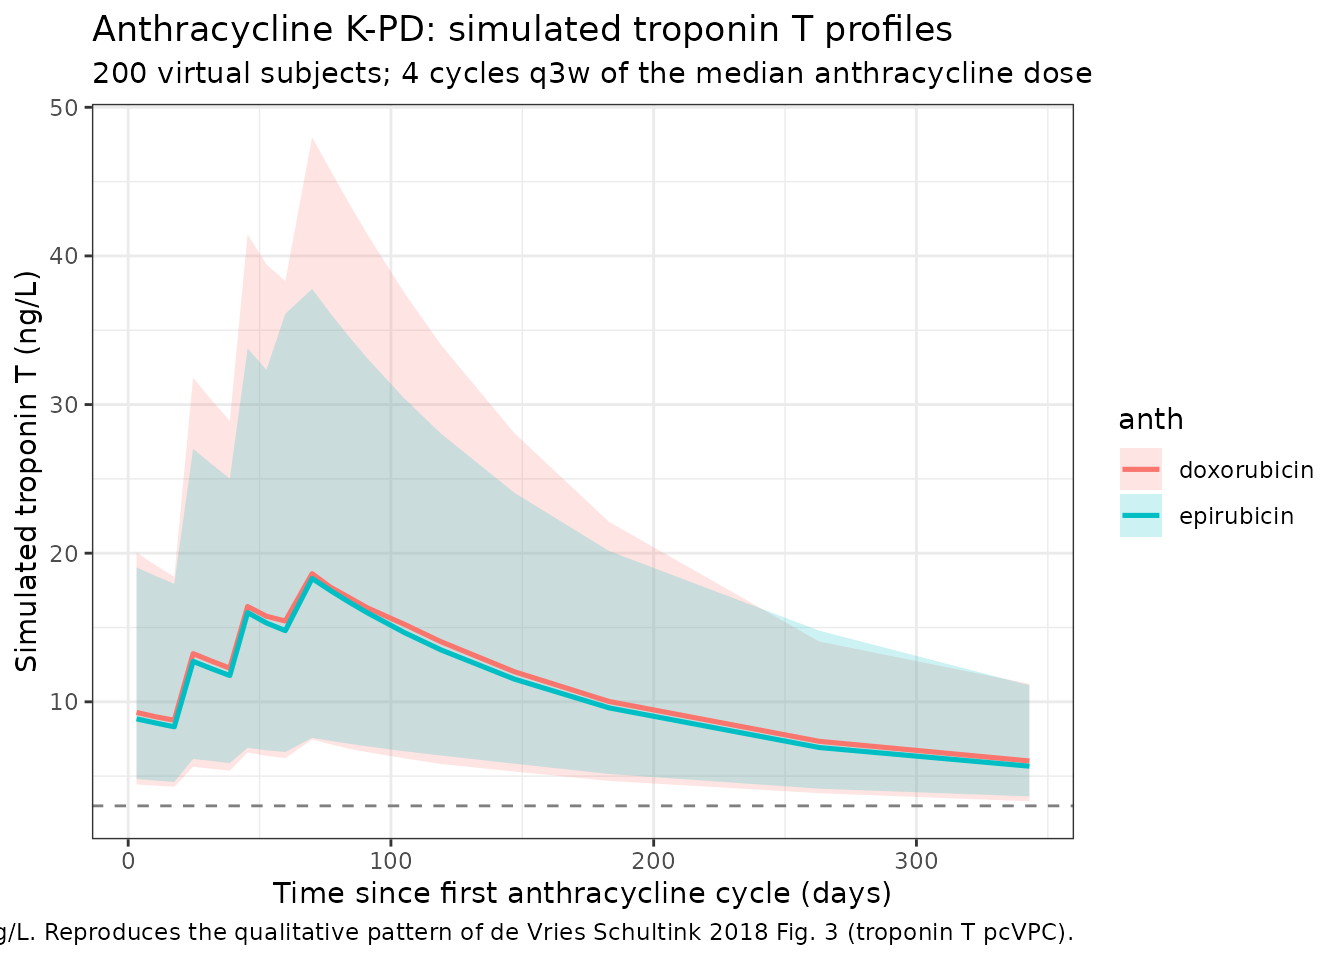
Simulated troponin T profiles by anthracycline class (median + 5-95% pointwise interval).
Trastuzumab + LVEF: simulate the cardiac-damage layer
The LVEF model file inlines the Bruno 2005 trastuzumab popPK as a deterministic forcing function (de Vries Schultink 2018 Methods: ‘The trastuzumab PK profiles were obtained using fixed effect parameters from a previously published PK model’). It carries Bruno 2005’s WT / HER2_ECD / MET_GE4 covariate effects but no PK IIV; only the LVEF parameters carry IIV and residual error.
The per-subject TROPONIN_T_MAX from the anthracycline simulation becomes a covariate on EC50 (median-centered at 18 ng/L, power exponent -1.16): patients with higher peak troponin T have lower EC50, i.e. greater sensitivity to trastuzumab-induced LVEF decline.
cohort_lvef <- cohort |>
  dplyr::left_join(trp_peaks, by = "id")

# Set t = 0 at first trastuzumab dose (typical 21 days after last
# anthracycline dose per Table 1 median).
n_qw_doses  <- 18L   # 1 loading + 17 maintenance = 17 weeks (median 23 cycles total per Table 1 ~ 23 weekly doses)
n_q3w_doses <- 8L    # 1 loading + 7 maintenance ~ 24 weeks
make_trast_events <- function(cohort_arm, dose_load, dose_maint, ii, n_dose) {
  dose_times <- c(0, seq_len(n_dose - 1L) * ii)

  trast_dose <- tidyr::expand_grid(
    id   = cohort_arm$id,
    time = dose_times
  ) |>
    dplyr::left_join(
      cohort_arm |> dplyr::select(id, WT),
      by = "id"
    ) |>
    dplyr::mutate(
      cycle = rep(seq_len(n_dose), times = nrow(cohort_arm)),
      amt   = ifelse(cycle == 1L, dose_load * WT, dose_maint * WT),
      cmt   = "central",
      evid  = 1L
    ) |>
    dplyr::select(id, time, amt, cmt, evid)

  obs_times <- sort(unique(c(
    seq(0, max(dose_times), length.out = 60),
    max(dose_times) + c(0, 30, 60, 90, 120, 180, 240, 360)
  )))
  trast_obs <- tidyr::expand_grid(
    id   = cohort_arm$id,
    time = obs_times
  ) |>
    dplyr::mutate(
      amt  = NA_real_,
      cmt  = NA_character_,
      evid = 0L
    )

  dplyr::bind_rows(trast_dose, trast_obs) |>
    dplyr::arrange(id, time, dplyr::desc(evid))
}

events_qw  <- make_trast_events(cohort_lvef |> dplyr::filter(trast_schedule == "qw"),
                                4, 2,  7,  n_qw_doses)
events_q3w <- make_trast_events(cohort_lvef |> dplyr::filter(trast_schedule == "q3w"),
                                8, 6, 21, n_q3w_doses)

lvef_events <- dplyr::bind_rows(events_qw, events_q3w) |>
  dplyr::left_join(
    cohort_lvef |> dplyr::select(id, WT, HER2_ECD, MET_GE4, TROPONIN_T_MAX, trast_schedule),
    by = "id"
  )
mod_lvef <- readModelDb("deVriesSchultink_2018_trastuzumab_LVEF")

sim_lvef <- rxode2::rxSolve(
  mod_lvef,
  events = lvef_events,
  keep   = c("trast_schedule")
) |> as.data.frame()
#> ℹ parameter labels from comments will be replaced by 'label()'
sim_lvef$time <- as.numeric(sim_lvef$time)
lvef_summary <- sim_lvef |>
  dplyr::filter(time >= 0, !is.na(LVEF)) |>
  dplyr::mutate(
    time_bin = cut(time, breaks = seq(0, max(time) + 1, length.out = 40),
                   include.lowest = TRUE, labels = FALSE)
  ) |>
  dplyr::group_by(trast_schedule, time_bin) |>
  dplyr::summarise(time   = mean(time),
                   median = median(LVEF),
                   lo     = quantile(LVEF, 0.05),
                   hi     = quantile(LVEF, 0.95),
                   .groups = "drop")

ggplot(lvef_summary, aes(time, median, colour = trast_schedule, fill = trast_schedule)) +
  geom_ribbon(aes(ymin = lo, ymax = hi), alpha = 0.20, colour = NA) +
  geom_line(linewidth = 0.9) +
  geom_hline(yintercept = 0.45, linetype = "dashed", colour = "grey50") +
  labs(x = "Time since first trastuzumab dose (days)",
       y = "Simulated LVEF (fraction)",
       title = "Trastuzumab-induced LVEF decline (effect-compartment turnover)",
       subtitle = "Simulation driven by per-subject TROPONIN_T_MAX from the anthracycline K-PD model",
       caption = "Dashed line = 0.45 LVEF, the clinically relevant decline threshold from de Vries Schultink 2018.") +
  theme_bw()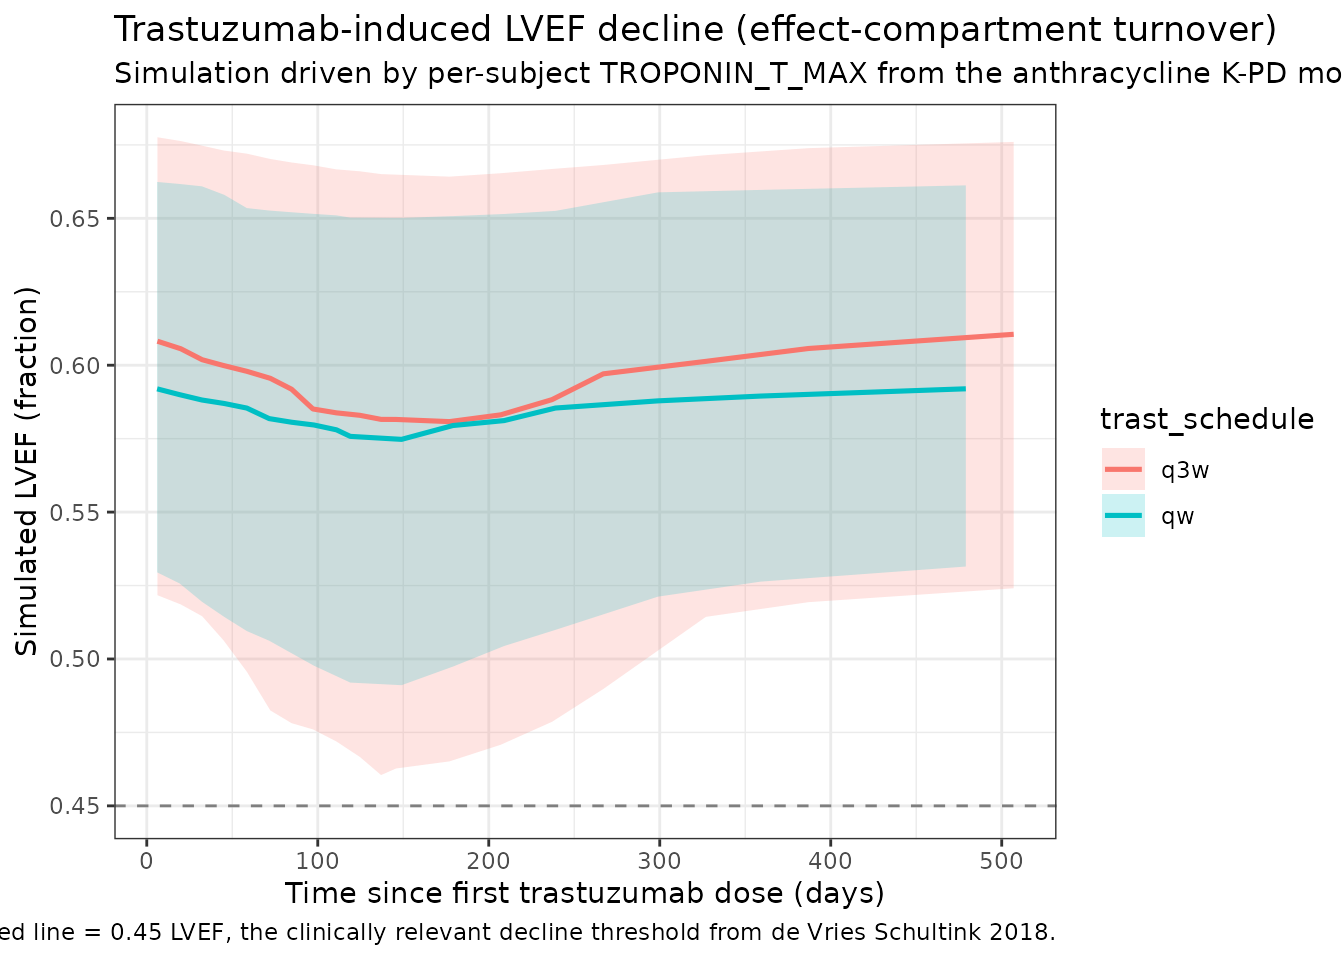
Simulated trastuzumab Cc and LVEF over time (typical-value summary).
Cross-biomarker check: TROPONIN_T_MAX vs LVEF nadir
de Vries Schultink 2018 reports that ‘a peak concentration of 31 ng/L troponin T would increase the sensitivity to LVEF decrease by a twofold (twofold decrease in EC50)’. The simulated cohort below should reproduce a monotone-decreasing relationship between TROPONIN_T_MAX and per-subject LVEF nadir.
lvef_nadir <- sim_lvef |>
  dplyr::filter(!is.na(LVEF)) |>
  dplyr::group_by(id) |>
  dplyr::summarise(LVEF_nadir = min(LVEF, na.rm = TRUE), .groups = "drop")

cross <- cohort_lvef |>
  dplyr::select(id, TROPONIN_T_MAX, trast_schedule) |>
  dplyr::left_join(lvef_nadir, by = "id")

ggplot(cross, aes(TROPONIN_T_MAX, LVEF_nadir)) +
  geom_point(alpha = 0.4, aes(colour = trast_schedule)) +
  geom_smooth(method = "loess", se = FALSE, colour = "black") +
  geom_hline(yintercept = 0.45, linetype = "dashed", colour = "grey50") +
  scale_x_log10() +
  labs(x = "Peak post-anthracycline troponin T (ng/L, log scale)",
       y = "Simulated per-subject LVEF nadir",
       title = "Peak troponin T predicts LVEF nadir",
       caption = "Higher TROPONIN_T_MAX lowers EC50, increasing trastuzumab-induced LVEF decline.") +
  theme_bw()
#> `geom_smooth()` using formula = 'y ~ x'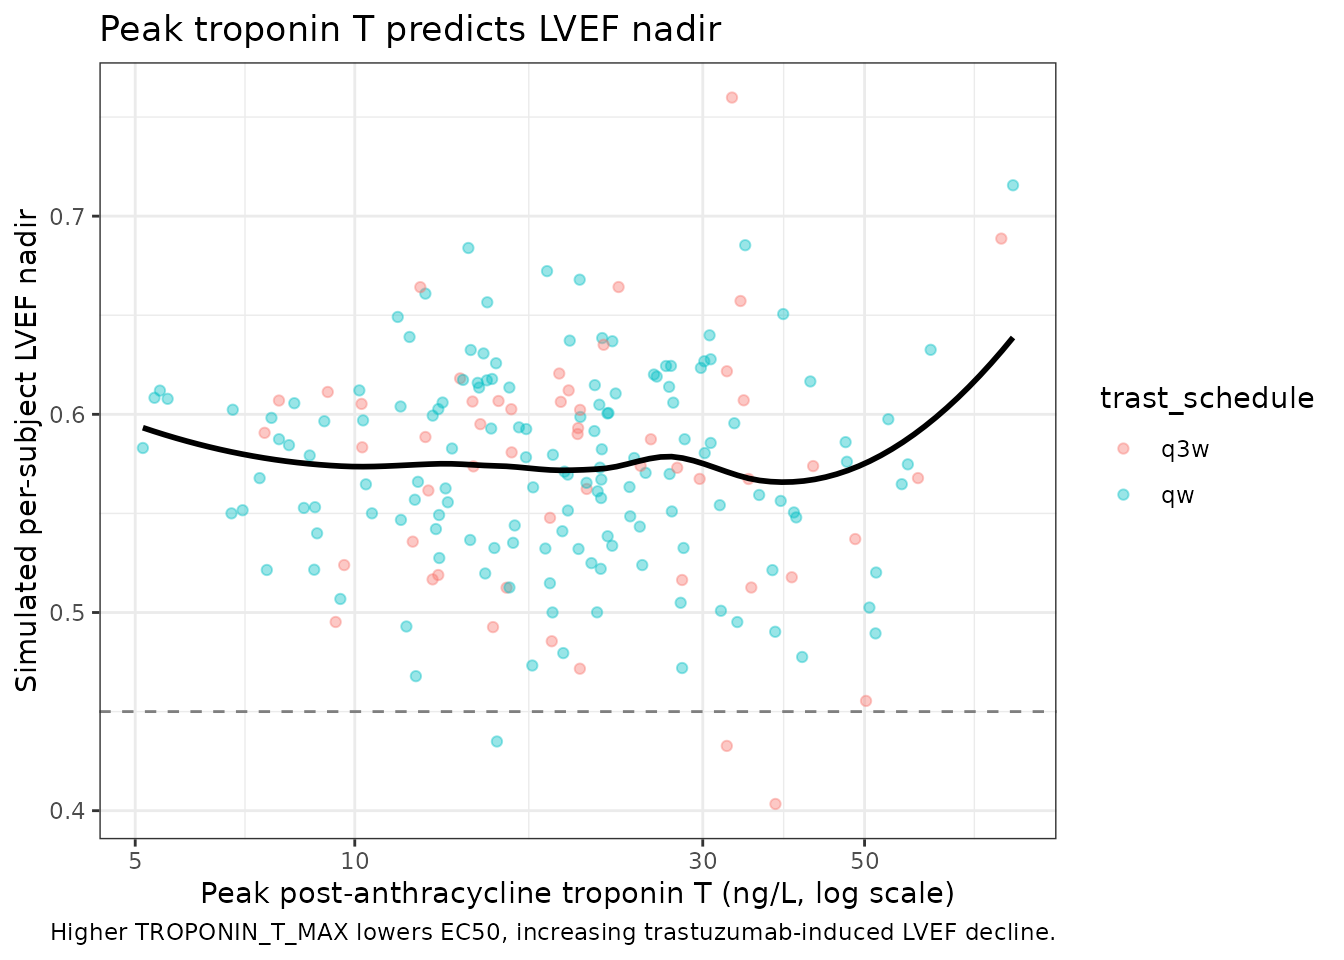
Assumptions and deviations
EC50 units. The LVEF effect-compartment equation as written in the paper has no rate constant on the trastuzumab-Cc input (
dCeff/dt = Ctrastuzumab - log(2)/T1/2rec * Ceff). Dimensionally this meansCeffis the integral ofCtrastuzumab dtdecaying at ratekrec, soCeffcarries unitsmg.day/Lrather thanmg/L. The paper labels EC50 inmg/L(Table 2), but the Hill expression requires the EC50 to share units withCeff. The numerical value reported (2.18e5) is several orders of magnitude larger than the typical trastuzumab steady-state plasma Cc (50-100 mg/L), which is consistent only withmg.day/L(typical Ceff_ss approximately Cc_ss / krec approximately 5,000-10,000 mg.day/L). We have left the parameter values exactly as the paper reports them; only the unit label in this file’sunitsblock is set tomg/L(concentration basis), with the integrated interpretation documented here.Trastuzumab PK is deterministic. Following the paper’s Methods (‘using fixed effect parameters from a previously published PK model’), the inlined Bruno 2005 trastuzumab PK retains the structural parameters and the WT / HER2_ECD / MET_GE4 covariates but omits the Bruno 2005 IIVs on CL and V. Only the LVEF parameters carry IIV.
Anthracycline dose entered in absolute mg, not mg/m^2. The K-PD amount compartment receives the paper’s absolute-dose column from Table 1 (median 110 mg doxorubicin, 170 mg epirubicin). BSA is not a covariate in the original analysis.
MET_GE4 set to 0 cohort-wide. Early breast cancer patients did not have metastatic disease by trial inclusion criteria; the inherited Bruno 2005 MET_GE4 covariate is retained for fidelity to the upstream PK model but is structurally zero in this cohort.
HER2_ECD distribution. de Vries Schultink 2018 did not tabulate baseline HER2 ECD for the LVEF cohort (early BC has lower ECD than Bruno 2005’s MBC cohort). The virtual cohort uses a log-normal distribution centred at the Bruno 2005 reference 8.23 ng/mL, capped at 80 ng/mL. The 200 ng/mL Bruno 2005 saturation cap remains active inside the model.
No NT-proBNP model. de Vries Schultink 2018 evaluated NT-proBNP as a third candidate cardiac biomarker but did not develop a model for it (‘NT-proBNP did not demonstrate a clear trend over time during anthracycline or trastuzumab treatment’). NT-proBNP is not included in either registered file.
Treatment-group (candesartan vs placebo) covariate not retained. Candesartan did not affect troponin T or LVEF parameters in the source analysis and is not encoded in either model file.
Cohort sex. The Boekhout 2016 parent trial enrolled early breast cancer patients; the cohort is documented as 100% female. The virtual cohort in this vignette uses 100% female; the synthetic WT distribution is centred at 70 kg without an explicit sex-stratum.