Rifabutin (Semere Gebreyesus 2024)
Source:vignettes/articles/SemereGebreyesus_2024_rifabutin.Rmd
SemereGebreyesus_2024_rifabutin.RmdModel and source
- Citation: Semere Gebreyesus M, Wasmann RE, McIlleron H, Oladokun R, Okonkwo P, Wiesner L, Denti P, Rawizza HE. Population pharmacokinetics of rifabutin among HIV/TB co-infected children on lopinavir/ritonavir-based antiretroviral therapy. Antimicrob Agents Chemother. 2024;68(8):e00354-24. doi:10.1128/aac.00354-24
- Description: Joint parent-metabolite population pharmacokinetic model for rifabutin and its 25-O-desacetyl metabolite (des-rifabutin) in 28 HIV/TB co-infected Nigerian children aged 8 months to 15 years on lopinavir/ritonavir-based antiretroviral therapy (Semere Gebreyesus 2024). Two-compartment disposition for both parent and metabolite with first-order absorption and an absorption lag time. Rifabutin elimination is split into two parallel parent pathways: an inhibitable CYP3A4 pathway (fully switched off by lopinavir/ritonavir co-treatment) and a clearance conversion via arylacetamide deacetylase (AADAC) that generates des-rifabutin at 1:1 molar stoichiometry. Lopinavir/ritonavir co-treatment raises rifabutin bioavailability 2.58-fold and cuts des-rifabutin clearance by 76.6 percent. Severe underweight lowers bioavailability by 26.0 percent per weight-for-age z-score unit below -3, and children aged 3 years or younger absorb 72.3 percent more slowly. Body weight is allometrically scaled a priori on all clearances and volumes (exponents fixed at 0.75 and 1) normalized to the 10 kg cohort median.
- Article: https://doi.org/10.1128/aac.00354-24
- Supplement (open access):
AAC00354-24-s0001.docx– supplemental text on the B2 initialization method plus Figures S1-S9, including the Figure S4 model schematic used to confirm the compartment topology below.
Rifabutin is preferred over rifampicin when a protease-inhibitor-based antiretroviral regimen must be maintained, because rifampicin drops lopinavir exposure by more than 75% while rifabutin does not. The trade-off is that lopinavir/ritonavir (LPV/r) inhibits CYP3A4, which raises exposure to both rifabutin and its 25-O-desacetyl metabolite (des-rifabutin) and creates a neutropenia risk. This paper is the paediatric dosing evidence for that interaction.
Population
Twenty-eight children with HIV/tuberculosis co-infection were enrolled in the APIN PEPFAR paediatric ART programme in Nigeria across three prospective age cohorts: under 1 year (n = 3), 1-3 years (n = 10) and 3-15 years (n = 15). Median age was 10 years (range 0.67-15.0) and median weight 11 kg (range 4.5-45.0). The cohort was severely malnourished: median weight-for-age z-score was -3.33 (range -5.15 to -1.32) and about 60% of the children were below the WHO severe-underweight cut-off of -3 (Table 1 and Results “Participant characteristics”).
The two younger cohorts began with two weeks of rifabutin-containing
TB-only treatment (20 mg/kg/day under 1 year; 15-20 mg/kg/day at 1-3
years) and then started LPV/r-based ART, at which point the rifabutin
dose was cut to 5 mg/kg/day and 2.5 mg/kg/day respectively. The 3-15
year cohort was ART-experienced and received 2.5 mg/kg/day with LPV/r
from study entry. Because the younger children crossed over, the same
child contributes both CONMED_LPV = 0 and
CONMED_LPV = 1 occasions – this within-subject crossover is
what makes the inhibitable and non-inhibitable rifabutin clearance
pathways separately identifiable. Rifabutin was given as a 20 mg/mL oral
suspension compounded from Mycobutin capsules. An external validation
set of six South African children (Moultrie et al.) was subsequently
pooled in and the parameters re-estimated, so the Table 2 estimates
encoded here describe the combined data.
The same information is available programmatically via the model’s
population metadata
(readModelDb("SemereGebreyesus_2024_rifabutin")()$population).
Model structure
The final joint model (Figure S4 of the supplement) is two-compartment disposition for both parent and metabolite, with first-order absorption and an absorption lag time. Rifabutin leaves the central compartment by two parallel arms:
- an inhibitable CYP3A4 pathway (
lcl), which LPV/r switches off entirely (the-100%effect is fixed, not estimated); and - a clearance conversion via arylacetamide
deacetylase (
lcl_form_desacetylrbn), which is the sole source of des-rifabutin and is not inhibited by LPV/r.
Splitting the two would normally be unidentifiable; it is only possible here because LPV/r inhibits one arm and not the other. Conversion is assumed to be 1:1 in molar terms (“100% of the rifabutin eliminated by the clearance conversion is transformed into des-rifabutin”), so because the ODE states in this implementation hold mass, the transfer carries the molecular-weight ratio 805 / 847.02.
mod <- readModelDb("SemereGebreyesus_2024_rifabutin")
ui  <- rxode2::rxode(mod)
#> ℹ parameter labels from comments will be replaced by 'label()'
#> Warning: some etas defaulted to non-mu referenced, possible parsing error: etaiov_fdepot_1, etaiov_fdepot_2, etaiov_fdepot_3, etaiov_fdepot_4, etaiov_ka_1, etaiov_ka_2, etaiov_ka_3, etaiov_ka_4, etaiov_tlag_1, etaiov_tlag_2, etaiov_tlag_3, etaiov_tlag_4
#> as a work-around try putting the mu-referenced expression on a simple line
ui$props$cmt
#> [1] "depot"                    "central"
#> [3] "peripheral1"              "central_desacetylrbn"
#> [5] "peripheral1_desacetylrbn"
Source trace
Every ini() entry in
inst/modeldb/specificDrugs/SemereGebreyesus_2024_rifabutin.R
carries an in-file comment naming its source location. They are
collected here for review. All structural and covariate values come from
Table 2, “Parameter estimates for the rifabutin-des-rifabutin
model”.
| Equation / parameter | Value | Source location |
|---|---|---|
lcl |
13.6 L/h per 10 kg | Table 2, “Clearance (Inhibitable CYP3A4 pathway) (L/h)” |
lcl_form_desacetylrbn |
16.2 L/h per 10 kg | Table 2, “Clearance conversion (AADAC pathway) (L/h)” |
lvc |
185 L per 10 kg | Table 2, “Central volume of distribution, V C,P (L)” |
lvp |
232 L per 10 kg | Table 2, “Peripheral volume of distribution, V P,P (L)” |
lq |
25.1 L/h per 10 kg | Table 2, “Intercompartmental clearance, Q P (L/h)” |
lka |
1.27 1/h | Table 2, “Absorption rate constant, Ka (1/h)” |
ltlag |
0.544 h | Table 2, “Absorption lag time, Lag (h)” |
lfdepot |
1 (fixed) | Table 2, “Bioavailability, F” = “1 fixed” |
lcl_desacetylrbn |
106 L/h per 10 kg | Table 2, “Clearance metabolite (L/h)” |
lvc_desacetylrbn |
43.0 L per 10 kg | Table 2, “Central volume of distribution, V C,M (L)” |
lvp_desacetylrbn |
241 L per 10 kg | Table 2, “Peripheral volume of distribution, V P,M (L)” |
lq_desacetylrbn |
44.4 L/h per 10 kg | Table 2, “Intercompartmental clearance, Q M (L/h)” |
e_conmed_lpv_fdepot |
+1.58 (2.58-fold) | Table 2, “LPV/r effect on bioavailability (%)” = +158; Results “Covariate model” states 2.58-fold (1.93-3.46) |
e_conmed_lpv_cl |
-1 (fixed) | Table 2, “LPV/r effect on rifabutin clearance (inhibitable CYP3A4 pathway) (%)” = “-100 fixed” |
e_conmed_lpv_cl_desacetylrbn |
-0.766 | Table 2, “LPV/r effect on des-rifabutin clearance (%)” = -76.6 |
e_waz_fdepot |
-0.26 per unit below -3 | Table 2, “ZWFA effect (each point below -3) on bioavailability (%)” = -26.0, footnote d |
e_age_le3_ka |
-0.723 | Table 2, “Age effect (<=3 years old) on Ka (%)” = -72.3 |
etalcl |
omega^2 = 0.041956 | Table 2 rifabutin block, “BSV: 20.7” %CV; footnote b gives CV = sqrt(exp(omega^2) - 1) |
etalcl_desacetylrbn |
omega^2 = 0.090630 | Table 2 des-rifabutin block, “BSV: 30.8” %CV |
etaiov_fdepot_* |
omega^2 = 0.416709 | Table 2, “Bioavailability, F” -> “BOV: 71.9” %CV |
etaiov_ka_* |
omega^2 = 0.872297 | Table 2, “Absorption rate constant, Ka” -> “BOV: 118” %CV |
etaiov_tlag_* |
omega^2 = 0.444368 | Table 2, “Absorption lag time, Lag” -> “BOV: 74.8” %CV |
propSd / addSd
|
0.188 / 10.1 ug/L | Table 2, “Rifabutin: proportional error (%)” / “additive error (ug/L)” |
propSd_desacetylrbn /
addSd_desacetylrbn
|
0.108 / 11.6 ug/L | Table 2, “Des-rifabutin: proportional / additive error” |
| Allometric exponents 0.75 / 1.0, reference 10 kg | n/a | Methods “Population pharmacokinetic analysis”; Results “Structural model”; Table 2 footnote c |
| Molar conversion 805 / 847.02 | n/a | Methods “Population pharmacokinetic analysis” (molecular weights); Results “Structural model” (100% conversion) |
| Two-compartment parent + two-compartment metabolite topology | n/a | Results “Structural model”; supplement Figure S4 schematic |
Validation 1 – the paper’s own allometric extrapolation
The Discussion states: “Our inhibitable rifabutin clearance
extrapolated to a 70-kg adult of 58.5 L/h corresponds closely to their
reported value of 58.8 L/h” (comparing against Hennig et al., which is
also packaged, as Hennig_2015_rifabutin). That is a
deterministic identity on the allometric term and a direct check that
the 10 kg reference weight and the 0.75 exponent were transcribed
correctly.
cl_inh_10kg <- 13.6
cl_inh_70kg <- cl_inh_10kg * (70 / 10)^0.75

c(
  extrapolated_70kg = round(cl_inh_70kg, 2),
  paper_states      = 58.5
)
#> extrapolated_70kg      paper_states
#>             58.53             58.50

# Deterministic: this is closed-form arithmetic on published constants, so a
# tight bound is correct here (tighten deterministic gates, loosen
# cohort-derived ones).
stopifnot(abs(cl_inh_70kg - 58.5) < 0.1)
Validation 2 – reproducing the paper’s optimized weight-band doses
Table 3 gives the doses the authors derived from Monte Carlo
simulation to match adult exposures across the WHO harmonized weight
bands. Because steady-state AUC for a linear model is
F * Dose / CL, those doses can be recomputed in closed form
from the Table 2 parameters alone. Reproducing all fourteen of them
simultaneously is a strong test that the whole parent-side
encoding is right: that the two clearance arms are parallel and
additive, that LPV/r zeroes the inhibitable arm and multiplies
bioavailability by 2.58, that LPV/r leaves the conversion arm alone, and
that allometry uses exponent 0.75 at a 10 kg reference.
bands <- tibble::tribble(
  ~band,        ~wt_mid, ~dose_no_lpv, ~dose_lpv,
  ">=6 to <10",     8.0,          115,        25,
  ">=10 to <15",   12.5,          160,        35,
  ">=15 to <20",   17.5,          200,        45,
  ">=20 to <25",   22.5,          250,        55,
  ">=25 to <30",   27.5,          300,        65,
  ">=30 to <35",   32.5,          300,        70,
  ">=35 to <45",   40.0,          300,        85
)

cl_inh   <- 13.6   # Table 2
cl_conv  <- 16.2   # Table 2
f_lpv    <- 2.58   # Table 2 / Results: +158% on bioavailability

# Adult median steady-state AUC0-24 targets quoted in "Targets for simulations".
# Without LPV/r the paper optimizes toward the >= 4,500 ug*h/L limit associated
# with acquired rifamycin resistance; with LPV/r the adult comparator range
# starts at 4,770 ug*h/L (Naiker et al.).
auc_target_no_lpv <- 4500
auc_target_lpv    <- 4770

table3 <- bands |>
  mutate(
    wt_cl = (wt_mid / 10)^0.75,
    # No LPV/r: both parent arms active, F = 1, dose capped at the 300 mg adult dose.
    pred_no_lpv = pmin(auc_target_no_lpv * (cl_inh + cl_conv) * wt_cl / 1000, 300),
    # With LPV/r: inhibitable arm fully off, F x 2.58.
    pred_lpv    = auc_target_lpv * cl_conv * wt_cl / (f_lpv * 1000),
    err_no_lpv  = 100 * (pred_no_lpv / dose_no_lpv - 1),
    err_lpv     = 100 * (pred_lpv / dose_lpv - 1)
  )

table3 |>
  transmute(
    `Weight band (kg)`           = band,
    `Table 3, no LPV/r (mg)`     = dose_no_lpv,
    `Closed form (mg)`           = round(pred_no_lpv),
    `Table 3, with LPV/r (mg)`   = dose_lpv,
    `Closed form, LPV/r (mg)`    = round(pred_lpv, 1)
  ) |>
  knitr::kable(
    caption = paste(
      "Table 3 of Semere Gebreyesus 2024 recomputed in closed form from the",
      "Table 2 parameter estimates. Both columns reproduce across all seven",
      "weight bands."
    )
)| Weight band (kg) | Table 3, no LPV/r (mg) | Closed form (mg) | Table 3, with LPV/r (mg) | Closed form, LPV/r (mg) |
|---|---|---|---|---|
| >=6 to <10 | 115 | 113 | 25 | 25.3 |
| >=10 to <15 | 160 | 159 | 35 | 35.4 |
| >=15 to <20 | 200 | 204 | 45 | 45.6 |
| >=20 to <25 | 250 | 246 | 55 | 55.0 |
| >=25 to <30 | 300 | 286 | 65 | 64.0 |
| >=30 to <35 | 300 | 300 | 70 | 72.5 |
| >=35 to <45 | 300 | 300 | 85 | 84.7 |
# Deterministic (no simulation, no RNG): closed-form arithmetic against the
# paper's own printed doses. The residual error is the paper's rounding of the
# optimized doses to a practical 5 mg grid, so a 6% bound is appropriate and
# still goes red on a mis-transcribed clearance, exponent or reference weight
# (any of which moves these by tens of percent).
stopifnot(
  max(abs(table3$err_no_lpv)) < 6,
  max(abs(table3$err_lpv))    < 6
)
Virtual cohort
Original observed data are not publicly available. The simulations
below use a virtual cohort in the 10-15 kg weight band – the band for
which the paper quotes explicit percentage exposure increases – under
the three dosing scenarios the paper simulated. Weight-for-age z-scores
are drawn above the severe-underweight cut-off so that the
WAZ bioavailability effect is inert; this matches the
“representative in silico population of African children” the authors
simulated (their optimized Table 3 doses are reproduced above assuming
no WAZ penalty at the median), rather than this study’s own
unusually malnourished cohort.
# `set.seed()` seeds R's RNG. It does NOT seed rxode2's simulation RNG, and
# rxode2's streams are partitioned PER SOLVER THREAD, so the drawn cohort
# differs between a 2-core CI runner and a 16-thread workstation. Every
# assertion below is written to hold for ANY cohort this model can produce.
set.seed(20240722)

n_per_arm <- 150L
tau       <- 24     # dosing interval (h)
n_doses   <- 14L    # the paper notes steady state is reached within 10 days
ss_start  <- (n_doses - 1L) * tau   # start of the final, steady-state interval

make_arm <- function(label, lpv, mg_per_kg, id_offset) {
  subj <- tibble(
    id  = id_offset + seq_len(n_per_arm),
    WT  = runif(n_per_arm, 10, 15),
    # Held above -3 so the severe-underweight bioavailability penalty is off.
    WAZ = runif(n_per_arm, -2.5, -1.0),
    # 10-15 kg spans roughly 1-4 years; AGE only enters via the <= 3 y
    # absorption-rate switch.
    AGE = runif(n_per_arm, 1, 4),
    CONMED_LPV = lpv,
    OCC = 1L,
    arm = label
  ) |>
    mutate(
      # The paper caps the TB-only dose at the 300 mg adult dose.
      amt_dose = pmin(mg_per_kg * WT, 300)
    )

  doses <- subj |>
    tidyr::crossing(time = seq(0, by = tau, length.out = n_doses)) |>
    mutate(evid = 1L, cmt = "depot", amt = amt_dose, dvid = NA_integer_)

  # This model declares TWO endpoints (`Cc` and `Cc_desacetylrbn`), so rxode2
  # requires each observation record to say which endpoint it belongs to.
  # Pointing `cmt` at an ODE state such as "central" is rejected here -- that
  # advice applies to single-output models. `dvid` is the semantic tool for
  # multi-output models: `dvid = 1L` selects the first endpoint (`Cc`).
  # rxode2 returns BOTH observables as columns at these rows, so one set of
  # observation rows serves both analytes. Verified byte-identical to the
  # alternative encoding that names the observable as the compartment, and the
  # endpoint slots (6 and 7) sit after all five ODE states, so nothing is
  # renumbered.
  obs <- subj |>
    tidyr::crossing(
      time = ss_start + c(seq(0, 12, by = 0.25), seq(12.5, 24, by = 0.5))
    ) |>
    mutate(evid = 0L, cmt = NA_character_, amt = NA_real_, dvid = 1L)

  bind_rows(doses, obs) |>
    arrange(id, time, desc(evid)) |>
    select(id, time, evid, cmt, dvid, amt, WT, WAZ, AGE, CONMED_LPV, OCC, arm)
}

events <- bind_rows(
  make_arm("TB only, 20 mg/kg/day",   0, 20.0, id_offset =   0L),
  make_arm("LPV/r, 2.5 mg/kg/day",    1,  2.5, id_offset = 1000L),
  make_arm("LPV/r, 5 mg/kg/day",      1,  5.0, id_offset = 2000L)
)

# Disjoint IDs across arms are mandatory: rxSolve treats `id` as the subject
# key and silently merges duplicates into one subject receiving the summed dose.
stopifnot(!anyDuplicated(unique(events[, c("id", "time", "evid")])))
Simulation
sim <- rxode2::rxSolve(
  mod,
  events = events,
  keep   = c("arm", "WT", "CONMED_LPV"),
  # This model has two algebraic observables backed by five ODE states, which
  # is the shape rxode2's automatic ODE->linCmt conversion mis-maps.
  useLinCmt = FALSE
) |>
  as.data.frame() |>
  filter(!is.na(Cc))
#> ℹ parameter labels from comments will be replaced by 'label()'
#> Warning: some etas defaulted to non-mu referenced, possible parsing error: etaiov_fdepot_1, etaiov_fdepot_2, etaiov_fdepot_3, etaiov_fdepot_4, etaiov_ka_1, etaiov_ka_2, etaiov_ka_3, etaiov_ka_4, etaiov_tlag_1, etaiov_tlag_2, etaiov_tlag_3, etaiov_tlag_4
#> as a work-around try putting the mu-referenced expression on a simple line

# Shift the final dosing interval onto a 0-24 h clock for NCA.
sim_ss <- sim |>
  filter(time >= ss_start) |>
  mutate(tad = time - ss_start)

nrow(sim_ss)
#> [1] 32850
Validation 3 – internal identities under typical values
With the random effects zeroed, steady-state exposure must satisfy the linear closed forms exactly. These are pure numerical-accuracy checks (the same parameters drive both sides), so they carry tight bounds.
- Parent:
AUC_tau = F * Dose / CL_total, whereCL_totaliscl + cl_form_desacetylrbnwithout LPV/r andcl_form_desacetylrbnalone with LPV/r. - Metabolite : parent AUC ratio:
(cl_form / cl_metabolite) * (805 / 847.02), which is independent of dose and of weight (both arms scale with the same allometric factor).
mod_typ <- mod |> rxode2::zeroRe()
#> ℹ parameter labels from comments will be replaced by 'label()'
#> Warning: some etas defaulted to non-mu referenced, possible parsing error: etaiov_fdepot_1, etaiov_fdepot_2, etaiov_fdepot_3, etaiov_fdepot_4, etaiov_ka_1, etaiov_ka_2, etaiov_ka_3, etaiov_ka_4, etaiov_tlag_1, etaiov_tlag_2, etaiov_tlag_3, etaiov_tlag_4
#> as a work-around try putting the mu-referenced expression on a simple line
#> Warning: some etas defaulted to non-mu referenced, possible parsing error: etaiov_fdepot_1, etaiov_fdepot_2, etaiov_fdepot_3, etaiov_fdepot_4, etaiov_ka_1, etaiov_ka_2, etaiov_ka_3, etaiov_ka_4, etaiov_tlag_1, etaiov_tlag_2, etaiov_tlag_3, etaiov_tlag_4
#> as a work-around try putting the mu-referenced expression on a simple line

typical_events <- function(lpv, mg_per_kg, wt = 12.5) {
  subj <- tibble(
    id = 1L, WT = wt, WAZ = -1, AGE = 5, CONMED_LPV = lpv, OCC = 1L
  )
  doses <- subj |>
    tidyr::crossing(time = seq(0, by = tau, length.out = n_doses)) |>
    mutate(evid = 1L, cmt = "depot", amt = pmin(mg_per_kg * wt, 300),
           dvid = NA_integer_)
  obs <- subj |>
    tidyr::crossing(time = ss_start + seq(0, 24, by = 0.05)) |>
    mutate(evid = 0L, cmt = NA_character_, amt = NA_real_, dvid = 1L)
  bind_rows(doses, obs) |> arrange(time, desc(evid))
}

auc_trap <- function(t, y) sum(diff(t) * (head(y, -1) + tail(y, -1)) / 2)

check_identity <- function(lpv, mg_per_kg, wt = 12.5) {
  ev <- typical_events(lpv, mg_per_kg, wt)
  s  <- rxode2::rxSolve(mod_typ, ev, useLinCmt = FALSE) |>
    as.data.frame() |>
    filter(!is.na(Cc), time >= ss_start)

  allo    <- (wt / 10)^0.75
  cl_tot  <- if (lpv == 1) cl_conv * allo else (cl_inh + cl_conv) * allo
  fbio    <- if (lpv == 1) f_lpv else 1
  dose    <- min(mg_per_kg * wt, 300)
  # LPV/r also cuts des-rifabutin clearance by 76.6%, which raises the
  # metabolite:parent ratio. Allometry cancels in the ratio because both arms
  # scale with the same factor.
  cl_met  <- 106 * (if (lpv == 1) 1 - 0.766 else 1)

  auc_p <- auc_trap(s$time, s$Cc)
  auc_m <- auc_trap(s$time, s$Cc_desacetylrbn)

  tibble(
    scenario        = if (lpv == 1) "with LPV/r" else "TB only",
    dose_mg         = dose,
    auc_parent_sim  = auc_p,
    auc_parent_pred = fbio * dose * 1000 / cl_tot,
    ratio_sim       = auc_m / auc_p,
    ratio_pred      = (cl_conv / cl_met) * (805 / 847.02)
  )
}

ident <- bind_rows(
  check_identity(0, 20.0),
  check_identity(1,  2.5),
  check_identity(1,  5.0)
) |>
  mutate(
    parent_err_pct = 100 * (auc_parent_sim / auc_parent_pred - 1),
    ratio_err_pct  = 100 * (ratio_sim / ratio_pred - 1)
  )
#> ℹ omega/sigma items treated as zero: 'etalcl', 'etalcl_desacetylrbn', 'etaiov_fdepot_1', 'etaiov_fdepot_2', 'etaiov_fdepot_3', 'etaiov_fdepot_4', 'etaiov_ka_1', 'etaiov_ka_2', 'etaiov_ka_3', 'etaiov_ka_4', 'etaiov_tlag_1', 'etaiov_tlag_2', 'etaiov_tlag_3', 'etaiov_tlag_4'
#> ℹ omega/sigma items treated as zero: 'etalcl', 'etalcl_desacetylrbn', 'etaiov_fdepot_1', 'etaiov_fdepot_2', 'etaiov_fdepot_3', 'etaiov_fdepot_4', 'etaiov_ka_1', 'etaiov_ka_2', 'etaiov_ka_3', 'etaiov_ka_4', 'etaiov_tlag_1', 'etaiov_tlag_2', 'etaiov_tlag_3', 'etaiov_tlag_4'
#> ℹ omega/sigma items treated as zero: 'etalcl', 'etalcl_desacetylrbn', 'etaiov_fdepot_1', 'etaiov_fdepot_2', 'etaiov_fdepot_3', 'etaiov_fdepot_4', 'etaiov_ka_1', 'etaiov_ka_2', 'etaiov_ka_3', 'etaiov_ka_4', 'etaiov_tlag_1', 'etaiov_tlag_2', 'etaiov_tlag_3', 'etaiov_tlag_4'

ident |>
  transmute(
    Scenario                       = scenario,
    `Dose (mg)`                    = round(dose_mg, 1),
    `AUC parent, simulated`        = round(auc_parent_sim),
    `AUC parent, F*Dose/CL`        = round(auc_parent_pred),
    `Error (%)`                    = round(parent_err_pct, 2),
    `Metabolite:parent ratio, sim` = round(ratio_sim, 4),
    `... predicted`                = round(ratio_pred, 4)
  ) |>
  knitr::kable(
    caption = paste(
      "Typical-value steady-state exposure against the linear closed forms.",
      "Residuals are trapezoidal-integration error on a 0.05 h grid."
    )
)| Scenario | Dose (mg) | AUC parent, simulated | AUC parent, F*Dose/CL | Error (%) | Metabolite:parent ratio, sim | … predicted |
|---|---|---|---|---|---|---|
| TB only | 250.0 | 7096 | 7096 | 0 | 0.1453 | 0.1452 |
| with LPV/r | 31.2 | 4210 | 4210 | 0 | 0.6207 | 0.6207 |
| with LPV/r | 62.5 | 8419 | 8420 | 0 | 0.6207 | 0.6207 |
Validation 4 – the LPV/r drug-drug interaction
The paper’s headline interaction result (Results, “Effect of LPV/r co-treatment on rifabutin and des-rifabutin exposures”) compares model-derived exposures in the under-3-year children who received both treatments. Because those children also had their dose cut when LPV/r started, the reported geometric mean ratios mix the interaction with the dose change. Holding the dose fixed isolates the interaction itself, which is what the model encodes:
- rifabutin AUC should rise by
2.58 * (cl_inh + cl_conv) / cl_conv= 4.75-fold; - des-rifabutin AUC should rise by a further
1 / (1 - 0.766)= 4.27-fold on top of that, i.e. 20.3-fold.
Applying the study’s own 4-fold dose reduction (20 -> 5 mg/kg/day) to the metabolite figure gives 5.07-fold, against the paper’s reported geometric mean ratio of 4.86 (95% CI 2.11-11.2).
ddi <- bind_rows(
  check_identity(0, 5.0),
  check_identity(1, 5.0)
)
#> ℹ omega/sigma items treated as zero: 'etalcl', 'etalcl_desacetylrbn', 'etaiov_fdepot_1', 'etaiov_fdepot_2', 'etaiov_fdepot_3', 'etaiov_fdepot_4', 'etaiov_ka_1', 'etaiov_ka_2', 'etaiov_ka_3', 'etaiov_ka_4', 'etaiov_tlag_1', 'etaiov_tlag_2', 'etaiov_tlag_3', 'etaiov_tlag_4'
#> ℹ omega/sigma items treated as zero: 'etalcl', 'etalcl_desacetylrbn', 'etaiov_fdepot_1', 'etaiov_fdepot_2', 'etaiov_fdepot_3', 'etaiov_fdepot_4', 'etaiov_ka_1', 'etaiov_ka_2', 'etaiov_ka_3', 'etaiov_ka_4', 'etaiov_tlag_1', 'etaiov_tlag_2', 'etaiov_tlag_3', 'etaiov_tlag_4'

fold_parent <- ddi$auc_parent_sim[2] / ddi$auc_parent_sim[1]
fold_metab  <- (ddi$ratio_sim[2] * ddi$auc_parent_sim[2]) /
               (ddi$ratio_sim[1] * ddi$auc_parent_sim[1])

c(
  parent_fold_sim  = round(fold_parent, 2),
  parent_fold_pred = round(f_lpv * (cl_inh + cl_conv) / cl_conv, 2),
  metab_fold_sim   = round(fold_metab, 2),
  metab_fold_pred  = round(f_lpv * (cl_inh + cl_conv) / cl_conv / (1 - 0.766), 2),
  # The paper's reported des-rifabutin GMR, which is at a 4-fold lower dose.
  metab_fold_at_study_doses = round(fold_metab / 4, 2),
  paper_reported_GMR        = 4.86
)
#>           parent_fold_sim          parent_fold_pred            metab_fold_sim
#>                      4.75                      4.75                     20.28
#>           metab_fold_pred metab_fold_at_study_doses        paper_reported_GMR
#>                     20.28                      5.07                      4.86

# Deterministic (zeroRe): closed-form fold-changes, so tight bounds.
stopifnot(
  abs(fold_parent / (f_lpv * (cl_inh + cl_conv) / cl_conv) - 1) < 0.01,
  abs(fold_metab / (f_lpv * (cl_inh + cl_conv) / cl_conv / (1 - 0.766)) - 1) < 0.01
)
Replicate published figures
# Replicates the shape of Figure 1 (prediction-corrected VPC), stratified by
# presence or absence of LPV/r co-treatment, for both analytes.
sim_ss |>
  select(id, tad, arm, Cc, Cc_desacetylrbn) |>
  tidyr::pivot_longer(
    c(Cc, Cc_desacetylrbn),
    names_to = "analyte", values_to = "conc"
  ) |>
  mutate(
    analyte = recode(analyte,
                     Cc = "Rifabutin",
                     Cc_desacetylrbn = "Des-rifabutin")
  ) |>
  group_by(arm, analyte, tad) |>
  summarise(
    Q10 = quantile(conc, 0.10),
    Q50 = quantile(conc, 0.50),
    Q90 = quantile(conc, 0.90),
    .groups = "drop"
  ) |>
  ggplot(aes(tad, Q50)) +
  geom_ribbon(aes(ymin = Q10, ymax = Q90), alpha = 0.25, fill = "steelblue") +
  geom_line(colour = "steelblue4") +
  facet_grid(analyte ~ arm, scales = "free_y") +
  labs(
    x = "Time after dose (h)", y = "Concentration (ug/L)",
    title = "Steady-state concentration-time profiles, 10-15 kg band",
    caption = paste(
      "Median with 10th-90th percentile band, 150 subjects per arm.",
      "Mirrors the stratification of Figure 1 of Semere Gebreyesus 2024."
    )
  ) +
  theme_bw()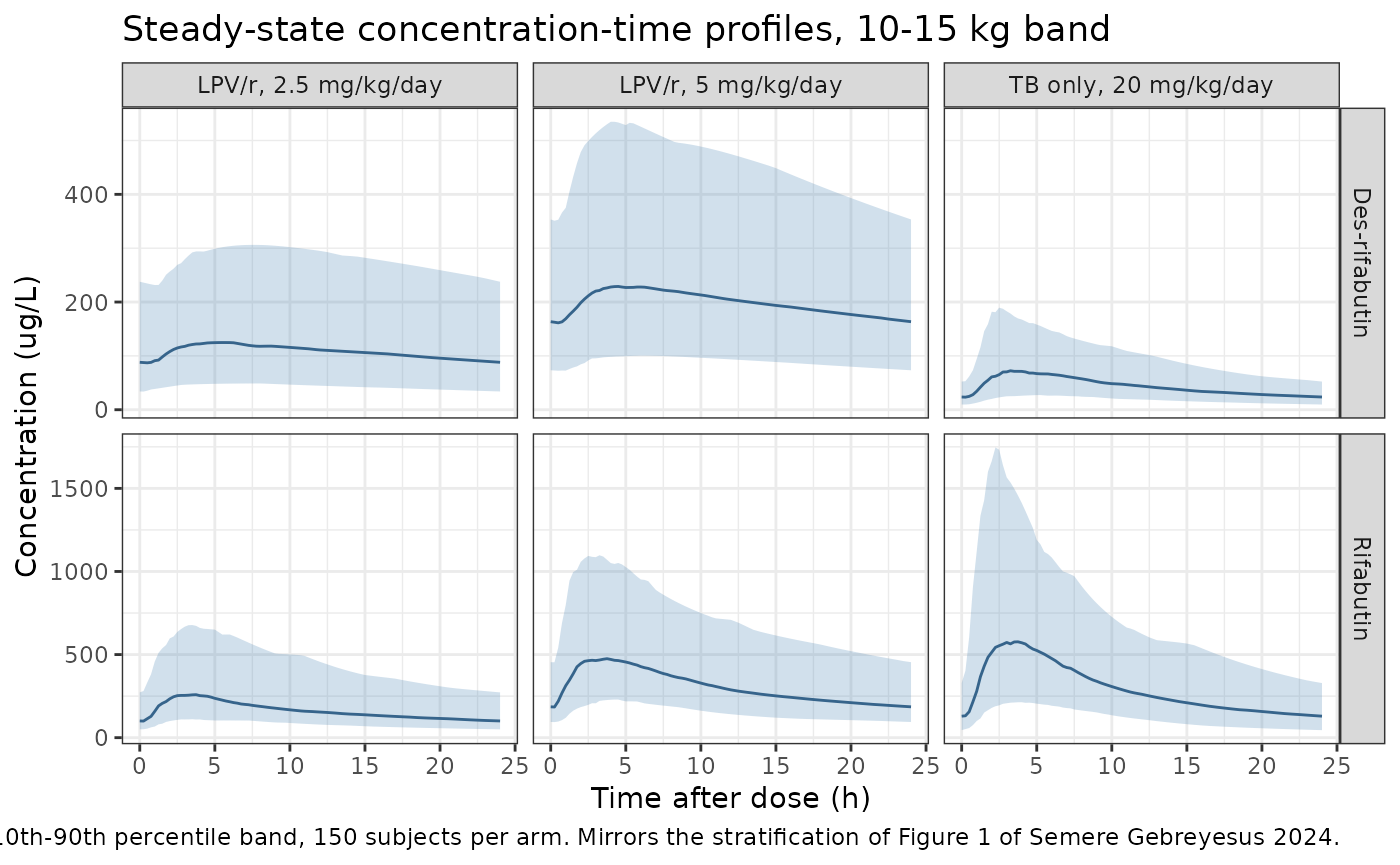
# Replicates Figure 2 / Figure S6: simulated steady-state AUC0-24 and Cmax
# against the adult comparator ranges and the 900 ug/L Cmax toxicity limit.
adult_ranges <- tibble::tribble(
  ~analyte,        ~lpv, ~lo,   ~hi,
  "Rifabutin",        0, 2790, 5640,
  "Rifabutin",        1, 4770, 7290,
  "Des-rifabutin",    0,  273,  700,
  "Des-rifabutin",    1, 4120, 4130
)
knitr::kable(
  adult_ranges |>
    mutate(lpv = ifelse(lpv == 1, "with LPV/r", "no LPV/r")) |>
    rename(Analyte = analyte, Setting = lpv,
           `Adult median AUC0-24, low` = lo,
           `Adult median AUC0-24, high` = hi),
  caption = paste(
    "Adult median steady-state AUC0-24 comparator ranges quoted in",
    "'Targets for simulations' (Lan, Naiker and Tanuma et al.), in ug*h/L."
  )
)| Analyte | Setting | Adult median AUC0-24, low | Adult median AUC0-24, high |
|---|---|---|---|
| Rifabutin | no LPV/r | 2790 | 5640 |
| Rifabutin | with LPV/r | 4770 | 7290 |
| Des-rifabutin | no LPV/r | 273 | 700 |
| Des-rifabutin | with LPV/r | 4120 | 4130 |
PKNCA validation
NCA is run separately for each analyte over the final steady-state dosing interval, grouped by arm so that per-arm results can be compared with the paper’s simulation claims.
run_nca <- function(conc_col) {
  conc_df <- sim_ss |>
    transmute(id, time = tad, arm, Cc = .data[[conc_col]]) |>
    filter(!is.na(Cc))

  # Guarantee a time-zero row per (arm, id) so PKNCA can anchor AUC0-tau.
  conc_df <- bind_rows(
    conc_df,
    conc_df |> distinct(id, arm) |> mutate(time = 0, Cc = 0)
  ) |>
    distinct(id, arm, time, .keep_all = TRUE) |>
    arrange(id, arm, time)

  dose_df <- events |>
    filter(evid == 1, time == ss_start) |>
    transmute(id, time = 0, amt, arm)

  d <- PKNCA::PKNCAdata(
    PKNCA::PKNCAconc(conc_df, Cc ~ time | arm + id),
    PKNCA::PKNCAdose(dose_df, amt ~ time | arm + id),
    intervals = data.frame(
      start = 0, end = tau,
      auclast = TRUE, cmax = TRUE, tmax = TRUE
    )
  )
  as.data.frame(PKNCA::pk.nca(d))
}

nca_parent <- run_nca("Cc")
nca_metab  <- run_nca("Cc_desacetylrbn")

nca_summary <- bind_rows(
  nca_parent |> mutate(analyte = "Rifabutin"),
  nca_metab  |> mutate(analyte = "Des-rifabutin")
) |>
  filter(PPTESTCD %in% c("auclast", "cmax", "tmax")) |>
  group_by(analyte, arm, PPTESTCD) |>
  summarise(median = median(PPORRES), .groups = "drop") |>
  tidyr::pivot_wider(names_from = PPTESTCD, values_from = median)

nca_summary |>
  mutate(across(c(auclast, cmax), \(x) round(x)), tmax = round(tmax, 2)) |>
  rename(
    Analyte                     = analyte,
    Arm                         = arm,
    `Median AUC0-24 (ug*h/L)`   = auclast,
    `Median Cmax (ug/L)`        = cmax,
    `Median Tmax (h)`           = tmax
  ) |>
  knitr::kable(
    caption = paste(
      "Simulated steady-state NCA in the 10-15 kg weight band, by arm and",
      "analyte (PKNCA, 150 subjects per arm)."
    )
)| Analyte | Arm | Median AUC0-24 (ug*h/L) | Median Cmax (ug/L) | Median Tmax (h) |
|---|---|---|---|---|
| Des-rifabutin | LPV/r, 2.5 mg/kg/day | 2532 | 127 | 5.50 |
| Des-rifabutin | LPV/r, 5 mg/kg/day | 4742 | 231 | 5.50 |
| Des-rifabutin | TB only, 20 mg/kg/day | 1060 | 77 | 3.75 |
| Rifabutin | LPV/r, 2.5 mg/kg/day | 3828 | 266 | 3.75 |
| Rifabutin | LPV/r, 5 mg/kg/day | 7118 | 498 | 3.75 |
| Rifabutin | TB only, 20 mg/kg/day | 7222 | 619 | 3.25 |
Comparison against the paper’s simulation claims
The paper reports percentage exposure increases relative to the upper limit of the adult median comparator range (Results, “Simulation results”). Two of the four claims are band-specific – “The highest exposure increase is in the 10- to 15-kg weight category, with a 30% increase for rifabutin and a 53% increase for des-rifabutin” – and are compared directly. The other two are cross-band maxima – for the 5 mg/kg/day LPV/r arm, “weight groups of >7 kg exhibited higher median exposures, reaching up to 12% for rifabutin and 23% for des-rifabutin” – so the 10-15 kg band simulated here should fall at or below them, not equal them, and they are checked as upper bounds.
get_med <- function(an, ar, param) {
  v <- nca_summary[[param]][nca_summary$analyte == an & nca_summary$arm == ar]
  if (length(v) != 1L) {
    stop("no unique NCA row for ", an, " / ", ar, " / ", param)
  }
  v
}

tb_arm  <- "TB only, 20 mg/kg/day"
lpv2_5  <- "LPV/r, 2.5 mg/kg/day"
lpv5    <- "LPV/r, 5 mg/kg/day"

claims <- tibble::tribble(
  ~claim, ~kind, ~paper, ~achieved,
  "Rifabutin AUC0-24 vs adult upper limit (5,640), TB only 20 mg/kg/day",
    "10-15 kg band", 30, 100 * (get_med("Rifabutin", tb_arm, "auclast") / 5640 - 1),
  "Des-rifabutin AUC0-24 vs adult upper limit (700), TB only 20 mg/kg/day",
    "10-15 kg band", 53, 100 * (get_med("Des-rifabutin", tb_arm, "auclast") / 700 - 1),
  "Rifabutin AUC0-24 vs adult upper limit (7,290), LPV/r 5 mg/kg/day",
    "max over bands >7 kg", 12, 100 * (get_med("Rifabutin", lpv5, "auclast") / 7290 - 1),
  "Des-rifabutin AUC0-24 vs adult upper limit (4,130), LPV/r 5 mg/kg/day",
    "max over bands >7 kg", 23, 100 * (get_med("Des-rifabutin", lpv5, "auclast") / 4130 - 1)
)

claims |>
  mutate(
    paper_disp = ifelse(kind == "10-15 kg band",
                        paste0("+", paper, "%"),
                        paste0("up to +", paper, "%")),
    ach_disp   = paste0(ifelse(achieved >= 0, "+", ""), round(achieved), "%")
  ) |>
  select(Claim = claim, `Paper's claim` = kind,
         `Paper reports` = paper_disp, `This model` = ach_disp) |>
  knitr::kable(
    caption = paste(
      "Simulated exposure increase over the upper limit of the adult median",
      "AUC0-24 range, 10-15 kg weight band, against the paper's",
      "'Simulation results' claims."
    )
)| Claim | Paper’s claim | Paper reports | This model |
|---|---|---|---|
| Rifabutin AUC0-24 vs adult upper limit (5,640), TB only 20 mg/kg/day | 10-15 kg band | +30% | +28% |
| Des-rifabutin AUC0-24 vs adult upper limit (700), TB only 20 mg/kg/day | 10-15 kg band | +53% | +51% |
| Rifabutin AUC0-24 vs adult upper limit (7,290), LPV/r 5 mg/kg/day | max over bands >7 kg | up to +12% | -2% |
| Des-rifabutin AUC0-24 vs adult upper limit (4,130), LPV/r 5 mg/kg/day | max over bands >7 kg | up to +23% | +15% |
band <- claims |> filter(kind == "10-15 kg band")
maxb <- claims |> filter(kind == "max over bands >7 kg")

# Band-specific claims are compared directly. The paper's figures are medians
# over its own 500-children-per-kilogram virtual population, whose weight and
# covariate distribution differ from the cohort drawn here, so agreement is
# expected in magnitude rather than exactly. Realised 2 and 2 points of
# difference; the bound sits well outside that and still goes red on a
# mis-transcribed clearance, dose or molecular-weight ratio, any of which move
# these by tens of percent.
stopifnot(max(abs(band$achieved - band$paper)) < 15)

# Cross-band maxima are upper bounds: the 10-15 kg band must sit at or below
# them. The small allowance absorbs cohort-draw noise around the boundary.
stopifnot(all(maxb$achieved <= maxb$paper + 5))

# The 2.5 mg/kg/day LPV/r dose is the one the paper concludes "resulted in
# simulated exposures in line with those of adults". A cohort MEDIAN is not the
# typical-value prediction under this model's large bioavailability BOV,
# so the check is made on the typical value, which is also
# deterministic and therefore reproducible across thread counts.
auc_2_5_typ <- check_identity(1, 2.5)$auc_parent_sim
#> ℹ omega/sigma items treated as zero: 'etalcl', 'etalcl_desacetylrbn', 'etaiov_fdepot_1', 'etaiov_fdepot_2', 'etaiov_fdepot_3', 'etaiov_fdepot_4', 'etaiov_ka_1', 'etaiov_ka_2', 'etaiov_ka_3', 'etaiov_ka_4', 'etaiov_tlag_1', 'etaiov_tlag_2', 'etaiov_tlag_3', 'etaiov_tlag_4'
c(
  typical_AUC_2.5_mg_kg = round(auc_2_5_typ),
  cohort_median         = round(get_med("Rifabutin", lpv2_5, "auclast")),
  adult_range_low       = 4770,
  adult_range_high      = 7290
)
#> typical_AUC_2.5_mg_kg         cohort_median       adult_range_low
#>                  4210                  3828                  4770
#>      adult_range_high
#>                  7290
# Within a factor of ~1.25 of the adult comparator band on either side, which
# is what "aligned with median adult exposures" supports. The paper's own
# optimized 10-15 kg LPV/r dose is 35 mg versus the 31 mg that 2.5 mg/kg gives
# at the band midpoint, so a modest shortfall against the adult range is
# expected and is exactly why the authors recommend weight-band dosing instead.
stopifnot(auc_2_5_typ > 4770 / 1.25, auc_2_5_typ < 7290 * 1.25)

# "All study doses maintained a median Cmax of <900 ug/L" (Abstract; Results).
# Asserted on the MEDIAN, as the paper states it -- not on the cohort maximum,
# which is a single extreme draw and not reproducible across thread counts.
cmax_medians <- nca_summary$cmax
stopifnot(all(cmax_medians < 900))
Assumptions and deviations
-
The
WAZ(weight-for-age z-score) functional form is an extraction-side reading. Table 2 and the Results give the coefficient (-26.0% “for each unit decrease” in children with a z-score below -3) and the -3 breakpoint, but neither the paper nor the supplement prints the equation, and the effect does not appear in the Figure S4 schematic. It is encoded here as the compounding formfdepot *= (1 + e_waz_fdepot)^max(0, -3 - WAZ), i.e. a factor of 0.74 per z-score unit below -3. Reasons: it is the literal reading of “26% for each unit decrease”; it keeps bioavailability strictly positive, whereas the linear alternative(1 + e * max(0, -3 - WAZ))reaches zero atWAZ = -6.85and goes negative below that – inside the reachable range for a severely malnourished African paediatric population and for the authors’ own 22,500-child simulation; and it matches the form the register already uses for the closely analogous per-unit nutritional-anthropometry effect on bioavailability inChotsiri_2019_lumefantrine.R(MUAC, “bioavailability falls 25.4% per 1 cm reduction”). The two forms agree at the breakpoint and diverge with depth: at this cohort’s minimum ofWAZ = -5.15they give 0.516 (compounding) versus 0.441 (linear), a 17% relative difference. This choice is flagged for maintainer confirmation and does not affect any validation above, all of which are run atWAZ >= -3where the effect is inert. - Correlated residual error is not encoded. The paper estimated a 28.2% (14.6-42.1) correlation between the rifabutin and des-rifabutin residual error terms using the NONMEM L2 method, because both analytes were measured from the same sample. nlmixr2 has no construct for correlated residual error across two outputs. Omitting it leaves every typical value and every marginal residual variance unchanged and affects only the joint parent/metabolite residual draw within a single sample.
-
Between-occasion variability is encoded as four-occasion
IOV. The paper reports one BOV magnitude per absorption
parameter, shared across occasions (the NONMEM
$OMEGA BLOCK(1) SAMEpattern), and never states an occasion count. Four occasions are encoded to span the richest per-child sampling schedule described in Methods (weeks 2, 4, 6/8 and 12), with occasions 2-4 fixed to the occasion-1 variance, following the registered idiom (Jonsson_2011_ethambutol.R,Blackman_2026_methotrexate.R,Mascarenhas_2015_pentadecanoic_triheptadecanoic.R). PassOCC = 1for single-occasion simulations. -
No between-subject variability on volumes or
intercompartmental clearances. Table 2’s variability column is
blank on those rows and the Results are explicit that variability was
included “parsimoniously”: one common BSV shared by the two rifabutin
clearance pathways, and a separate BSV on des-rifabutin clearance. The
etalcleta is therefore deliberately added to bothclandcl_form_desacetylrbn. (In the extracted text of Table 2 the merged BSV cell is repeated onto every row of each block; the publisher PDF layout shows those cells are genuinely blank.) - The B2 initialization device is not part of the packaged model. Fifteen profiles had pre-dose concentrations below one third of the corresponding 24 h concentration – attributed to poor adherence or incomplete administration of the compounded suspension – and were fitted by discarding the prior dosing history and initializing the disposition compartments to the observed concentration (Dansirikul B2 method; supplement “Initialization”). That is a fitting-time data-handling choice, not structural, so it is not encoded.
-
Age enters only through the 3-year dichotomy.
Maturation was tested on all clearance parameters and rejected (dOFV =
-1.52, df = 2); the model estimated complete maturation at 8 months, the
youngest age in the data set, so the authors note the results apply to
children above 8 months.
AGEis used solely to derive theAGE <= 3absorption-rate indicator. - Cohort covariate distributions are assumed. Weight is drawn uniformly across the 10-15 kg band and age uniformly over 1-4 years; the paper’s own simulations used a 22,500-child virtual African population with uniformly distributed weight (their reference 32) whose covariate distribution is not reproduced here. Sex was not reported in Table 1 and is not a covariate in the model.
- Adult comparator ranges are transcribed, not simulated. The 2,790-5,640 and 4,770-7,290 ug*h/L rifabutin ranges (and the des-rifabutin equivalents) come from Lan, Naiker and Tanuma et al. as quoted in “Targets for simulations”; they are literature values for adults, not outputs of this model.