Maraviroc in vitro CYP3A4 N-dealkylation kinetics (Hyland 2008)
Source:vignettes/articles/Hyland_2008_maraviroc_invitro.Rmd
Hyland_2008_maraviroc_invitro.RmdModel and source
- Citation: Hyland R, Dickins M, Collins C, Jones H, Jones B. Maraviroc: in vitro assessment of drug-drug interaction potential. Br J Clin Pharmacol. 2008;66(4):498-507. doi:10.1111/j.1365-2125.2008.03198.x. PMID: 18647303. PMCID: PMC2561101. Michaelis-Menten equation with the impurity term and the Km / Vmax estimates: Results, ‘Kinetics of maraviroc N-dealkylation in human liver microsomes’, and Figure 2. Substrate-depletion intrinsic clearance, microsomal CYP content and fraction unbound in microsomes: Results, ‘CLint estimates from HLM and rCYP’. Incubation design and bioanalytical precision: Materials and methods, ‘Assays for maraviroc metabolism’. The statement that UK-408,027 formation is approximately 20% of the depletion intrinsic clearance is in the Discussion, second paragraph.
- Article: https://doi.org/10.1111/j.1365-2125.2008.03198.x
- PubMed Central open-access copy: https://www.ncbi.nlm.nih.gov/pmc/articles/PMC2561101/
This paper contributes two model files, one per in vitro system in which the authors characterised the same reaction:
mod_hlm <- rxode2::rxode(readModelDb("Hyland_2008_maraviroc_hlm"))
mod_rec <- rxode2::rxode(readModelDb("Hyland_2008_maraviroc_rcyp3a4"))

# Fixed and estimated ini() values are not returned as columns by rxSolve(), so
# read them straight off the packaged model when a check needs one.
ini_val <- function(mod, nm) {
  stopifnot(nm %in% mod$iniDf$name)
  mod$iniDf$est[mod$iniDf$name == nm]
}

cat(mod_hlm$description)
#> In vitro (pooled human liver microsomes, 60 donors). Michaelis-Menten enzyme-kinetic model of the CYP3A4-mediated N-dealkylation of maraviroc to its secondary-amine metabolite UK-408,027, plus the parallel oxidative routes that make up the remainder of maraviroc's microsomal intrinsic clearance. The published fit is a standard Michaelis-Menten velocity with an additive impurity term, v = Vmax * [S] / (Km + [S]) + C * [S], where C absorbs a concentration-dependent UK-408,027 contaminant present in the maraviroc substrate; the authors report that fitting impurity-corrected data to a plain Michaelis-Menten equation gave similar Km and Vmax, and C itself is not published, so it is carried here fixed at zero. The UK-408,027 route accounts for Vmax/Km = 0.0214 uL/min/pmol CYP, which is 20% of the 0.106 uL/min/pmol total depletion intrinsic clearance measured by substrate loss; the balance is assigned to the other CYP3A4-mediated oxidative pathways as a first-order route, because substrate depletion was measured only at 1 uM, far below Km, and so characterises a linear clearance. Sibling model: Hyland_2008_maraviroc_rcyp3a4, the same reaction characterised in recombinant CYP3A4 Supersomes.
cat(mod_rec$description)
#> In vitro (recombinant human CYP3A4 Supersomes). Michaelis-Menten enzyme-kinetic model of the CYP3A4-mediated N-dealkylation of maraviroc to its secondary-amine metabolite UK-408,027 in heterologously expressed CYP3A4, plus the parallel CYP3A4-mediated oxidative routes that make up the remainder of maraviroc's intrinsic clearance in the same system. The UK-408,027 route accounts for Vmax/Km = 0.23 uL/min/pmol CYP3A4 of the 1.7 uL/min/pmol CYP3A4 total depletion intrinsic clearance; the balance is assigned to the other oxidative pathways as a first-order route, because substrate depletion was measured only at 1 uM, far below Km, and so characterises a linear clearance. The model also carries the intersystem extrapolation factor of 0.2 with which the paper scales the recombinant intrinsic clearance to a human liver microsome basis, reproducing the 0.34 uL/min/pmol and 40.8 uL/min/mg values that were the CLint input to the maraviroc Simcyp model. No impurity term is carried, because in the recombinant system the substrate contaminant was subtracted by comparison against control Supersomes rather than fitted. Sibling model: Hyland_2008_maraviroc_hlm, the same reaction characterised in pooled human liver microsomes.
Scope: what this paper does and does not contribute
Hyland 2008 has two halves.
The first half is an in vitro reaction-phenotyping and
enzyme-kinetics study of maraviroc N-dealkylation to its
secondary-amine metabolite UK-408,027, the most abundant circulating
metabolite in humans. Chemical inhibition and a recombinant-CYP panel
localise the reaction to CYP3A4, and Michaelis-Menten kinetics are
characterised in two systems: a 60-donor human liver microsome pool and
recombinant CYP3A4 Supersomes. Every constant of that layer is printed –
the fitted equation, Km, Vmax, the
substrate-depletion intrinsic clearance, the microsomal CYP content, the
intersystem extrapolation factor and the fraction unbound in microsomes.
That is the layer this vignette validates and that the two model files
carry.
The second half uses those in vitro data as inputs to a whole-body
Simcyp physiologically based model (version 7.01) to
predict drug-drug interactions with ketoconazole, ritonavir, saquinavir
and atazanavir. That layer is not extracted. The paper
prints the compound-level Simcyp inputs (Table 1) but none of the
platform physiology the model consumes: no tissue volumes, no organ
blood flows, no microsomal protein per gram of liver, no liver weight
and no hepatic CYP3A4 abundance, so the printed CLint never
becomes an L/h clearance. Tissue-to-plasma partition
coefficients were estimated with the Poulin tissue-composition
equations, which is a named method rather than a set of
values; the required LogD input is not printed
either. The Simcyp predictions in Table 3 are therefore recorded here as
published results, not reproduced.
In vitro systems
pop_hlm <- readModelDb("Hyland_2008_maraviroc_hlm")()$population
pop_rec <- readModelDb("Hyland_2008_maraviroc_rcyp3a4")()$population

tibble::tibble(
  Field = c("species", "system", "kinetic incubation", "depletion incubation",
            "concentration range", "replication"),
  `Human liver microsomes` = c(pop_hlm$species, pop_hlm$system,
                               pop_hlm$kinetic_incubation, pop_hlm$depletion_incubation,
                               pop_hlm$concentration_range, pop_hlm$replication),
  `Recombinant CYP3A4` = c(pop_rec$species, pop_rec$system,
                           pop_rec$kinetic_incubation, pop_rec$depletion_incubation,
                           pop_rec$concentration_range, pop_rec$replication)
) |>
knitr::kable()| Field | Human liver microsomes | Recombinant CYP3A4 |
|---|---|---|
| species | in vitro (pooled human liver microsomes, 60 donors) | in vitro (recombinant human CYP3A4 Supersomes) |
| system | Human liver microsomes prepared from a pool of 60 donors (BD Biosciences), incubated in 50 mM phosphate buffer pH 7.4 with 1 mM MgCl2 and an NADPH-regenerating isocitric acid / isocitric acid dehydrogenase system; final incubation volume 100 uL | Supersomes (BD Biosciences) expressing recombinant human CYP3A4, incubated in 50 mM phosphate buffer pH 7.4 with 1 mM MgCl2 and an NADPH-regenerating isocitric acid / isocitric acid dehydrogenase system; final incubation volume 100 uL |
| kinetic incubation | 0.1 mg/mL microsomal protein for 15 min, within the ranges over which UK-408,027 formation was linear with time (up to 20 min) and with protein (up to 0.5 mg/mL) | 10 pmol CYP3A4/mL for 15 min, within the ranges over which UK-408,027 formation was linear with time (up to 20 min) and with CYP content (up to 50 pmol/mL) |
| depletion incubation | 1 uM maraviroc at 0.5 uM total CYP for up to 60 min; the first-order rate constant was taken as the gradient of ln(maraviroc / midazolam peak-area ratio) against incubation time | 1 uM maraviroc at 100 pmol recombinant CYP for up to 60 min; rates more stable than the 0.06 uL/pmol/min assay cut-off were reported as below that limit |
| concentration range | 1 to 1000 uM maraviroc for the kinetic characterisation; 1 uM for substrate depletion and 50 uM for metabolite formation in the chemical-inhibition experiments | 1 to 1000 uM maraviroc for the kinetic characterisation; 1 uM for substrate depletion and 50 uM for metabolite formation in the CYP-panel experiments |
| replication | Km and Vmax are the mean of seven determinations (Figure 2); the chemical-inhibition results are the mean of quadruplicate determinations (Table 2) | Km and Vmax are the mean of four determinations (Figure 4); the recombinant CYP panel results are the mean of quadruplicate determinations (Figure 3) |
Both systems were incubated at 37 C in 50 mM phosphate buffer pH 7.4 with 1 mM MgCl2, with reducing equivalents supplied by NADPH regenerated in situ by an isocitric acid / isocitric acid dehydrogenase system, in a final volume of 100 uL. The microsomal pool was prepared from 60 donors. There is no patient population and no dosing: the “dose” of each model is the maraviroc concentration spiked into the incubation at time zero.
Source trace
Every ini() entry carries an in-file comment naming its
source location. The table below collects them.
| Model | Equation / parameter | Value | Source location |
|---|---|---|---|
| both | v = Vmax * [S] / (Km + [S]) + C * [S] |
n/a | Results, “Kinetics of maraviroc N-dealkylation in human liver microsomes” (display equation) |
| HLM | km_cyp3a4 |
21 uM | Results, same section; Abstract; Figure 2 |
| HLM | vmax_cyp3a4 |
0.45 pmol/pmol total CYP/min | Results, same section; Abstract; Figure 2 |
| HLM | c_impurity |
not published, carried at 0 | Results, same section (named in the equation only) |
| HLM | clint |
0.106 uL/min/pmol total CYP | Results, “CLint estimates from HLM and rCYP”; Table 2 footnote |
| HLM | cyp_total |
330 pmol/mg protein | Results, “CLint estimates from HLM and rCYP” |
| HLM | fumic |
0.72 at 1.5 mg/mL | Results, “CLint estimates from HLM and rCYP” |
| HLM | prot_inc |
0.1 mg/mL | Results, “Kinetics of maraviroc N-dealkylation in human liver microsomes” |
| rCYP3A4 | km_cyp3a4 |
13 uM | Results, “Kinetics of maraviroc N-dealkylation by rCYP3A4”; Abstract; Figure 4 |
| rCYP3A4 | vmax_cyp3a4 |
3 pmol/pmol CYP3A4/min | Results, same section; Abstract; Figure 4 |
| rCYP3A4 | clint |
1.7 uL/min/pmol CYP3A4 | Results, “CLint estimates from HLM and rCYP”; Figure 3; Table 1 |
| rCYP3A4 | isef |
0.2 | Results, “CLint estimates from HLM and rCYP” (from Proctor 2004, reference 13) |
| rCYP3A4 | cyp3a4_content |
120 pmol/mg protein | Results, “CLint estimates from HLM and rCYP” |
| rCYP3A4 | fumic |
0.86 at 0.63 mg/mL | Results, “CLint estimates from HLM and rCYP”; Table 1 |
| rCYP3A4 | cyp_inc |
10 pmol/mL | Results, “Kinetics of maraviroc N-dealkylation by rCYP3A4” |
| both | propSd |
0.051 | Materials and methods, “Metabolite formation assay” (assay CV at the 50 ng standard) |
| both | clint_other = clint - Vmax/Km |
derived | Discussion, second paragraph (“approximately 20% of maraviroc intrinsic clearance”) |
Dimensional analysis
The two systems report Vmax and CLint on a
per-pmol-CYP basis while the states hold uM concentrations, so each ODE
term needs one explicit conversion.
| Term | Symbol units | Product | Required |
|---|---|---|---|
cyp_inc (HLM) |
prot_inc mg/mL x cyp_total pmol/mg |
pmol CYP/mL | pmol CYP/mL |
rate_uk408027 |
pmol/(pmol CYP min) x pmol CYP/mL | pmol/(mL min) = nmol/(L min) | uM/min, hence /1000
|
clint_uk408027 = vmax/km |
(pmol/(pmol CYP min)) / (pmol/uL) | uL/(min pmol CYP) | uL/(min pmol CYP) |
rate_other |
uL/(min pmol CYP) x uM x pmol CYP/mL | uL/(mL min) x uM | uM/min, hence /1000
|
clint_mg |
uL/(min pmol CYP) x pmol CYP/mg | uL/(min mg) | uL/(min mg) |
clint_u_mg |
uL/(min mg) / unitless | uL/(min mg) | uL/(min mg) |
Note that 1 pmol/mL is 1 nmol/L, which is 0.001 uM: that is the
entire content of the two /1000 factors, and getting it
wrong would misstate every rate by three orders of magnitude.
Non-applicability of NCA: these are static enzyme incubations with no dose, no absorption and no distribution phase, so there is no exposure metric for PKNCA to integrate. Following the mechanistic-model validation pattern, the checks below are instead structural identities, flux checks and figure replication.
Simulation grid
Both models are deterministic – the paper reports no between-experiment random effects – so the simulations below are single-replicate solves over a grid of starting maraviroc concentrations spanning the 1 to 1000 uM range the kinetic experiments used.
# 41 log-spaced substrate concentrations across the experimental range, well
# under the 200-per-arm cohort cap (these are concentrations, not subjects).
s_grid <- exp(seq(log(1), log(1000), length.out = 41))

solve_grid <- function(mod, s0, times = seq(0, 15, by = 0.5)) {
  ev <- rxode2::et(times)
  out <- lapply(seq_along(s0), function(i) {
    r <- rxode2::rxSolve(mod, ev, inits = c(maraviroc = s0[i]),
                         returnType = "data.frame")
    r$s0 <- s0[i]
    r
  })
  dplyr::bind_rows(out)
}

sim_hlm <- solve_grid(mod_hlm, s_grid)
sim_rec <- solve_grid(mod_rec, s_grid)

# Initial velocities: the quantity Figures 2 and 4 plot against [S].
v0 <- dplyr::bind_rows(
  dplyr::filter(sim_hlm, time == 0) |>
    dplyr::transmute(system = "Human liver microsomes", s0, v = vUK408027),
  dplyr::filter(sim_rec, time == 0) |>
    dplyr::transmute(system = "Recombinant CYP3A4", s0, v = vUK408027)
)
head(v0)
#>                   system       s0          v
#> 1 Human liver microsomes 1.000000 0.02045455
#> 2 Human liver microsomes 1.188502 0.02410375
#> 3 Human liver microsomes 1.412538 0.02836100
#> 4 Human liver microsomes 1.678804 0.03331136
#> 5 Human liver microsomes 1.995262 0.03904578
#> 6 Human liver microsomes 2.371374 0.04565920
Replicating Figure 2 and Figure 4
Replicates Figure 2 (human liver microsomes) and Figure 4 (recombinant CYP3A4) of Hyland 2008: the Michaelis-Menten plot of UK-408,027 formation velocity against maraviroc concentration, with the Eadie-Hofstee transform as the inset.
ggplot(v0, aes(s0, v)) +
  geom_line(linewidth = 0.8) +
  facet_wrap(~system, scales = "free_y") +
  labs(x = "Maraviroc concentration (uM)",
       y = "UK-408,027 formation (pmol / pmol CYP / min)") +
  theme_bw()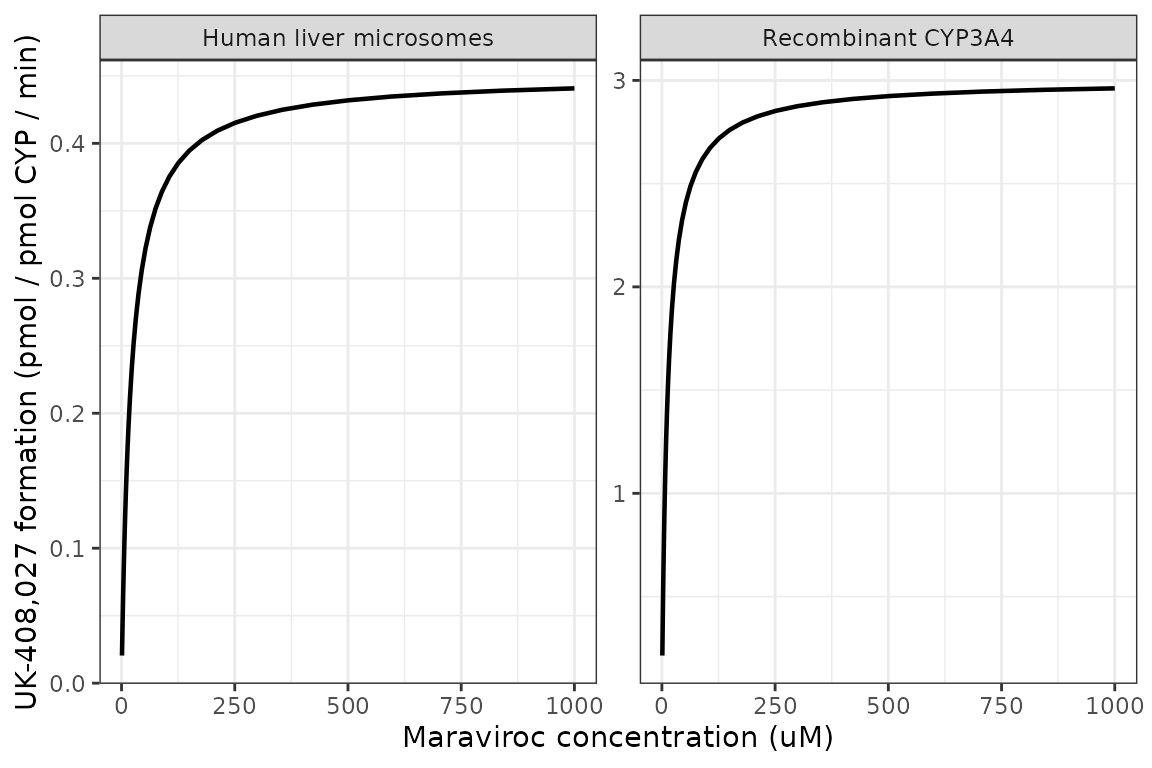
Michaelis-Menten plots of UK-408,027 formation. Replicates Figure 2 (human liver microsomes) and Figure 4 (recombinant CYP3A4) of Hyland 2008.
ggplot(v0, aes(v / s0, v)) +
  geom_line(linewidth = 0.8) +
  facet_wrap(~system, scales = "free") +
  labs(x = "v / [S]", y = "v (pmol / pmol CYP / min)") +
  theme_bw()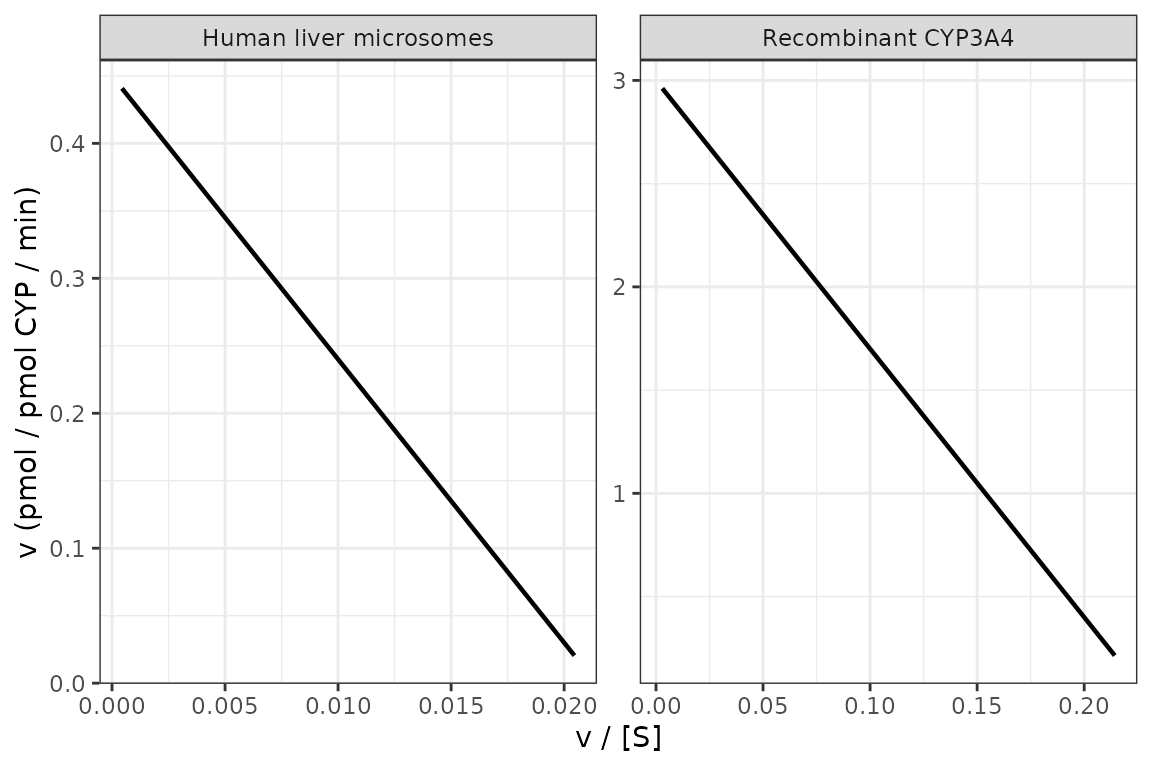
Eadie-Hofstee transforms. Replicates the insets of Figure 2 and Figure 4 of Hyland 2008; the slope is -Km and the y intercept is Vmax.
The Eadie-Hofstee transform is a linear identity of the
Michaelis-Menten form, so its slope must recover -Km and
its intercept Vmax exactly. Because the human liver
microsome model also carries the additive impurity term, the check is
run with c_impurity at its published-structure default of
zero, where the two forms coincide.
eh <- v0 |>
  dplyr::group_by(system) |>
  dplyr::group_modify(function(d, key) {
    fit <- stats::lm(v ~ I(v / s0), data = d)
    tibble::tibble(km_recovered = -unname(stats::coef(fit)[2]),
                   vmax_recovered = unname(stats::coef(fit)[1]))
  }) |>
  dplyr::ungroup() |>
  dplyr::mutate(km_published = c(21, 13), vmax_published = c(0.45, 3))

knitr::kable(eh, digits = 6)| system | km_recovered | vmax_recovered | km_published | vmax_published |
|---|---|---|---|---|
| Human liver microsomes | 21 | 0.45 | 21 | 0.45 |
| Recombinant CYP3A4 | 13 | 3.00 | 13 | 3.00 |
stopifnot(
  isTRUE(all.equal(eh$km_recovered, eh$km_published, tolerance = 1e-8)),
  isTRUE(all.equal(eh$vmax_recovered, eh$vmax_published, tolerance = 1e-8))
)
A second, independent identity: the velocity at [S] = Km
must be exactly half of Vmax in both systems.
half <- dplyr::bind_rows(
  dplyr::filter(solve_grid(mod_hlm, 21, times = 0), time == 0) |>
    dplyr::transmute(system = "Human liver microsomes", v = vUK408027, vmax = 0.45),
  dplyr::filter(solve_grid(mod_rec, 13, times = 0), time == 0) |>
    dplyr::transmute(system = "Recombinant CYP3A4", v = vUK408027, vmax = 3)
)

knitr::kable(dplyr::mutate(half, ratio = v / vmax), digits = 8)| system | v | vmax | ratio |
|---|---|---|---|
| Human liver microsomes | 0.225 | 0.45 | 0.5 |
| Recombinant CYP3A4 | 1.500 | 3.00 | 0.5 |
Reproducing the published intrinsic-clearance chain
The paper carries the substrate-depletion intrinsic clearance through four arithmetic steps in Results, “CLint estimates from HLM and rCYP”. Each printed intermediate is a transcription check on the constants the model files carry, and each is computed by the packaged model rather than restated here.
d0_hlm <- dplyr::filter(sim_hlm, time == 0)[1, ]
d0_rec <- dplyr::filter(sim_rec, time == 0)[1, ]

clint_chain <- tibble::tibble(
  Quantity = c(
    "HLM CLint per mg microsomal protein",
    "HLM CLint per mg, unbound basis",
    "rCYP3A4 CLint after the intersystem extrapolation factor",
    "rCYP3A4 CLint per mg microsomal protein",
    "rCYP3A4 CLint per mg, unbound basis"
  ),
  Units = c("uL/min/mg", "uL/min/mg", "uL/min/pmol CYP3A4",
            "uL/min/mg", "uL/min/mg"),
  Model = c(d0_hlm$clint_mg, d0_hlm$clint_u_mg, d0_rec$clint_isef,
            d0_rec$clint_mg, d0_rec$clint_u_mg),
  Published = c(35.0, 48.6, 0.34, 40.8, 47.4)
) |>
  dplyr::mutate(pct_diff = 100 * (Model - Published) / Published)

clint_chain |>
  dplyr::rename("Percent difference" = pct_diff) |>
knitr::kable(digits = 3)| Quantity | Units | Model | Published | Percent difference |
|---|---|---|---|---|
| HLM CLint per mg microsomal protein | uL/min/mg | 34.980 | 35.00 | -0.057 |
| HLM CLint per mg, unbound basis | uL/min/mg | 48.583 | 48.60 | -0.034 |
| rCYP3A4 CLint after the intersystem extrapolation factor | uL/min/pmol CYP3A4 | 0.340 | 0.34 | 0.000 |
| rCYP3A4 CLint per mg microsomal protein | uL/min/mg | 40.800 | 40.80 | 0.000 |
| rCYP3A4 CLint per mg, unbound basis | uL/min/mg | 47.442 | 47.40 | 0.088 |
# Every step is a printed value rounded to three significant figures, so the
# model must land within rounding of each one.
stopifnot(max(abs(clint_chain$pct_diff)) < 0.15)
The paper’s own cross-system conclusion also falls out: the two unbound intrinsic clearances, reached by completely different scaling routes, agree to within a few percent, which is the evidence the authors give that CYP3A4 is the enzyme responsible in both systems.
Reproducing the “approximately 20%” route split
The Discussion states that in human liver microsomes “the intrinsic
clearance based upon UK-408,027 formation is approximately 20% of
maraviroc intrinsic clearance calculated from substrate depletion
experiments”. That claim is a one-line consistency check across three
independently reported numbers – Km, Vmax and
the depletion CLint – and is what justifies the model’s
split of maraviroc loss into the saturable UK-408,027 route and a
first-order remainder.
split_tbl <- tibble::tibble(
  system = c("Human liver microsomes", "Recombinant CYP3A4"),
  clint_uk408027 = c(d0_hlm$clint_uk408027, d0_rec$clint_uk408027),
  clint_depletion = c(ini_val(mod_hlm, "clint"), ini_val(mod_rec, "clint")),
  clint_other = c(d0_hlm$clint_other, d0_rec$clint_other)
) |>
  dplyr::mutate(share_pct = 100 * clint_uk408027 / clint_depletion)

split_tbl |>
  dplyr::rename(
    "In vitro system" = system,
    "UK-408,027 CLint (uL/min/pmol CYP)" = clint_uk408027,
    "Depletion CLint (uL/min/pmol CYP)" = clint_depletion,
    "Other routes (uL/min/pmol CYP)" = clint_other,
    "UK-408,027 share (%)" = share_pct
  ) |>
knitr::kable(digits = 4)| In vitro system | UK-408,027 CLint (uL/min/pmol CYP) | Depletion CLint (uL/min/pmol CYP) | Other routes (uL/min/pmol CYP) | UK-408,027 share (%) |
|---|---|---|---|---|
| Human liver microsomes | 0.0214 | 0.106 | 0.0846 | 20.2156 |
| Recombinant CYP3A4 | 0.2308 | 1.700 | 1.4692 | 13.5747 |
# The Discussion's "approximately 20%" for human liver microsomes.
stopifnot(abs(split_tbl$share_pct[1] - 20) < 1)
# Both remainders must be positive, or the depletion clearance would be smaller
# than the single route it contains and the split would be incoherent.
stopifnot(all(split_tbl$clint_other > 0))
Mass balance
Maraviroc leaving the substrate state must be fully accounted for by UK-408,027 formed plus the flux down the other oxidative routes. The check below integrates the other-route flux over the incubation and confirms the three quantities close.
# The argument names are dot-prefixed so they cannot be shadowed by the
# same-named `clint_other` and `cyp_inc` columns of the solved data frame under
# dplyr's data masking.
mass_balance <- function(sim, .clint_other, .cyp_inc) {
  sim |>
    dplyr::group_by(s0) |>
    dplyr::arrange(time, .by_group = TRUE) |>
    dplyr::summarise(
      consumed = dplyr::first(Cmaraviroc) - dplyr::last(Cmaraviroc),
      formed = dplyr::last(uk408027),
      # Trapezoidal integral of clint_other * C * cyp_inc / 1000 over the run.
      other = sum(diff(time) *
                    (utils::head(Cmaraviroc, -1) + utils::tail(Cmaraviroc, -1)) / 2) *
        .clint_other * .cyp_inc / 1000,
      .groups = "drop"
    ) |>
    dplyr::mutate(residual = consumed - formed - other,
                  rel_residual = residual / consumed)
}

mb_hlm <- mass_balance(sim_hlm, d0_hlm$clint_other, d0_hlm$cyp_inc)
mb_rec <- mass_balance(sim_rec, d0_rec$clint_other, ini_val(mod_rec, "cyp_inc"))

knitr::kable(
  dplyr::bind_rows(
    dplyr::mutate(utils::head(mb_hlm, 3), system = "Human liver microsomes"),
    dplyr::mutate(utils::head(mb_rec, 3), system = "Recombinant CYP3A4")
  ) |>
    dplyr::select(system, dplyr::everything()),
  digits = 6
)| system | s0 | consumed | formed | other | residual | rel_residual |
|---|---|---|---|---|---|---|
| Human liver microsomes | 1.000000 | 0.050671 | 0.009878 | 0.040793 | 0e+00 | 0e+00 |
| Human liver microsomes | 1.188502 | 0.060128 | 0.011643 | 0.048485 | 0e+00 | 0e+00 |
| Human liver microsomes | 1.412538 | 0.071330 | 0.013703 | 0.057627 | 0e+00 | 0e+00 |
| Recombinant CYP3A4 | 1.000000 | 0.223375 | 0.028632 | 0.194744 | -1e-06 | -5e-06 |
| Recombinant CYP3A4 | 1.188502 | 0.265127 | 0.033630 | 0.231498 | -1e-06 | -5e-06 |
| Recombinant CYP3A4 | 1.412538 | 0.314615 | 0.039420 | 0.275197 | -2e-06 | -5e-06 |
Substrate depletion
The depletion experiments were run at 1 uM maraviroc, far below both
systems’ Km, so loss is effectively first order with rate
constant clint * cyp_inc / 1000. Reproducing the log-linear
decline confirms the depletion arm is wired with the right sign and the
right unit conversion.
dep <- dplyr::bind_rows(
  solve_grid(mod_hlm, 1, times = seq(0, 60, by = 1)) |>
    dplyr::transmute(system = "Human liver microsomes", time, Cmaraviroc),
  solve_grid(mod_rec, 1, times = seq(0, 60, by = 1)) |>
    dplyr::transmute(system = "Recombinant CYP3A4", time, Cmaraviroc)
)

ggplot(dep, aes(time, Cmaraviroc, colour = system)) +
  geom_line(linewidth = 0.8) +
  scale_y_log10() +
  labs(x = "Incubation time (min)", y = "Maraviroc (uM)", colour = NULL) +
  theme_bw() +
  theme(legend.position = "bottom")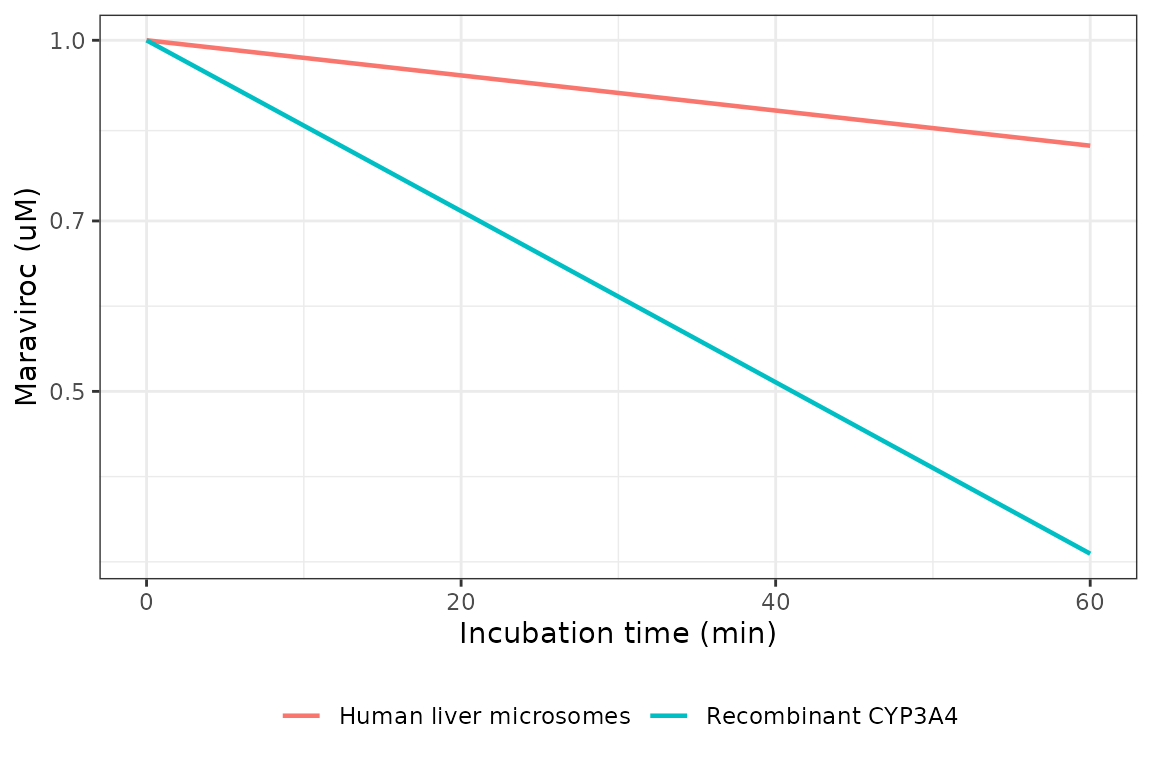
Simulated maraviroc depletion at the 1 uM substrate concentration of the depletion assay, at the CYP concentrations used for the kinetic incubations.
first_order <- dep |>
  dplyr::group_by(system) |>
  dplyr::group_modify(function(d, key) {
    fit <- stats::lm(log(Cmaraviroc) ~ time, data = d)
    tibble::tibble(k_fitted = -unname(stats::coef(fit)[2]))
  }) |>
  dplyr::ungroup() |>
  dplyr::mutate(
    k_expected = c(
      ini_val(mod_hlm, "clint") * d0_hlm$cyp_inc / 1000,
      ini_val(mod_rec, "clint") * ini_val(mod_rec, "cyp_inc") / 1000
    ),
    pct_diff = 100 * (k_fitted - k_expected) / k_expected
  )

knitr::kable(first_order, digits = 6)| system | k_fitted | k_expected | pct_diff |
|---|---|---|---|
| Human liver microsomes | 0.003469 | 0.003498 | -0.832658 |
| Recombinant CYP3A4 | 0.016895 | 0.017000 | -0.615493 |
Comparison against the paper’s independently measured activities
Two rates measured in other experiments of the same paper are predicted by the kinetic models rather than being inputs to them, so they are genuine external comparisons. Both were measured at 50 uM maraviroc.
v50 <- dplyr::bind_rows(
  dplyr::filter(solve_grid(mod_hlm, 50, times = 0), time == 0) |>
    dplyr::transmute(system = "Human liver microsomes",
                     v_model_per_cyp = vUK408027,
                     # Table 2's control activity is per mg protein, so scale by
                     # the total CYP content of the microsomal pool.
                     v_model = vUK408027 * ini_val(mod_hlm, "cyp_total"),
                     units = "pmol/mg/min",
                     v_observed = 75.9,
                     observed_source = "Table 2 footnote, uninhibited control"),
  dplyr::filter(solve_grid(mod_rec, 50, times = 0), time == 0) |>
    dplyr::transmute(system = "Recombinant CYP3A4",
                     v_model_per_cyp = vUK408027,
                     v_model = vUK408027,
                     units = "pmol/pmol CYP/min",
                     v_observed = 1.7,
                     observed_source = "Figure 3 and Discussion")
) |>
  dplyr::mutate(pct_diff = 100 * (v_model - v_observed) / v_observed)

v50 |>
  dplyr::select(system, units, v_model, v_observed, pct_diff, observed_source) |>
  dplyr::rename("In vitro system" = system, "Units" = units,
                "Model" = v_model, "Observed" = v_observed,
                "Percent difference" = pct_diff, "Observed source" = observed_source) |>
knitr::kable(digits = 3)| In vitro system | Units | Model | Observed | Percent difference | Observed source |
|---|---|---|---|---|---|
| Human liver microsomes | pmol/mg/min | 104.577 | 75.9 | 37.783 | Table 2 footnote, uninhibited control |
| Recombinant CYP3A4 | pmol/pmol CYP/min | 2.381 | 1.7 | 40.056 | Figure 3 and Discussion |
Both model predictions run about 40% above the separately measured
activities. The two comparisons are not perfectly matched: the Table 2
control activity and the Figure 3 panel come from the
reaction-phenotyping experiments, which used different microsome and
Supersome preparations from the kinetic runs and a single substrate
concentration rather than a fitted curve, and the paper reports the
phenotyping values as means of quadruplicate determinations with
standard deviations that are not tabulated. The bias is in the same
direction and of similar magnitude in both systems, which is what an
inter-preparation activity difference looks like. No parameter has been
adjusted to close it; the model carries the published Km
and Vmax exactly.
Published results not reproduced here
For completeness, the paper’s Simcyp predictions are recorded below as published values. They are outputs of the whole-body platform model described under “Scope” above and are not computed by either packaged model.
| Maraviroc | Inhibitor | Clinical mean AUC ratio (90% CI) | Simcyp median, time based (90% CI) | Simcyp median, steady state (90% CI) |
|---|---|---|---|---|
| 100 mg bid | Ketoconazole 400 mg qd | 5.0 (4.0, 6.3) | 4.6 (2.7, 9.1) | 5.2 (2.8, 10.6) |
| 100 mg bid | Ritonavir 100 mg bid | 2.6 (1.9, 3.6) | 2.6 (1.9, 4.7) | 2.6 (1.8, 4.6) |
| 300 mg bid | Atazanavir 400 mg qd | 3.6 (3.3, 3.9) | 5.0 (2.4, 7.8) | 4.9 (2.6, 9.6) |
| 100 mg bid | Saquinavir 1200 mg tid | 4.3 (3.5, 5.2) | 5.8 (2.8, 12.0) | 3.5 (2.0, 8.7) |
Source: Table 3 of Hyland 2008.
The paper also reports the chemical-inhibition screen that localised the reaction to CYP3A4 (Table 2). With 1 uM ketoconazole, 16.1 +/- 5.7% of control UK-408,027 formation and 17.3 +/- 3.4% of control maraviroc depletion remained (both P < 0.00001); furafylline, sulphaphenazole, benzylnirvanol and quinidine had no significant effect. No inhibition constant is reported for ketoconazole in this paper, so no inhibition term is carried in either model file and the screen is recorded as narrative rather than simulated.
Maraviroc was itself a weak CYP inhibitor, with IC50 above 30 uM against probe substrates for all seven CYPs tested; again no point estimate is reported, so no perpetrator model is extracted.
Assumptions and deviations
-
The impurity constant
Cis not published. The paper’s fitted equation isv = Vmax * [S] / (Km + [S]) + C * [S], whereCabsorbs a concentration-dependent UK-408,027 contaminant in the maraviroc substrate. The structure is preserved inHyland_2008_maraviroc_hlmasc_impurity, held at zero, because no value is reported. The authors state that correcting the data for the measured impurity and fitting a plain Michaelis-Menten equation gave a similarKmandVmax, so zero reproduces the published parameter estimates. A user who obtainsCcan set it without editing the model. -
No impurity term in the recombinant model. In the
Supersome experiments the contaminant was removed by comparison against
control Supersomes rather than fitted, so
Hyland_2008_maraviroc_rcyp3a4carries noc_impurity. -
The non-UK-408,027 clearance is modelled as first
order. The paper reports a single depletion intrinsic clearance
measured at 1 uM maraviroc, which is far below both
Kmvalues, and characterises the saturable route only for the UK-408,027 pathway. The remaining routes are therefore carried asclint - Vmax/Km, a first-order clearance, which is exactly what the depletion experiment measured. Their saturation behaviour at higher concentrations is not characterised by this paper and the model should not be used to extrapolate it. -
The residual error is a bioanalytical CV, not a fitted
residual. The paper reports no residual-error model;
KmandVmaxwere fitted with Grafit and reported without standard errors, and the figure error bars are not tabulated.propSdis fixed at 0.051, the reported LC-MS/MS coefficient of variation for UK-408,027 at the 50 ng calibration standard (the assay was 5.7%, 5.1% and 4.2% at 5, 50 and 150 ng). The maraviroc depletion assay CV was 14% at 1 uM; because the paper publishes no maraviroc concentration-time data,Cmaravirocis returned as a derived quantity without a residual-error model rather than as a second fitted endpoint. -
The observation variable is a reaction velocity, which
raises a convention warning.
checkModelConventions()warns that the single-output observationvUK408027is not the canonicalCcand is not a registered PD-output state. The warning is accepted rather than fixed: the fitted endpoint of Figures 2 and 4 is a formation velocity in pmol per pmol CYP per min, not a concentration, so naming itCcwould misstate its units and its meaning. These are the first in vitro enzyme-kinetic models in the library, so there is not yet a recurring endpoint to canonicalise; if more accumulate, a registered reaction-velocity output name would be the right fix. The metabolite and substrate concentrations are available alongside it as theuk408027state and the derivedCmaraviroc. -
No between-experiment variability. Neither model
carries
etaterms. The paper reports means of seven (human liver microsomes) and four (recombinant CYP3A4) determinations without variance components, so a random-effects structure would have to be invented. -
Fraction unbound in microsomes is applied as the paper
applies it. The measured
fumicvalues (0.72 and 0.86) were determined at protein concentrations of 1.5 and 0.63 mg/mL, which are the intrinsic-clearance assay conditions, not the 0.1 mg/mL and 10 pmol/mL kinetic incubations. At the kinetic protein concentrations the authors calculate maraviroc to be 98% free, so theKmvalues are treated as close to unbound values, as the paper does, andfumicis used only in the intrinsic-clearance scaling chain. -
Vmaxhas different denominators in the two files. In human liver microsomes it is per pmol of total CYP; in the recombinant system it is per pmol of CYP3A4. The two are not interchangeable, and the model files label them accordingly. -
The Simcyp layer is not extracted. See “Scope”
above. Table 1’s compound inputs are recorded in the model descriptions
and the source-trace table but are not encoded as a model, because the
whole-body physiology and the partition coefficients that would turn a
CLintinto a systemic clearance are not printed anywhere in the paper.