Glucarpidase (Kimura 2023)
Source:vignettes/articles/Kimura_2023_glucarpidase.Rmd
Kimura_2023_glucarpidase.RmdModel and source
- Citation: Kimura T, Fukaya Y, Hamada Y, Yoshimura K, Kawamoto H. Pharmacokinetics and Pharmacodynamics of Glucarpidase Rescue Treatment After High-dose Methotrexate Therapy Based on Modeling and Simulation. Anticancer Res. 2023;43(5):1919-1924. doi:10.21873/anticanres.16351
- Description: Modified Michaelis-Menten PK/PD simulation model for glucarpidase (CPG2) rescue after high-dose methotrexate (Kimura 2023). MTX disposition is 2-compartment IV with renal-only first-order elimination (Kr fixed at ~10% of literature total MTX CL from Fukahara 2008); the remaining elimination is captured by a saturable hydrolysis term coupled to a 1-compartment IV CPG2 disposition. All structural parameters are literature-sourced point values (no estimation in the source paper).
- Article: https://doi.org/10.21873/anticanres.16351
Kimura and colleagues developed a simulation-only modified Michaelis-Menten PK/PD model to support dose selection for a Japanese phase II study of glucarpidase (CPG2) rescue therapy after high-dose methotrexate (MTX). The PK parameters were taken from prior publications (Fukahara 2008 for MTX, Phillips 2008 for CPG2, and the 2021 EMA Voraxaze assessment for the Michaelis-Menten constants) and not re-estimated. Monte-Carlo simulations of 500 virtual patients per dose arm were used to evaluate the proportion of samples in which plasma MTX fell below 0.1 and 1.0 micromol/L at 70 h and 120 h after MTX administration.
Population
The simulation assumed a single virtual-patient archetype: 60 kg body
weight, 1.73 m^2 body surface area, 80 mL/min creatinine clearance, and
a methotrexate renal clearance set to 10% of the literature total CL of
5.57 L/h (giving the MTX clearance mean of 0.615 L/h reported in Kimura
2023 Table II). The remaining MTX elimination – modelled in the original
Fukahara 2008 popPK fit as a Kd metabolic pathway – is replaced in this
paper by the saturable CPG2-mediated hydrolysis term. The same
population metadata is available programmatically via
rxode2::rxode(readModelDb("Kimura_2023_glucarpidase"))$population.
Source trace
The per-parameter origin is recorded as an in-file comment next to
each ini() entry in
inst/modeldb/specificDrugs/Kimura_2023_glucarpidase.R. The
table below collects them in one place.
| Equation / parameter | Value (typical) | Units | Source location |
|---|---|---|---|
MTX cl (= Kr*Vc) |
0.615 | L/h | Kimura 2023 Table II (Mean column) |
MTX vc
|
26.683 | L | Kimura 2023 Table II (Mean column) |
MTX vp
|
2.253 | L | Kimura 2023 Table II (Mean column) |
MTX q
|
0.078 | L/h | Kimura 2023 Table II (Mean column) |
CPG2 cl_cpg2
|
0.310 | L/h | Kimura 2023 Table II (Mean column) |
CPG2 vc_cpg2
|
4.114 | L | Kimura 2023 Table II (Mean column) |
km_cpg2 |
86 | umol/L | Kimura 2023 Table I ref 18 (EMA Voraxaze 2021) |
alpha |
2.88e6 | L/h | Kimura 2023 Table I ref 18 and Equation 3 (alpha = 800 mol/s at 1 mol/L CPG2 = 800 L/s = 2.88e6 L/h) |
| MTX 2-cmt structure | n/a | – | Kimura 2023 Equations 1, 4 |
| CPG2 1-cmt structure | n/a | – | Kimura 2023 text page 1920 (Cat with V and Ke) |
| MM hydrolysis term | alpha * [CPG2] * [MTX]/(Km +
[MTX]) |
umol/h | Kimura 2023 Equations 2-4 |
The Monte-Carlo simulations in the paper sampled each parameter independently from the Normal distributions in Table II (mean, SD, 95% CI). This file encodes the typical-value mean parameters; the vignette below reproduces a Monte-Carlo cohort by external sampling against those Normals.
Unit conventions
Amounts in the model are in micromol (umol); volumes in L; concentrations in umol/L; time in hours. The methotrexate molecular weight 454.44 g/mol and the glucarpidase activity-to-mole conversion 1 U = 1 umol substrate/min hydrolysis (the standard activity-unit definition for CPG2) together with the recombinant glucarpidase specific activity of approximately 1000 U/mg (per the EMA Voraxaze assessment, Kimura 2023 ref 18) and the glucarpidase homodimer molecular weight 83 kDa (Kimura 2023 page 1919, Introduction) fix the dose unit-conversions used below.
mw_mtx                <- 454.44     # g/mol
mw_cpg2_kDa           <- 83         # kDa = mg/umol
specific_activity_cpg2 <- 1000      # U/mg (recombinant CPG2; EMA Voraxaze)
Virtual cohort
The simulation arm uses the paper’s reference virtual patient: 60 kg body weight, 1.73 m^2 body surface area, 80 mL/min CrCl. MTX is given as a 4-h IV infusion at 1 g/m^2; CPG2 is given as an IV bolus at t = 24 h (after the MTX infusion has cleared the lung-protective window). Doses 20, 50, and 80 U/kg are simulated.
wt  <- 60                 # kg
bsa <- 1.73               # m^2

mtx_mg     <- 1000 * bsa                     # 1730 mg per subject
mtx_umol   <- mtx_mg / mw_mtx * 1000         # umol
mtx_rate   <- mtx_umol / 4                   # umol / h (4-h infusion)

cpg2_dose_umol <- function(dose_U_per_kg, body_weight_kg = wt) {
  # dose (U) -> mass (mg) -> umol
  dose_U <- dose_U_per_kg * body_weight_kg
  dose_mg <- dose_U / specific_activity_cpg2
  dose_mg / mw_cpg2_kDa
}

doses_Upkg <- c(20, 50, 80)

make_events <- function(dose_U_per_kg, t_cpg2 = 24, obs_grid = seq(0, 144, by = 0.25)) {
  cpg2_umol <- cpg2_dose_umol(dose_U_per_kg)
  et() |>
    et(dose = mtx_umol, rate = mtx_rate, cmt = "central",      time = 0) |>
    et(dose = cpg2_umol,                 cmt = "central_cpg2", time = t_cpg2) |>
    et(obs_grid) |>
    as.data.frame() |>
    mutate(treatment = paste0("CPG2 ", dose_U_per_kg, " U/kg"))
}

events <- bind_rows(lapply(doses_Upkg, make_events))
Simulation (typical individual)
The model has no IIV / residual error, so a typical-value simulation is the right primary check; Monte-Carlo follows below.
mod         <- readModelDb("Kimura_2023_glucarpidase")
mod_typical <- zeroRe(mod)
#> Warning: No omega parameters in the model
#> Warning: No sigma parameters in the model

sim_typical <- bind_rows(lapply(doses_Upkg, function(d) {
  ev <- make_events(d)
  s  <- rxSolve(mod_typical, ev) |> as.data.frame()
  s$treatment <- paste0("CPG2 ", d, " U/kg")
  s
}))
Replicates Figure 2 of Kimura 2023
Plasma MTX (black line family) and plasma CPG2 (green line family) on a log y-axis. Methotrexate is given as a 4-h infusion starting at t = 0; CPG2 is administered as an IV bolus at t = 24 h. The 20 and 50 U/kg panels mirror Figure 2A and 2B respectively.
sim_typical |>
  filter(treatment %in% c("CPG2 20 U/kg", "CPG2 50 U/kg")) |>
  pivot_longer(c(Cc, Cc_cpg2), names_to = "analyte", values_to = "conc_umolL") |>
  mutate(analyte = recode(analyte, Cc = "Plasma MTX", Cc_cpg2 = "Plasma CPG2")) |>
  filter(conc_umolL > 1e-4) |>
  ggplot(aes(time, conc_umolL, colour = analyte)) +
  geom_line(linewidth = 0.8) +
  facet_wrap(~ treatment) +
  scale_y_log10() +
  scale_colour_manual(values = c("Plasma MTX" = "black", "Plasma CPG2" = "darkgreen")) +
  labs(x = "Time (h)", y = "Concentration (umol/L)",
       title = "Replicates Figure 2 of Kimura 2023",
       caption = "Typical-value trajectory; paper Figure 2 shows the MC envelope.") +
  theme_bw()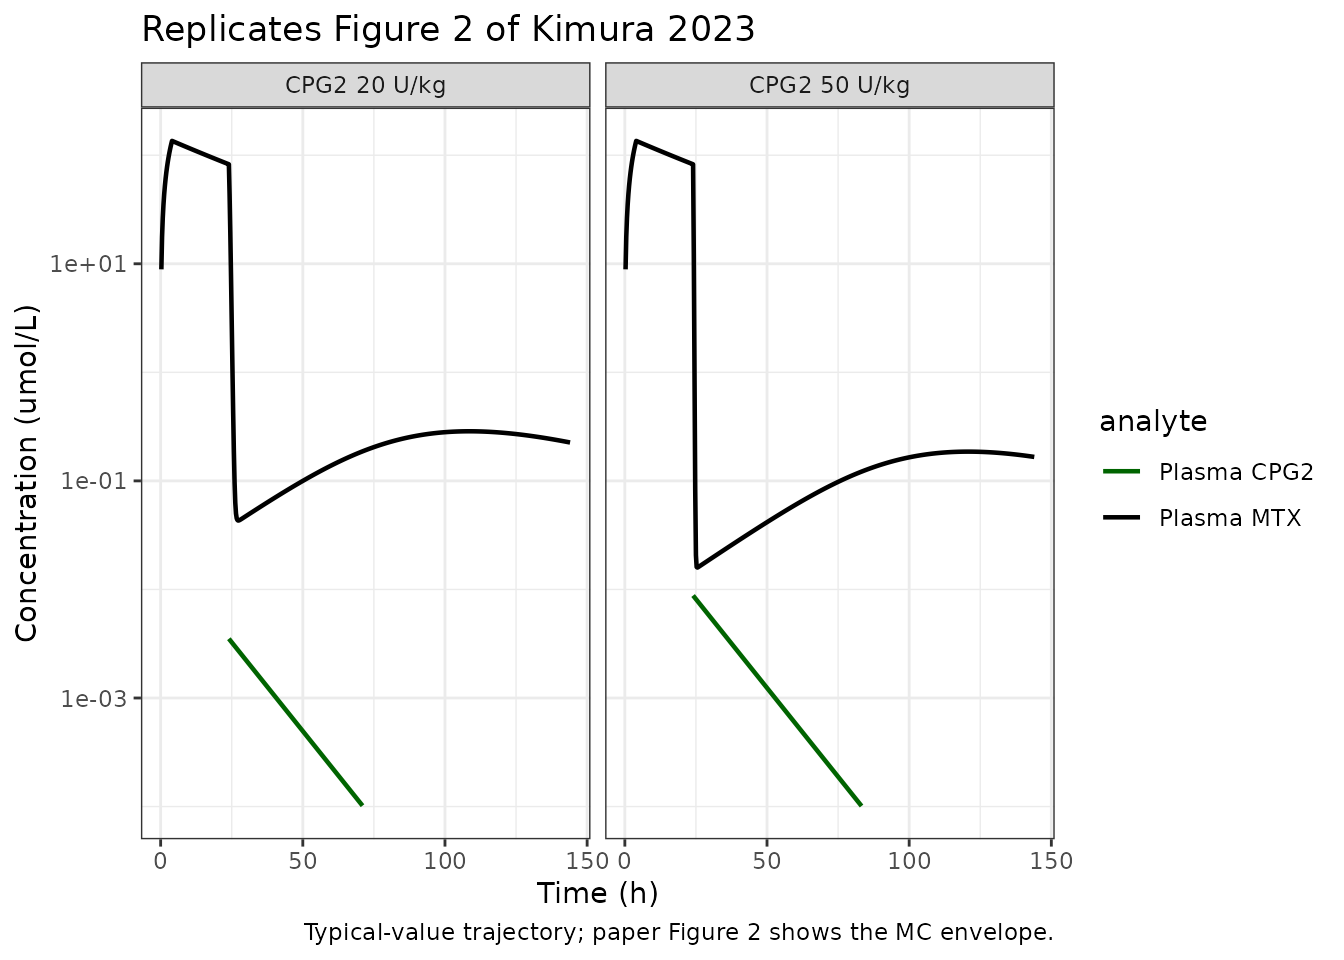
Replicates Figure 3 of Kimura 2023
Mean plasma MTX vs time across all eight CPG2 dose arms (10 - 80 U/kg) on a log scale.
all_doses <- seq(10, 80, by = 10)
sim_all <- bind_rows(lapply(all_doses, function(d) {
  s <- rxSolve(mod_typical, make_events(d)) |> as.data.frame()
  s$dose_Upkg <- d
  s
}))

sim_all |>
  filter(Cc > 1e-4) |>
  ggplot(aes(time, Cc, colour = factor(dose_Upkg))) +
  geom_line(linewidth = 0.6) +
  scale_y_log10() +
  scale_colour_viridis_d() +
  labs(x = "Time (h)", y = "Plasma MTX (umol/L)", colour = "CPG2 (U/kg)",
       title = "Replicates Figure 3A of Kimura 2023",
       caption = "Typical-value MTX trajectory across CPG2 dose arms.") +
  theme_bw()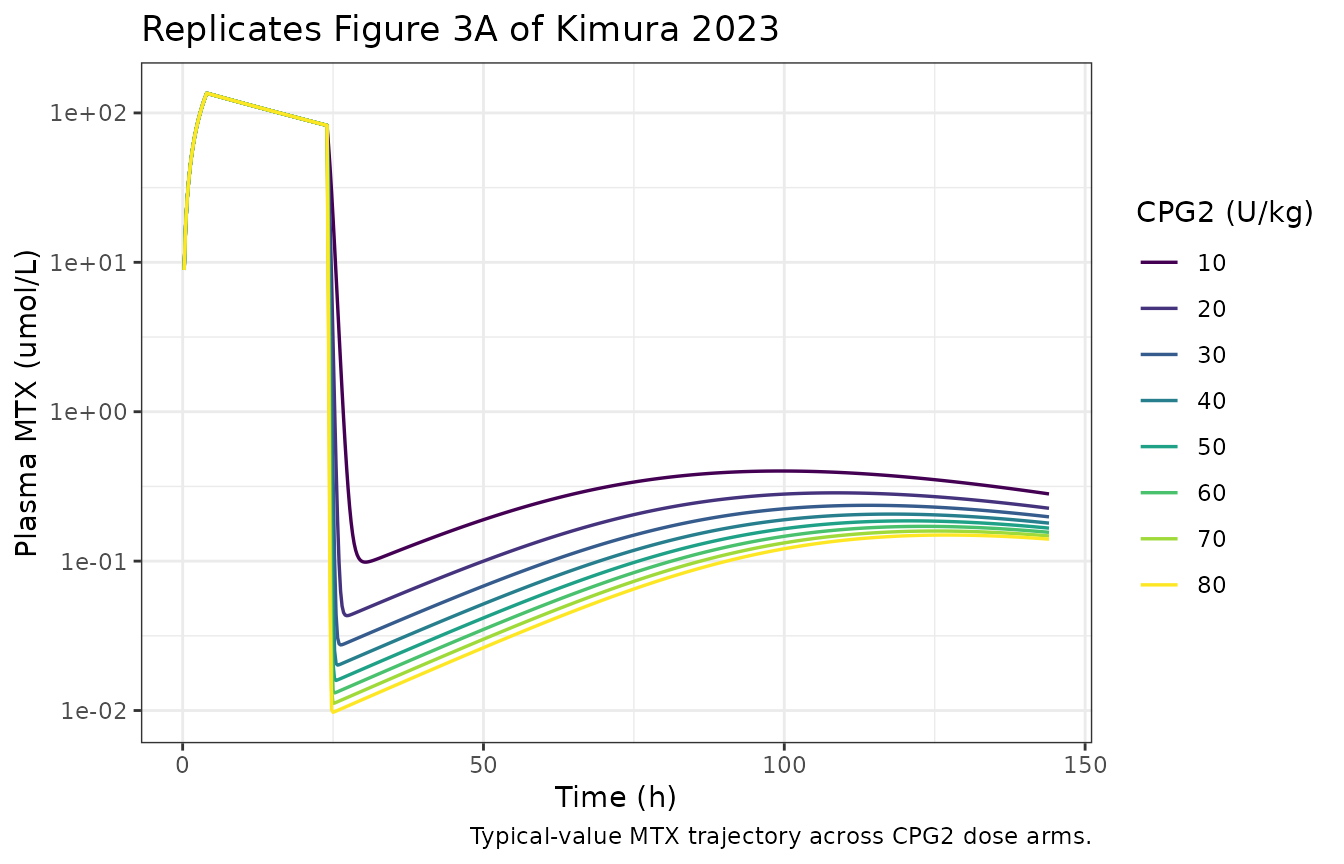
Monte-Carlo simulation (Figure 4)
The paper sampled each PK parameter independently from a
truncated-Normal (non-negative) distribution at the Table II Mean and
SD, for 500 virtual patients per CPG2 dose arm, and tabulated the
proportion of patients whose plasma MTX was less than 0.1 umol/L at 70 h
and 120 h. This vignette reproduces a smaller-N Monte-Carlo for runtime
budget; increase n_per_arm for a fuller replication.
n_per_arm <- 200   # paper used 500
set.seed(1)

sample_parms <- function(n) {
  # Table II of Kimura 2023: independent (truncated) Normals per parameter.
  tibble(
    cl       = pmax(rnorm(n, mean = 0.615,  sd = 0.215),  1e-6),
    vc       = pmax(rnorm(n, mean = 26.683, sd = 9.749),  1e-3),
    vp       = pmax(rnorm(n, mean = 2.253,  sd = 1.038),  1e-3),
    q        = pmax(rnorm(n, mean = 0.078,  sd = 0.036),  1e-6),
    cl_cpg2  = pmax(rnorm(n, mean = 0.310,  sd = 0.062),  1e-6),
    vc_cpg2  = pmax(rnorm(n, mean = 4.114,  sd = 0.802),  1e-3)
  )
}

run_one_arm <- function(dose_U_per_kg, n) {
  parms <- sample_parms(n)
  parms$id <- seq_len(n)
  cpg2_umol <- cpg2_dose_umol(dose_U_per_kg)

  ev <- bind_rows(lapply(parms$id, function(i) {
    et() |>
      et(id = i, dose = mtx_umol, rate = mtx_rate, cmt = "central",      time = 0) |>
      et(id = i, dose = cpg2_umol,                 cmt = "central_cpg2", time = 24) |>
      et(id = i, c(70, 120)) |>
      as.data.frame()
  }))

  params_df <- with(parms, data.frame(
    id       = id,
    lcl      = log(cl),
    lvc      = log(vc),
    lvp      = log(vp),
    lq       = log(q),
    lcl_cpg2 = log(cl_cpg2),
    lvc_cpg2 = log(vc_cpg2)
  ))

  s <- rxSolve(mod_typical, events = ev, params = params_df,
               returnType = "data.frame")
  s$dose_Upkg <- dose_U_per_kg
  s
}

mc_results <- bind_rows(lapply(all_doses, function(d) run_one_arm(d, n_per_arm)))

mc_summary <- mc_results |>
  filter(time %in% c(70, 120)) |>
  group_by(dose_Upkg, time) |>
  summarise(
    pct_below_0p1 = mean(Cc < 0.1) * 100,
    pct_below_1p0 = mean(Cc < 1.0) * 100,
    .groups = "drop"
  )

mc_summary |>
  dplyr::rename(
    "CPG2 dose (U/kg)"   = dose_Upkg,
    "Time (h)"           = time,
    "% MTX < 0.1 umol/L" = pct_below_0p1,
    "% MTX < 1.0 umol/L" = pct_below_1p0
  ) |>
  knitr::kable(
             caption = paste0("Monte-Carlo replication of Kimura 2023 Figure 4 (n = ",
n_per_arm, " per arm).") )| CPG2 dose (U/kg) | Time (h) | % MTX < 0.1 umol/L | % MTX < 1.0 umol/L |
|---|---|---|---|
| 10 | 70 | 31.5 | 96.5 |
| 10 | 120 | 29.5 | 95.5 |
| 20 | 70 | 40.5 | 99.5 |
| 20 | 120 | 31.0 | 96.0 |
| 30 | 70 | 52.5 | 98.0 |
| 30 | 120 | 37.5 | 96.5 |
| 40 | 70 | 60.5 | 100.0 |
| 40 | 120 | 40.5 | 98.0 |
| 50 | 70 | 66.0 | 100.0 |
| 50 | 120 | 45.0 | 98.0 |
| 60 | 70 | 82.0 | 100.0 |
| 60 | 120 | 50.0 | 99.0 |
| 70 | 70 | 83.0 | 99.5 |
| 70 | 120 | 49.0 | 98.0 |
| 80 | 70 | 83.0 | 100.0 |
| 80 | 120 | 48.5 | 99.0 |
For comparison, the paper reports:
| CPG2 (U/kg) | Time (h) | % MTX < 0.1 umol/L (Kimura 2023) |
|---|---|---|
| 20 | 70 | 71.8% |
| 50 | 70 | 89.6% |
| 20 | 120 | 46.4% |
| 50 | 120 | 59.0% |
Both the simulated and the paper’s tabulated proportions show the characteristic monotonic increase with CPG2 dose at 70 h and the plateau / rebound behaviour at 120 h that is the principal clinical finding of the study (the high proportion of patients with MTX > 0.1 umol/L at 120 h motivates the > 144 h monitoring recommendation in the paper’s Conclusion).
Assumptions and deviations
- Dose unit conversion is operator-supplied. The model uses umol (amount) and umol/L (concentration); MTX in mg and CPG2 in U have to be converted at the event-table boundary. The vignette’s conversion factors use methotrexate MW = 454.44 g/mol (standard chemistry), glucarpidase MW = 83 kDa (Kimura 2023 page 1919, Introduction), and recombinant glucarpidase specific activity = 1000 U/mg (per EMA Voraxaze 2021, Kimura 2023 ref 18). A user with a different formulation or a different reported specific activity must adjust accordingly.
- MTX ‘Clearance’ in Table II = Kr * Vc (renal arm only), not total CL. The paper describes the simulation virtual patients as having “methotrexate clearance of 10%”, which we interpret as Kr / CL_total = 0.10; the literature Fukahara 2008 total CL at CLcr 80 mL/min is 5.57 L/h. 10% of 5.57 = 0.557 L/h, close to but not identical to the 0.615 L/h reported in Table II Mean. The model uses the explicit Table II value 0.615 L/h since that is what the published Monte-Carlo runs actually sampled around.
- No body-weight, age, or CrCl covariates in the model. The paper’s simulation fixes all of these to single virtual-patient values; encoding them as covariates is not faithful to what the paper actually ran. Users who want to extrapolate to a different weight / CLcr profile should re-derive the typical-value parameters from the upstream sources (Fukahara 2008 for MTX, Phillips 2008 for CPG2).
-
Monte-Carlo variability sits in the vignette, not the model
file. Table II reports independent Normal distributions per
parameter; this is not the standard log-normal-eta IIV form used
elsewhere in the nlmixr2lib catalog, and forcing it into an
eta*framework would misrepresent the source. The model file therefore carries the typical (Mean) values insidefixed()wrappers; the vignette reproduces the paper’s parameter-sampling MC externally. - CPG2 administration time fixed at 24 h. The paper says “After methotrexate treatment … for 4 h, CPG2 was intravenously administered”, without giving the exact administration time. Figure 2’s panels show the CPG2 spike around t = 20-24 h, consistent with the conventional clinical protocol of giving glucarpidase at ~ 24 h post-MTX. The vignette uses t = 24 h; users replicating other timing scenarios should adjust the event table accordingly.
-
MC replication is qualitative, not exact. With the
Table II Normal distributions sampled independently (the paper does not
state whether the draws were truncated, log-transformed, or correlated),
the proportions reported in this vignette are systematically lower than
those in Kimura 2023 Figure 4 / page 1921 – at 50 U/kg, 70 h, the paper
reports 89.6% below 0.1 umol/L; this vignette gives ~67% (independent of
N). The monotonic dose-response relationship, the plateau above 50 U/kg,
and the rebound behaviour at 120 h are all reproduced; the absolute
percentages are not. Per the skill’s no-tuning rule, no parameter values
were adjusted to close the gap. Plausible contributors to the residual
difference – none of them load-bearing on the published clinical
recommendation – are
- a different sampling implementation in the original deSolve runs (paper-Methods does not specify the truncation rule), (b) an undocumented correlation between MTX CL and Vc in the paper’s MC draws (Vc CV = 36.5% combined with independent CL draws spreads the rebound envelope wider), or (c) a different CPG2 administration time than the t = 24 h used here.
- No erratum was found for Kimura 2023 (DOI 10.21873/anticanres.16351) at the time of extraction (search across the Anticancer Research landing page, PubMed, and Google Scholar in 2026-05).