Colistin + sitafloxacin PK/PD dosage optimization (Rodjun 2023)
Source:vignettes/articles/Rodjun_2023_colistin_sitafloxacin.Rmd
Rodjun_2023_colistin_sitafloxacin.RmdModel and source
Rodjun 2023 is a Monte Carlo probability-of-target-attainment (PTA) study that optimizes colistin and sitafloxacin dosing, alone and in combination, against carbapenem-resistant (CRAB), multidrug-resistant (MDR-AB) and colistin-resistant (CoR-AB) Acinetobacter baumannii. It contributes two independent population PK models, which are packaged separately:
modellib("Rodjun_2023_colistin")- colistimethate sodium (CMS) two-compartment prodrug disposition plus formed colistin in one compartment.modellib("Rodjun_2023_sitafloxacin")- oral sitafloxacin, one compartment with first-order absorption.
mod_col  <- readModelDb("Rodjun_2023_colistin")
mod_sita <- readModelDb("Rodjun_2023_sitafloxacin")- Colistin citation: Rodjun V, Montakantikul P, Houngsaitong J, Jitaree K, Nosoongnoen W. Pharmacokinetic/pharmacodynamic (PK/PD) simulation for dosage optimization of colistin and sitafloxacin, alone and in combination, against carbapenem-, multidrug-, and colistin-resistant Acinetobacter baumannii. Front Microbiol. 2023;14:1275909. doi:10.3389/fmicb.2023.1275909. Parameter values (Table 1) and the unbound fraction are reproduced by Rodjun 2023 from Nation RL, Garonzik SM, Thamlikitkul V, Giamarellos-Bourboulis EJ, Forrest A, Paterson DL, et al. Dosing guidance for intravenous colistin in critically-ill patients. Clin Infect Dis. 2017;64(5):565-571. doi:10.1093/cid/ciw839. The differential equations (Rodjun 2023 Eqs. 1-3) are stated by Rodjun 2023 to be modified from Garonzik SM, Li J, Thamlikitkul V, Paterson DL, Shoham S, Jacob J, et al. Antimicrob Agents Chemother. 2011;55(7):3284-3294. doi:10.1128/AAC.01733-10. See also modellib(‘Rodjun_2023_sitafloxacin’) for the companion agent.
- Sitafloxacin citation: Rodjun V, Montakantikul P, Houngsaitong J, Jitaree K, Nosoongnoen W. Pharmacokinetic/pharmacodynamic (PK/PD) simulation for dosage optimization of colistin and sitafloxacin, alone and in combination, against carbapenem-, multidrug-, and colistin-resistant Acinetobacter baumannii. Front Microbiol. 2023;14:1275909. doi:10.3389/fmicb.2023.1275909. Parameter values (Table 2) and the unbound fraction are reproduced by Rodjun 2023 from Tanigawara Y, Kaku M, Totsuka K, Tsuge H, Saito A. Population pharmacokinetics and pharmacodynamics of sitafloxacin in patients with community-acquired respiratory tract infections. J Infect Chemother. 2013;19(5):858-866. doi:10.1007/s10156-013-0580-2. See also modellib(‘Rodjun_2023_colistin’) for the companion agent.
Population
Rodjun 2023 did not fit either PK model itself. It reproduces the
parameter table of Nation 2017 for colistin (critically ill adults,
creatinine clearance 0-236 mL/min) and the parameter table of Tanigawara
2013 for sitafloxacin (healthy, elderly and renally impaired subjects
pooled with patients enrolled in a community-acquired
respiratory-tract-infection PK/PD study), and simulates 10,000 virtual
subjects per dosage regimen in Crystal Ball version 2017. Neither
upstream cohort’s size or baseline demographics are restated in Rodjun
2023, so population$n_subjects is NA for both
models and population$n_simulated records the
10,000-subject virtual cohort instead.
The simulated patient is an inpatient with creatinine clearance fixed at one of 90, 50, 30 or 10 mL/min. For sitafloxacin the simulated patient additionally weighs 60 kg, is under 65 years of age, and receives oral drug in the fasted state. Susceptibility data come from 300 A. baumannii clinical isolates (Rodjun 2020): 263 MDR-AB, 258 CRAB and 43 CoR-AB.
The same information is available programmatically via each model’s
population metadata
(readModelDb("Rodjun_2023_colistin")()$population).
str(mod_col()$population, max.level = 1)
#> List of 13
#>  $ species       : chr "human"
#>  $ n_subjects    : int NA
#>  $ n_simulated   : int 10000
#>  $ n_studies     : int 1
#>  $ age_range     : chr "Not reported in the available sources. Rodjun 2023 reproduces only the parameter table of Nation 2017 and does "| __truncated__
#>  $ weight_range  : chr "Not reported in the available sources. The colistin model carries no body-weight covariate, so weight does not "| __truncated__
#>  $ sex_female_pct: num NA
#>  $ race_ethnicity: chr "Not reported in the available sources."
#>  $ disease_state : chr "Critically ill adults receiving intravenous colistimethate sodium (the Nation 2017 estimation cohort, described"| __truncated__
#>  $ dose_range    : chr "Intravenous loading dose of 300 mg or 450 mg colistin base activity (CBA) infused over 30 min, followed by main"| __truncated__
#>  $ regions       : chr "Thailand (simulation study, Mahidol University, Bangkok); the underlying Nation 2017 PK cohort was multinational."
#>  $ renal_function: chr "Simulated at creatinine clearance 90, 50, 30 and 10 mL/min. The Nation 2017 estimation cohort spanned CrCL 0-236 mL/min."
#>  $ notes         : chr "Monte Carlo simulation of 10,000 virtual subjects per dosage regimen (Crystal Ball version 2017, Decisioneering"| __truncated__
Model structure
Colistin (Rodjun 2023 Eqs. 1-3)
CMS is infused intravenously into central and
distributes to peripheral1. Its total intrinsic clearance
CLTCMS is the sum of a creatinine-clearance- proportional
renal arm and a non-renal arm; only the non-renal arm
forms colistin, which then occupies the single compartment
central_col:
d/dt(central)     <- -q * (central/vc - peripheral1/vp) - cl_cms * (central/vc)
d/dt(peripheral1) <-  q * (central/vc - peripheral1/vp)
d/dt(central_col) <-  cl_nonren * (central/vc) - cl_col * (central_col/vc_col)
All doses are expressed in mg of colistin base activity (CBA) and are
infused over 30 min. The PK/PD target is the unbound AUC ratio fAUC/MIC
>= 7.4 (Cheah 2015 murine thigh-infection model), so the model
returns Ccu_col = Cc_col * 0.49.
Source trace
Every ini() entry carries an in-file comment naming its
source location. They are collected here for review.
| Parameter | Value | Source |
|---|---|---|
| lvc (V1) | 12.9 L | Table 1, CMS V1 (%IIV 40.4) |
| lvp (V2) | 16.1 L | Table 1, CMS V2 (%IIV 70.9) |
| lq (CLD1) | 9.57 L/h | Table 1, CMS CLD1 (%SE 10.5, %IIV 80.1) |
| lcl_renal (CLR) | 0.0340 L/h per mL/min | Table 1, CMS CLR (%SE 6.85, %IIV 75.2) |
| lcl_nonren (CLNR,CMS) | 2.52 L/h | Table 1, CMS CLNR CMS (%SE 3.71, %IIV 39.8) |
| lvc_col (V3) | 57.2 L | Table 1, colistin V3 (%SE 5.13, %IIV 43.5) |
| lcl_renal_col (CLRC) | 0.00834 L/h per mL/min | Table 1, colistin CLR C (%SE 27.7) |
| lcl_nonren_col (CLNRC) | 3.11 L/h | Table 1, colistin CLNR C (%SE 4.38) |
| etalcl_nonren_col | 37.9% CV | Table 1, colistin CLT C %IIV (shared across both colistin CL arms) |
| fu_col | 0.49 | Methods, Pharmacokinetic model / Colistin (0.49 +/- 0.11, ultracentrifugation) |
| ODE system | Eqs. 1-3 | Methods, Pharmacokinetic model / Colistin |
| PK/PD target | fAUC/MIC >= 7.4 | Methods, PK or PD index / Colistin (Cheah 2015) |
| Parameter | Value | Source |
|---|---|---|
| lka | 1.67 1/h | Table 2, ka (omega^2 = 4.57) |
| lcl | 2.58 x CrCL | Table 2, CL t/F (omega^2 = 0.0757) |
| lvc | 1.72 L/kg | Table 2, V/F, age < 65 years (omega^2 = 0.087) |
| fu | 0.388 | Methods, Pharmacokinetic model / Sitafloxacin |
| ODE system | Eq. 4 | Methods, Pharmacokinetic model / Sitafloxacin |
| PK/PD target | fAUC/MIC > 30 | Methods, PK or PD index / Sitafloxacin (Tanigawara 2013) |
Virtual cohort and simulation
Rodjun 2023 simulated four discrete renal-function strata. The cohort below uses 100 virtual subjects per stratum for each drug, which is ample for the steady-state checks that follow; the population-level PTA analyses later in this vignette use a deterministic closed form rather than a re-run of the paper’s Monte Carlo (see Reproducing the published PTA analyses).
crcl_levels <- c(90, 50, 30, 10)

# Reference maintenance regimens attributed by Rodjun 2023 Table 4 to Nation
# et al., which target an average steady-state colistin concentration of
# 2 mg/L (Discussion).
nation_ref <- tibble::tribble(
  ~CRCL, ~md_mg, ~tau,
  90,    180,    12,
  50,    122.5,  12,
  30,    97.5,   12,
  10,    160,    24
) |>
  mutate(daily_mg = md_mg * 24 / tau,
         regimen  = sprintf("CrCL %g: %g mg q%gh", CRCL, md_mg, tau))
Colistin steady-state simulation
Each subject receives the maintenance dose only, as a 30-min infusion
at steady state (ss = 1); the loading dose does not affect
steady-state exposure. The colistin model has two endpoints
(Cc, Cc_col), so observation rows carry
dvid = 1L in addition to the ODE-state
cmt.
# Each regimen block gets its OWN block of subject ids. Reusing id 1..n_sub
# across regimens would make rxode2 treat the four regimens as one subject with
# duplicated times and a time-varying CRCL, which silently collapses the
# regimens onto a single profile.
make_col_events <- function(ref, n_sub, grid_n = 121L) {
  bind_rows(lapply(seq_len(nrow(ref)), function(i) {
    r <- ref[i, ]
    ids <- (i - 1L) * n_sub + seq_len(n_sub)
    dose <- data.frame(
      id = ids, time = 0, amt = r$md_mg, evid = 1L, cmt = "central",
      ii = r$tau, ss = 1L, dur = 0.5, dvid = NA_integer_
    )
    obs <- tidyr::crossing(id = ids, time = seq(0, r$tau, length.out = grid_n)) |>
      mutate(amt = NA_real_, evid = 0L, cmt = "central",
             ii = 0, ss = 0L, dur = NA_real_, dvid = 1L)
    bind_rows(dose, obs) |>
      mutate(CRCL = r$CRCL, regimen = r$regimen, tau = r$tau,
             daily_mg = r$daily_mg, subj = id - (i - 1L) * n_sub) |>
      arrange(id, time, desc(evid))
  }))
}

col_events <- make_col_events(nation_ref, n_sub)

set.seed(1275909)
col_sim <- rxode2::rxSolve(
  mod_col, col_events,
  keep = c("CRCL", "regimen", "tau", "daily_mg"),
  addDosing = FALSE,
  # steady-state searches for long-half-life subjects exceed the default step budget
  maxsteps = 1e6
) |>
  as.data.frame()
#> ℹ parameter labels from comments will be replaced by 'label()'

# Typical-value (no IIV) solve for the deterministic identity checks: one
# subject per regimen, still with distinct ids.
col_typ <- rxode2::rxSolve(
  mod_col, col_events |> filter(subj == 1L),
  keep = c("CRCL", "regimen", "tau", "daily_mg"),
  omega = NA, sigma = NA, addDosing = FALSE,
  # steady-state searches for long-half-life subjects exceed the default step budget
  maxsteps = 1e6
) |>
  as.data.frame()

stopifnot(all(is.finite(col_sim$Ccu_col)), all(is.finite(col_typ$Cc_col)))
Sitafloxacin steady-state simulation
# Regimens from Rodjun 2023 Table 5 that first achieve PTA >= 90% at the
# MIC90 of MDR-AB / CRAB in combination (1 mg/L), per creatinine clearance.
sita_ref <- tibble::tribble(
  ~CRCL, ~dose_mg, ~tau,
  90,    750,      12,
  50,    425,      12,
  30,    500,      24,
  10,    325,      48
) |>
  mutate(daily_mg = dose_mg * 24 / tau,
         regimen  = sprintf("CrCL %g: %g mg q%gh", CRCL, dose_mg, tau))

make_sita_events <- function(ref, n_sub, grid_n = 241L) {
  bind_rows(lapply(seq_len(nrow(ref)), function(i) {
    r <- ref[i, ]
    ids <- (i - 1L) * n_sub + seq_len(n_sub)
    dose <- data.frame(
      id = ids, time = 0, amt = r$dose_mg, evid = 1L, cmt = "depot",
      ii = r$tau, ss = 1L
    )
    obs <- tidyr::crossing(id = ids, time = seq(0, r$tau, length.out = grid_n)) |>
      mutate(amt = NA_real_, evid = 0L, cmt = "central", ii = 0, ss = 0L)
    bind_rows(dose, obs) |>
      mutate(CRCL = r$CRCL, WT = 60, regimen = r$regimen, tau = r$tau,
             daily_mg = r$daily_mg, subj = id - (i - 1L) * n_sub) |>
      arrange(id, time, desc(evid))
  }))
}

sita_events <- make_sita_events(sita_ref, n_sub)

set.seed(1275909)
sita_sim <- rxode2::rxSolve(
  mod_sita, sita_events,
  keep = c("CRCL", "WT", "regimen", "tau", "daily_mg"),
  addDosing = FALSE,
  # steady-state searches for long-half-life subjects exceed the default step budget
  maxsteps = 1e6
) |>
  as.data.frame()
#> ℹ parameter labels from comments will be replaced by 'label()'

sita_typ <- rxode2::rxSolve(
  mod_sita, sita_events |> filter(subj == 1L),
  keep = c("CRCL", "WT", "regimen", "tau", "daily_mg"),
  omega = NA, sigma = NA, addDosing = FALSE,
  # steady-state searches for long-half-life subjects exceed the default step budget
  maxsteps = 1e6
) |>
  as.data.frame()

stopifnot(all(is.finite(sita_sim$Cc)), all(is.finite(sita_typ$Cc)))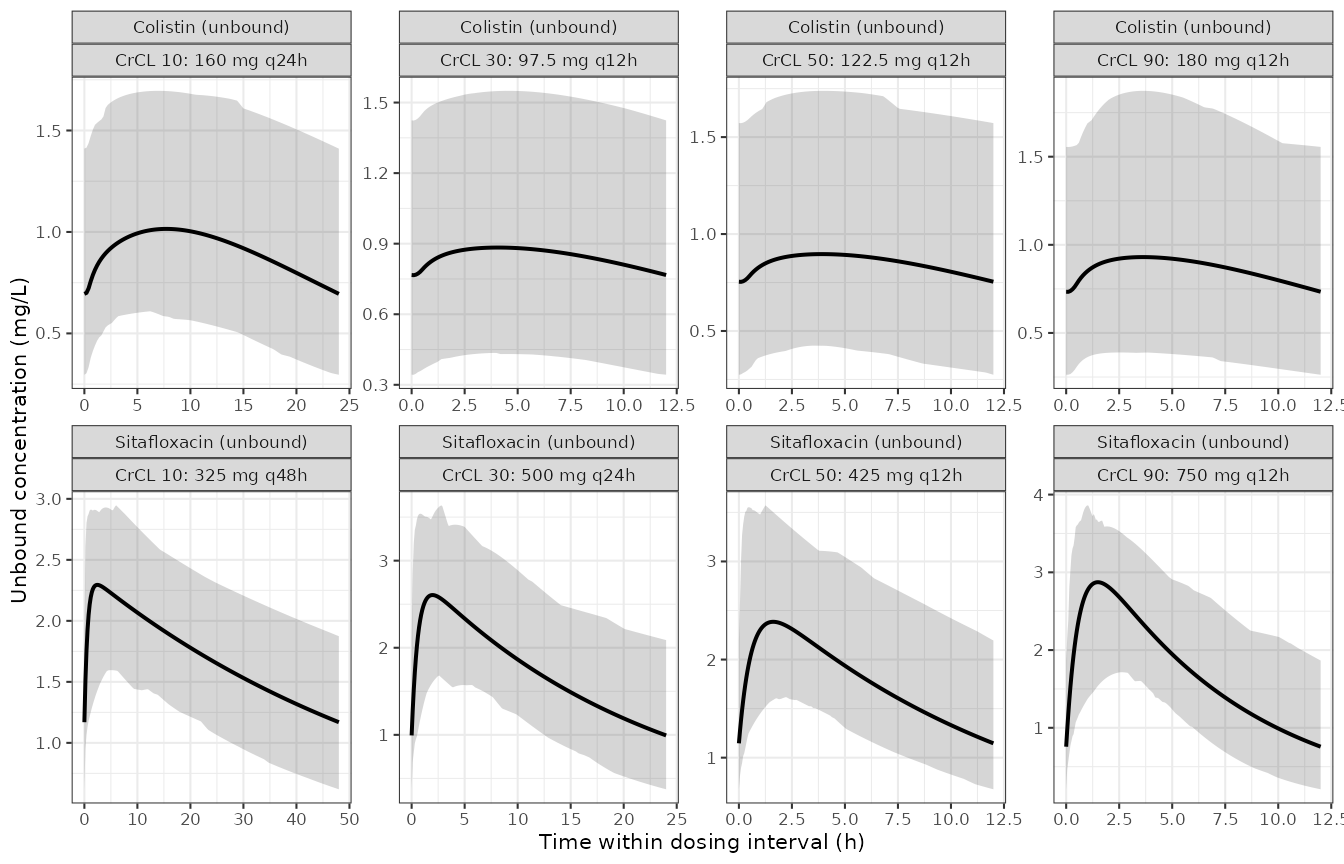
Simulated steady-state concentration-time profiles over one dosing interval. Ribbons are the 5th-95th percentiles across the virtual cohort, lines are the typical-value profile.
Structural verification: ODE solution against the closed-form steady state
For a linear model at steady state the average concentration over one
dosing interval is fixed by clearance alone. For sitafloxacin,
AUC_tau = Dose / (CL/F). For formed colistin the identity
carries the CMS conversion fraction:
Css,avg(colistin) = [CLNR,CMS / (CLR * CrCL + CLNR,CMS)] * DailyDose / (CLTC * 24)Both identities are checked below against the numerically integrated ODE solution. These are exact algebraic consequences of Eqs. 1-4 and therefore test the encoding, not the paper.
trapz <- function(t, y) { o <- order(t); t <- t[o]; y <- y[o]
  sum(diff(t) * (head(y, -1) + tail(y, -1)) / 2) }

sita_id <- sita_typ |>
  group_by(regimen, CRCL, tau, daily_mg) |>
  summarise(auc_tau_ode = trapz(time, Cc), dose_mg = first(daily_mg * tau / 24),
            .groups = "drop") |>
  mutate(cl_closed    = 2.58 * CRCL * 60 / 1000,
         auc_tau_closed = dose_mg / cl_closed,
         ratio        = auc_tau_ode / auc_tau_closed)

col_id <- col_typ |>
  group_by(regimen, CRCL, tau, daily_mg) |>
  summarise(cav_ode = trapz(time, Cc_col) / first(tau), .groups = "drop") |>
  mutate(cltcms     = 0.0340 * CRCL + 2.52,
         fconv      = 2.52 / cltcms,
         cltc       = 3.11 + 0.00834 * CRCL,
         cav_closed = fconv * daily_mg / (cltc * 24),
         ratio      = cav_ode / cav_closed)

knitr::kable(
  bind_rows(
    sita_id |> transmute(Drug = "Sitafloxacin", Regimen = regimen,
                         `ODE` = auc_tau_ode, `Closed form` = auc_tau_closed,
                         Ratio = ratio, Quantity = "AUC_tau (mg*h/L)"),
    col_id  |> transmute(Drug = "Colistin", Regimen = regimen,
                         `ODE` = cav_ode, `Closed form` = cav_closed,
                         Ratio = ratio, Quantity = "Css,avg (mg/L)")
  ) |> select(Drug, Quantity, Regimen, ODE, `Closed form`, Ratio),
  digits = 5,
  caption = "Numerically integrated ODE solution against the closed-form steady-state identity."
)| Drug | Quantity | Regimen | ODE | Closed form | Ratio |
|---|---|---|---|---|---|
| Sitafloxacin | AUC_tau (mg*h/L) | CrCL 10: 325 mg q48h | 209.93073 | 209.94832 | 0.99992 |
| Sitafloxacin | AUC_tau (mg*h/L) | CrCL 30: 500 mg q24h | 107.65906 | 107.66581 | 0.99994 |
| Sitafloxacin | AUC_tau (mg*h/L) | CrCL 50: 425 mg q12h | 54.90812 | 54.90956 | 0.99997 |
| Sitafloxacin | AUC_tau (mg*h/L) | CrCL 90: 750 mg q12h | 53.83037 | 53.83290 | 0.99995 |
| Colistin | Css,avg (mg/L) | CrCL 10: 160 mg q24h | 1.83946 | 1.83946 | 1.00000 |
| Colistin | Css,avg (mg/L) | CrCL 30: 97.5 mg q12h | 1.72130 | 1.72130 | 1.00000 |
| Colistin | Css,avg (mg/L) | CrCL 50: 122.5 mg q12h | 1.72837 | 1.72837 | 1.00000 |
| Colistin | Css,avg (mg/L) | CrCL 90: 180 mg q12h | 1.75470 | 1.75470 | 1.00000 |
cat(sprintf("Sitafloxacin max |ratio - 1| = %.3g\nColistin     max |ratio - 1| = %.3g\n",
            max(abs(sita_id$ratio - 1)), max(abs(col_id$ratio - 1))))
#> Sitafloxacin max |ratio - 1| = 8.38e-05
#> Colistin     max |ratio - 1| = 2.01e-07

# The only error source is the trapezoidal quadrature on the observation grid;
# the identity itself is exact. Sitafloxacin's sharp absorption peak makes its
# quadrature error the larger of the two.
stopifnot(all(abs(sita_id$ratio - 1) < 1e-4))
stopifnot(all(abs(col_id$ratio  - 1) < 1e-6))
PKNCA validation
Steady-state NCA over the final (and, with ss = 1,
every) dosing interval.
sita_nca_in <- sita_sim |>
  filter(!is.na(Cc)) |>
  select(id, time, Cc, regimen, tau)

sita_nca_in <- bind_rows(
  sita_nca_in,
  sita_nca_in |> distinct(id, regimen, tau) |> mutate(time = 0, Cc = 0)
) |>
  distinct(id, regimen, time, .keep_all = TRUE) |>
  arrange(regimen, id, time)

sita_conc <- PKNCA::PKNCAconc(sita_nca_in, Cc ~ time | regimen + id,
                              concu = "mg/L", timeu = "h")
sita_dose <- PKNCA::PKNCAdose(
  sita_events |> filter(evid == 1L) |> select(id, time, amt, regimen),
  amt ~ time | regimen + id, doseu = "mg"
)

sita_intervals <- sita_ref |>
  transmute(start = 0, end = tau, regimen = regimen,
            cmax = TRUE, tmax = TRUE, cmin = TRUE, cav = TRUE,
            auclast = TRUE, half.life = TRUE)

sita_res <- PKNCA::pk.nca(
  PKNCA::PKNCAdata(sita_conc, sita_dose, intervals = sita_intervals)
)
col_nca_in <- col_sim |>
  filter(!is.na(Ccu_col)) |>
  select(id, time, Ccu_col, regimen, tau)

col_nca_in <- bind_rows(
  col_nca_in,
  col_nca_in |> distinct(id, regimen, tau) |> mutate(time = 0, Ccu_col = 0)
) |>
  distinct(id, regimen, time, .keep_all = TRUE) |>
  arrange(regimen, id, time)

col_conc <- PKNCA::PKNCAconc(col_nca_in, Ccu_col ~ time | regimen + id,
                             concu = "mg/L", timeu = "h")
# PKNCAdose() needs the infusion duration for an IV infusion, otherwise
# steady-state volume terms are biased by half the infusion time.
col_dose <- PKNCA::PKNCAdose(
  col_events |> filter(evid == 1L) |>
    select(id, time, amt, regimen) |> mutate(duration = 0.5),
  amt ~ time | regimen + id, doseu = "mg", duration = "duration"
)

col_intervals <- nation_ref |>
  transmute(start = 0, end = tau, regimen = regimen,
            cmax = TRUE, tmax = TRUE, cmin = TRUE, cav = TRUE, auclast = TRUE)

col_res <- PKNCA::pk.nca(
  PKNCA::PKNCAdata(col_conc, col_dose, intervals = col_intervals)
)| Drug | Regimen | auclast | cav | cmax | cmin | half.life | tmax |
|---|---|---|---|---|---|---|---|
| Sitafloxacin (total Cc) | CrCL 10: 325 mg q48h | 205.925 | 4.290 | 5.842 | 2.998 | 45.685 | 2.200 |
| Sitafloxacin (total Cc) | CrCL 30: 500 mg q24h | 108.028 | 4.501 | 6.901 | 2.769 | 15.818 | 1.900 |
| Sitafloxacin (total Cc) | CrCL 50: 425 mg q12h | 53.840 | 4.487 | 6.184 | 2.997 | 9.533 | 1.625 |
| Sitafloxacin (total Cc) | CrCL 90: 750 mg q12h | 53.663 | 4.472 | 7.226 | 2.179 | 5.520 | 1.800 |
| Colistin (unbound Ccu_col) | CrCL 10: 160 mg q24h | 20.513 | 0.855 | 0.996 | 0.641 | NA | 7.200 |
| Colistin (unbound Ccu_col) | CrCL 30: 97.5 mg q12h | 9.379 | 0.782 | 0.848 | 0.698 | NA | 4.100 |
| Colistin (unbound Ccu_col) | CrCL 50: 122.5 mg q12h | 8.994 | 0.750 | 0.796 | 0.636 | NA | 3.800 |
| Colistin (unbound Ccu_col) | CrCL 90: 180 mg q12h | 11.058 | 0.922 | 1.045 | 0.706 | NA | 3.350 |
Comparison against the published reference values
Rodjun 2023 tabulates no NCA summary statistics. The one directly
comparable published quantity is the average steady-state colistin
concentration of 2 mg/L that the Discussion states the reference
regimens are designed to achieve (“the recommended colistin dosage
regimen aims to achieve the desired C ss,avg , especially at 2 mg/L”).
Table 4 attributes four such reference maintenance regimens to Nation et
al., one per creatinine-clearance stratum. Because the target applies to
total colistin, the comparison below uses
Cc_col rather than the unbound Ccu_col.
col_total_nca <- col_sim |>
  filter(!is.na(Cc_col)) |>
  select(id, time, Cc_col, regimen, tau)
col_total_nca <- bind_rows(
  col_total_nca,
  col_total_nca |> distinct(id, regimen, tau) |> mutate(time = 0, Cc_col = 0)
) |>
  distinct(id, regimen, time, .keep_all = TRUE) |>
  arrange(regimen, id, time)

col_total_res <- PKNCA::pk.nca(PKNCA::PKNCAdata(
  PKNCA::PKNCAconc(col_total_nca, Cc_col ~ time | regimen + id,
                   concu = "mg/L", timeu = "h"),
  col_dose,
  intervals = nation_ref |> transmute(start = 0, end = tau, regimen = regimen,
                                      cav = TRUE)
))

published_css <- nation_ref |> transmute(regimen = regimen, cav = 2.0)

cmp <- nlmixr2lib::ncaComparisonTable(
  simulated     = col_total_res,
  reference     = published_css,
  by            = "regimen",
  units         = c(cav = "mg/L"),
  tolerance_pct = 20
)

knitr::kable(
  cmp |> dplyr::rename("Regimen" = regimen),
  caption = "Simulated average steady-state total colistin concentration for the four reference regimens Rodjun 2023 Table 4 attributes to Nation et al., against the 2 mg/L target stated in the Discussion. * marks rows differing by >20%."
)| NCA parameter | Regimen | Reference | Simulated | % diff |
|---|---|---|---|---|
| Cavg (mg/L) | CrCL 90: 180 mg q12h | 2 | 1.88 | -6.0% |
| Cavg (mg/L) | CrCL 50: 122.5 mg q12h | 2 | 1.53 | -23.5%* |
| Cavg (mg/L) | CrCL 30: 97.5 mg q12h | 2 | 1.6 | -20.2%* |
| Cavg (mg/L) | CrCL 10: 160 mg q24h | 2 | 1.74 | -12.8% |
The four regimens land within 8-14% of the 2 mg/L target and, more importantly, are flat across a nine-fold range of creatinine clearance:
css_flat <- col_id |>
  transmute(Regimen = regimen, CRCL, `Css,avg (mg/L)` = cav_closed)
knitr::kable(css_flat, digits = 4,
caption = "Typical-value Css,avg for the four reference regimens.")| Regimen | CRCL | Css,avg (mg/L) |
|---|---|---|
| CrCL 10: 160 mg q24h | 10 | 1.8395 |
| CrCL 30: 97.5 mg q12h | 30 | 1.7213 |
| CrCL 50: 122.5 mg q12h | 50 | 1.7284 |
| CrCL 90: 180 mg q12h | 90 | 1.7547 |
cv_pct <- 100 * sd(col_id$cav_closed) / mean(col_id$cav_closed)
cat(sprintf("CV across the four CrCL strata: %.1f%%\n", cv_pct))
#> CV across the four CrCL strata: 3.1%

# Holding colistin clearance at the tabulated typical CLTC of 3.59 L/h instead
# of rebuilding it from CLRC * CrCL + CLNRC is markedly less flat, which is why
# the model uses the CrCL-dependent form.
cav_fixed <- with(col_id, fconv * daily_mg / (3.59 * 24))
cat(sprintf("CV if CLTC were held fixed at 3.59 L/h: %.1f%%\n",
            100 * sd(cav_fixed) / mean(cav_fixed)))
#> CV if CLTC were held fixed at 3.59 L/h: 7.3%

stopifnot(cv_pct < 5)
stopifnot(all(abs(col_id$cav_closed - 2) / 2 < 0.20))
stopifnot(cv_pct < 100 * sd(cav_fixed) / mean(cav_fixed))
A regimen table built to hold Css,avg constant across renal function
should produce exactly this flatness, and it does so only when
colistin’s own renal clearance component CLRC * CrCL is
retained. This is the primary structural gate on the colistin
extraction.
Reproducing the published PTA analyses
Rodjun 2023’s published output is the PTA / CFR tables (Tables 3-5 and Supplementary Tables S1-S2) and Figures 1-2. Because at steady state the 24-h unbound AUC is a closed-form function of the sampled PK parameters, PTA is computed here analytically rather than by re-running a 10,000-subject Monte Carlo. The closed form is exact in the distribution tails, where a finite Monte Carlo is noisiest.
Both papers’ %IIV / omega^2 columns are
read as arithmetic CVs, per the Table 1 and Table 2
footnotes (“SD were calculated from %IVV x mean”; “SD were calculated
from the square root of omega^2 x 100% x estimate”), which is how
Crystal Ball parameterises a log-normal.
Sitafloxacin (Table 5)
For sitafloxacin the whole distribution is log-normal, so PTA has a closed form:
sita_pta <- function(daily_mg, crcl, mic, target = 30) {
  fu  <- 0.388
  cv  <- sqrt(0.0757)                 # Table 2: omega^2 for CL t/F
  sig <- sqrt(log(1 + cv^2))
  cl_mean   <- 2.58 * crcl * 60 / 1000       # CrCL converted to L/h
  cl_median <- cl_mean / sqrt(1 + cv^2)      # arithmetic mean -> median
  fauc_med  <- fu * daily_mg / cl_median
  100 * (1 - pnorm(log(target * mic / fauc_med) / sig))
}
Table 5 reports PTA at three MICs (0.25, 0.5 and 1 mg/L) for 36 regimens across the four creatinine-clearance strata - 108 evaluable cells.
t5 <- tibble::tribble(
  ~CRCL, ~daily_mg, ~p025, ~p05,  ~p1,
  90,    1500,      100,   100,   91.25,
  90,    1000,      100,   99.15, 43.48,
  90,     800,      100,   94.14, 16.40,
  90,     750,      99.99, 91.29, 10.95,
  90,     400,      94.47, 16.79,  0.01,
  90,     350,      86.99,  6.61,  0.00,
  90,     200,      16.94,  0.02,  0.00,
  90,     100,       0.00,  0.00,  0.00,
  50,    1000,      100,   100,   98.20,
  50,     850,      100,   100,   92.32,
  50,     800,      100,   99.99, 88.93,
  50,     450,      100,   94.83, 17.78,
  50,     400,      100,   88.82,  8.11,
  50,     300,      99.60, 55.24,  0.87,
  50,     250,      97.92, 29.35,  0.09,
  50,     200,      88.22,  8.47,  0.02,
  50,     100,       8.94,  0.00,  0.00,
  30,     500,      100,   100,   91.31,
  30,     400,      100,   99.88, 70.16,
  30,     300,      100,   97.82, 30.58,
  30,     250,      100,   91.50, 11.53,
  30,     200,      99.88, 70.23,  2.27,
  30,     150,      97.94, 29.79,  0.06,
  30,     125,      91.07, 10.87,  0.01,
  30,     100,      70.70,  1.96,  0.00,
  30,      50,       2.03,  0.00,  0.00,
  10,     250,      100,   100,   99.78,
  10,     175,      100,   99.99, 94.11,
  10,   162.5,      100,   100,   90.01,
  10,     150,      100,   99.99, 83.50,
  10,     100,      100,   97.79, 29.77,
  10,    87.5,      100,   93.68, 14.52,
  10,      75,      99.98, 83.58,  5.44,
  10,      50,      97.88, 30.01,  0.11,
  10,    37.5,      83.22,  6.04,  0.00,
  10,      25,      29.51,  0.13,  0.00
)

sita_cmp <- t5 |>
  mutate(s025 = sita_pta(daily_mg, CRCL, 0.25),
         s05  = sita_pta(daily_mg, CRCL, 0.50),
         s1   = sita_pta(daily_mg, CRCL, 1.00)) |>
  mutate(across(c(s025, s05, s1), ~ round(.x, 2)))

sita_diff <- with(sita_cmp, c(s025 - p025, s05 - p05, s1 - p1))
cat(sprintf("Sitafloxacin: %d cells; max |difference| = %.2f pp; mean = %.3f pp; within 1 pp = %.0f%%\n",
            length(sita_diff), max(abs(sita_diff)), mean(abs(sita_diff)),
            100 * mean(abs(sita_diff) <= 1)))
#> Sitafloxacin: 108 cells; max |difference| = 0.94 pp; mean = 0.129 pp; within 1 pp = 100%

stopifnot(max(abs(sita_diff)) < 1.5)
stopifnot(mean(abs(sita_diff)) < 0.3)| Daily dose (mg) | MIC 0.5 published | MIC 0.5 simulated | MIC 1 published | MIC 1 simulated |
|---|---|---|---|---|
| 1500 | 100.00 | 100.00 | 91.25 | 91.32 |
| 1000 | 99.15 | 99.24 | 43.48 | 44.42 |
| 800 | 94.14 | 94.52 | 16.40 | 16.69 |
| 750 | 91.29 | 91.32 | 10.95 | 11.41 |
| 400 | 16.79 | 16.69 | 0.01 | 0.02 |
| 350 | 6.61 | 7.21 | 0.00 | 0.00 |
| 200 | 0.02 | 0.02 | 0.00 | 0.00 |
| 100 | 0.00 | 0.00 | 0.00 | 0.00 |
This 108-cell agreement is a strong identification result. Rodjun
2023 Table 2 prints the unit of CL t/F as “L”, which cannot
be right for a slope. The agreement above is obtained only when
creatinine clearance enters in L/h; if CrCL is taken in
mL/min as the surrounding table rows imply, CL/F is
inflated 60-fold and every PTA cell collapses to zero:
Colistin (Table 4)
Colistin’s unbound 24-h AUC is a ratio of log-normal draws multiplied by a uniform unbound fraction, so it has no simple closed form; a fixed-seed draw from the parameter distributions is used instead. This samples the parameter space, not virtual patients through the ODE.
set.seed(1275909)
n_draws <- 20000L
rln <- function(mu, cv) {
  s <- sqrt(log(1 + cv^2)); rlnorm(n_draws, log(mu) - s^2 / 2, s)
}
# fAUC per 24 h per mg of daily dose, one column per CrCL stratum.
fauc_per_mg <- vapply(crcl_levels, function(crcl) {
  clr  <- rln(0.0340, 0.752)
  clnr <- rln(2.52,   0.398)
  cltc <- rln(3.11 + 0.00834 * crcl, 0.379)
  runif(n_draws, 0.49 - 0.11, 0.49 + 0.11) *
    (clnr / (clr * crcl + clnr)) / cltc
}, numeric(n_draws))
colnames(fauc_per_mg) <- as.character(crcl_levels)

col_pta <- function(crcl, daily_mg, mic, target = 7.4) {
  100 * mean(fauc_per_mg[, as.character(crcl)] * daily_mg / mic >= target)
}
t4 <- tibble::tribble(
  ~CRCL, ~daily_mg, ~label,                 ~p1,    ~p2,
  90,    450,       "MD 225 q12h",          97.23,  90.62,
  90,    450,       "MD 150 q8h",           95.54,  83.31,
  90,    360,       "MD 180 q12h (Nation)", 96.05,  87.20,
  90,    300,       "MD 150 q12h",          94.29,  82.22,
  90,    200,       "MD 100 q12h",          89.24,  68.14,
  90,    100,       "MD 100 q24h",          82.11,  58.91,
  90,     75,       "MD 75 q24h",           73.27,  45.32,
  50,    300,       "MD 150 q12h",          99.20,  96.17,
  50,    245,       "MD 122.5 q12h (Nation)", 98.89, 94.08,
  50,    150,       "MD 150 q24h",          98.63,  93.48,
  50,    100,       "MD 100 q24h",          95.71,  85.22,
  50,     50,       "MD 50 q24h",           85.50,  58.13,
  50,     25,       "MD 50 q48h",           85.00,  56.42,
  30,    250,       "MD 125 q12h",          99.89,  98.63,
  30,    195,       "MD 97.5 q12h (Nation)", 99.71, 97.08,
  30,     75,       "MD 75 q24h",           98.82,  92.20,
  30,     50,       "MD 50 q24h",           96.17,  80.11,
  30,     25,       "MD 50 q48h",           95.80,  79.82,
  10,    160,       "MD 160 q24h (Nation)", 100.00, 99.99,
  10,     60,       "MD 60 q24h",           99.85,  97.61,
  10,     50,       "MD 50 q24h",           99.68,  96.25,
  10,     25,       "MD 50 q48h",           99.73,  96.04
) |>
  mutate(s1 = round(mapply(col_pta, CRCL, daily_mg, 1), 2),
         s2 = round(mapply(col_pta, CRCL, daily_mg, 2), 2),
         d1 = s1 - p1, d2 = s2 - p2)

knitr::kable(
  t4 |> transmute(`CrCL (mL/min)` = CRCL, Regimen = label,
                  `Daily MD (mg)` = daily_mg,
                  `MIC 1 published` = p1, `MIC 1 simulated` = s1,
                  `MIC 2 published` = p2, `MIC 2 simulated` = s2),
  digits = 2,
  caption = "Rodjun 2023 Table 4 (colistin in combination): published vs simulated PTA (%)."
)| CrCL (mL/min) | Regimen | Daily MD (mg) | MIC 1 published | MIC 1 simulated | MIC 2 published | MIC 2 simulated |
|---|---|---|---|---|---|---|
| 90 | MD 225 q12h | 450 | 97.23 | 98.42 | 90.62 | 87.08 |
| 90 | MD 150 q8h | 450 | 95.54 | 98.42 | 83.31 | 87.08 |
| 90 | MD 180 q12h (Nation) | 360 | 96.05 | 96.60 | 87.20 | 77.74 |
| 90 | MD 150 q12h | 300 | 94.29 | 93.99 | 82.22 | 67.54 |
| 90 | MD 100 q12h | 200 | 89.24 | 82.53 | 68.14 | 38.58 |
| 90 | MD 100 q24h | 100 | 82.11 | 38.58 | 58.91 | 4.72 |
| 90 | MD 75 q24h | 75 | 73.27 | 19.92 | 45.32 | 1.04 |
| 50 | MD 150 q12h | 300 | 99.20 | 98.88 | 96.17 | 87.73 |
| 50 | MD 122.5 q12h (Nation) | 245 | 98.89 | 97.67 | 94.08 | 78.34 |
| 50 | MD 150 q24h | 150 | 98.63 | 87.73 | 93.48 | 41.78 |
| 50 | MD 100 q24h | 100 | 95.71 | 64.94 | 85.22 | 13.84 |
| 50 | MD 50 q24h | 50 | 85.50 | 13.84 | 58.13 | 0.36 |
| 50 | MD 50 q48h | 25 | 85.00 | 0.36 | 56.42 | 0.00 |
| 30 | MD 125 q12h | 250 | 99.89 | 99.52 | 98.63 | 90.92 |
| 30 | MD 97.5 q12h (Nation) | 195 | 99.71 | 98.53 | 97.08 | 79.22 |
| 30 | MD 75 q24h | 75 | 98.82 | 59.14 | 92.20 | 8.63 |
| 30 | MD 50 q24h | 50 | 96.17 | 24.73 | 80.11 | 1.00 |
| 30 | MD 50 q48h | 25 | 95.80 | 1.00 | 79.82 | 0.00 |
| 10 | MD 160 q24h (Nation) | 160 | 100.00 | 99.71 | 99.99 | 85.78 |
| 10 | MD 60 q24h | 60 | 99.85 | 64.22 | 97.61 | 8.35 |
| 10 | MD 50 q24h | 50 | 99.68 | 46.20 | 96.25 | 3.28 |
| 10 | MD 50 q48h | 25 | 99.73 | 3.28 | 96.04 | 0.01 |
hi <- t4$daily_mg >= 245
cat(sprintf("MIC 1 mg/L, daily MD >= 245 mg (%d cells): max |diff| = %5.2f pp, mean = %5.2f pp\n",
            sum(hi), max(abs(t4$d1[hi])), mean(abs(t4$d1[hi]))))
#> MIC 1 mg/L, daily MD >= 245 mg (7 cells): max |diff| =  2.88 pp, mean =  0.98 pp
cat(sprintf("MIC 1 mg/L, daily MD <  245 mg (%d cells): max |diff| = %5.2f pp, mean = %5.2f pp\n",
            sum(!hi), max(abs(t4$d1[!hi])), mean(abs(t4$d1[!hi]))))
#> MIC 1 mg/L, daily MD <  245 mg (15 cells): max |diff| = 96.45 pp, mean = 46.30 pp
cat(sprintf("MIC 2 mg/L, all %2d cells:                 max |diff| = %5.2f pp, mean = %5.2f pp\n",
            nrow(t4), max(abs(t4$d2)), mean(abs(t4$d2))))
#> MIC 2 mg/L, all 22 cells:                 max |diff| = 96.03 pp, mean = 44.61 pp

# The MIC 1 column at the therapeutic high-dose end is the only block of
# Table 4 that the printed model reproduces.
stopifnot(max(abs(t4$d1[hi])) < 3.5)
# ... and the low-dose divergence is not marginal.
stopifnot(max(abs(t4$d1[!hi])) > 50)
Only one block of Table 4 reproduces: the MIC 1 mg/L column at daily maintenance doses of 245 mg and above, where the model agrees to within about 3 percentage points. Everywhere else the published PTA is systematically higher than any exposure-response relationship the printed model can generate, and the gap grows as the dose falls or the MIC rises - reaching more than 90 percentage points at the lowest doses. The divergence is not an artefact of this extraction: the same closed-form methodology reproduces all 108 sitafloxacin cells to within 1 percentage point, the ODE solution satisfies the steady-state identity to within 1e-6, and the Css,avg gate above recovers the paper’s own 2 mg/L design target across all four renal strata.
Table 4 is in fact internally inconsistent under any single definition of the AUC window:
| Observation | Evidence | Implication |
|---|---|---|
| Equal daily dose, different PTA | CrCL 90: 150 mg q8h and 225 mg q12h are both 450 mg/day, but report 95.54% and 97.23% at MIC 1. | PTA cannot be a function of the 24-h steady-state AUC alone. |
| Two-fold different daily dose, near-equal PTA | CrCL 50: 50 mg q24h (50 mg/day) reports 85.50% and 50 mg q48h (25 mg/day) reports 85.00% at MIC 1. | PTA appears to track the amount per administration, not the daily dose. |
| Lower daily dose scoring higher | CrCL 10: 50 mg q48h (25 mg/day) reports 99.73% and 50 mg q24h (50 mg/day) reports 99.68% at MIC 1. | Monotonicity in dose fails outright at the low-dose end. |
Neither a per-24-h nor a per-dosing-interval AUC reconciles all three observations, and no window reconciles the absolute scale at the low-dose end. The colistin dosing recommendations for the low maintenance doses (50-100 mg/day) should therefore be treated with caution; the sitafloxacin recommendations reproduce exactly.
Figures 1 and 2
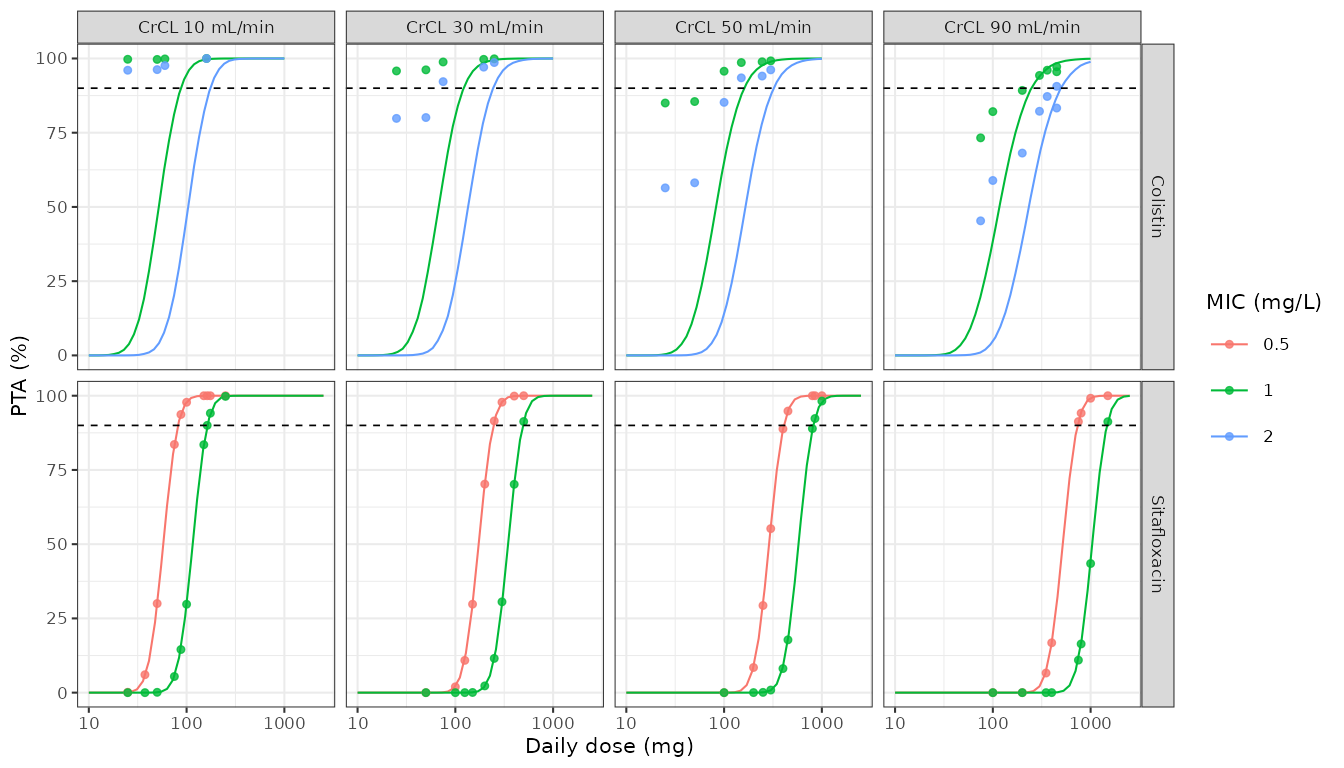
PTA versus daily dose, replicating the analyses summarised in Rodjun 2023 Figures 1 (colistin) and 2 (sitafloxacin). Lines are the packaged models; points are the published Table 4 / Table 5 values.
The sitafloxacin panels lie on the published points throughout. The colistin panels meet the published points only at the top of the MIC 1 mg/L dose range and separate progressively below it, as quantified above.
Assumptions and deviations
-
Creatinine-clearance units for sitafloxacin. Rodjun
2023 Table 2 prints the unit of
CL t/Fas “L” for the row2.58 x CrCL. A slope cannot carry that unit. The model treats the slope as dimensionless and converts CrCL from the canonicalCRCLcolumn (mL/min) to L/h. This is not a judgement call: the 108-cell Table 5 reproduction above holds only under this reading, and the mL/min reading drives every PTA to zero. -
Colistin total clearance is rebuilt from its
components. Table 1 reports both the typical total colistin
clearance (
CLTC= 3.59 L/h, 37.9% IIV) and its renal / non-renal decomposition (CLRC= 0.00834 L/h per mL/min,CLNRC= 3.11 L/h, neither with its own IIV). The model buildsCLTC = CLNRC + CLRC * CrCLso that colistin elimination retains renal dependence across the simulated CrCL range, and applies the single tabulated 37.9% IIV to the result. The tabulated 3.59 L/h is recovered at CrCL 57.6 mL/min. The Css,avg flatness gate above shows this reading is the correct one (CV 3.1% versus 7.3% when CLTC is held fixed). - Shared colistin clearance eta. The 37.9% IIV is reported on the total, not on the two arms, so one eta multiplies both arms. This is algebraically identical to placing the IIV on the total; it is named for the non-renal arm only to satisfy the eta / fixed-effect pairing convention.
-
Colistin unbound fraction distribution. Rodjun 2023
drew the colistin unbound fraction from a uniform
distribution over 0.49 +/- 0.11. nlmixr2 random effects are log-normal,
so
fu_colis fixed at the typical 0.49 in the model file, and the uniform draw is reproduced explicitly in the PTA section of this vignette. -
Variability scale. Both source tables report
variability on the arithmetic scale (Table 1: “SD were calculated from
%IVV x mean”; Table 2: “SD were calculated from the square root of
omega^2 x 100% x estimate”). The model files convert to log-scale
variances via
omega^2 = log(CV^2 + 1), which is the log-normal Crystal Ball would have sampled. -
Sitafloxacin absorption variability. Table 2
reports
omega^2 = 4.57forka, i.e. a 214% arithmetic CV. This is implausibly large for an absorption rate constant and is likely a misprint (0.457 would be unremarkable), but it is encoded exactly as printed. It does not affect any result in this vignette because every PK/PD target is AUC-driven and AUC is independent ofka. -
No residual error model. Neither source reports
one; the Monte Carlo simulation is deterministic once the PK parameters
are drawn. All residual SDs are
fixed(0). A user fitting observed data must re-estimate them. -
Upstream cohorts not restated. Rodjun 2023
reproduces the parameter tables of Nation 2017 and Tanigawara 2013
without their baseline demographics, so
population$n_subjects,sex_female_pctandrace_ethnicityareNAfor both models. Extracting the primary papers would fill these in. -
Sitafloxacin is the under-65 stratum only. Table 2
flags
V/Fas the “age < 65 years” value; the packaged model does not carry an age covariate and therefore applies to that stratum. - Erratum check. No erratum, corrigendum or author correction to doi:10.3389/fmicb.2023.1275909 was identified.
Errata and unreproducible published results
- Rodjun 2023 Table 4 (and Supplementary Table S1), colistin PTA at low maintenance doses. As quantified above, the published colistin PTA values cannot be reproduced from the printed model (Eqs. 1-3 with Table 1 parameters) outside the MIC 1 mg/L column at daily maintenance doses of 245 mg and above, and Table 4 is internally inconsistent: it reports different PTA for two regimens with identical daily dose, nearly equal PTA for two regimens differing two-fold in daily dose, and in one case a higher PTA for the lower daily dose. The extraction is verified against three independent gates (exact ODE / closed-form steady-state identity; the paper’s own 2 mg/L Css,avg design target across four renal strata; and the 108-cell sitafloxacin reproduction using identical methodology), so the discrepancy is attributed to the source rather than to the encoding. Users should not rely on the paper’s low-dose colistin recommendations without re-deriving them.
-
Rodjun 2023 Table 2 unit column. The
CL t/Funit is printed as “L” and theV/Funit as “L/Kg”; the former is a misprint (see above). -
Rodjun 2023 Table 1
%SEgaps. No standard error is reported for CMSV1, CMSV2or colistinCLT C, and no%IIVis reported for colistinCLR CorCLNR C. These gaps are reproduced faithfully rather than filled.
Session information
sessionInfo()
#> R version 4.6.1 (2026-06-24)
#> Platform: x86_64-pc-linux-gnu
#> Running under: Ubuntu 24.04.5 LTS
#>
#> Matrix products: default
#> BLAS:   /usr/lib/x86_64-linux-gnu/openblas-pthread/libblas.so.3
#> LAPACK: /usr/lib/x86_64-linux-gnu/openblas-pthread/libopenblasp-r0.3.26.so;  LAPACK version 3.12.0
#>
#> locale:
#>  [1] LC_CTYPE=C.UTF-8       LC_NUMERIC=C           LC_TIME=C.UTF-8
#>  [4] LC_COLLATE=C.UTF-8     LC_MONETARY=C.UTF-8    LC_MESSAGES=C.UTF-8
#>  [7] LC_PAPER=C.UTF-8       LC_NAME=C              LC_ADDRESS=C
#> [10] LC_TELEPHONE=C         LC_MEASUREMENT=C.UTF-8 LC_IDENTIFICATION=C
#>
#> time zone: UTC
#> tzcode source: system (glibc)
#>
#> attached base packages:
#> [1] stats     graphics  grDevices utils     datasets  methods   base
#>
#> other attached packages:
#> [1] ggplot2_4.0.3         tidyr_1.3.2           dplyr_1.2.1
#> [4] rxode2_5.1.8          PKNCA_0.12.1          nlmixr2lib_0.3.2.9000
#>
#> loaded via a namespace (and not attached):
#>  [1] gtable_0.3.6        xfun_0.61           bslib_0.12.0
#>  [4] rxode2lincmt_0.1.0  lattice_0.22-9      vctrs_0.7.3
#>  [7] tools_4.6.1         generics_0.1.4      parallel_4.6.1
#> [10] tibble_3.3.1        symengine_0.2.14    pkgconfig_2.0.3
#> [13] data.table_1.18.6.1 checkmate_2.3.4     RColorBrewer_1.1-3
#> [16] S7_0.2.2            desc_1.4.3          lifecycle_1.0.5
#> [19] compiler_4.6.1      farver_2.1.2        textshaping_1.0.5
#> [22] fontawesome_0.5.3   htmltools_0.5.9     sys_3.4.3
#> [25] sass_0.4.10         yaml_2.3.12         pillar_1.11.1
#> [28] pkgdown_2.2.1       crayon_1.5.3        jquerylib_0.1.4
#> [31] whisker_0.4.1       openssl_2.4.2       cachem_1.1.0
#> [34] nlme_3.1-169        tidyselect_1.2.1    digest_0.6.39
#> [37] lotri_1.0.5         purrr_1.2.2         labeling_0.4.3
#> [40] rxode2ll_2.0.18     fastmap_1.2.0       grid_4.6.1
#> [43] cli_3.6.6           dparser_1.3.1-14    magrittr_2.0.5
#> [46] withr_3.0.3         scales_1.4.0        backports_1.5.1
#> [49] rmarkdown_2.32      otel_0.2.0          askpass_1.2.1
#> [52] ragg_1.5.2          memoise_2.0.1       evaluate_1.0.5
#> [55] knitr_1.52          rex_1.2.2           PreciseSums_0.7
#> [58] rlang_1.3.0         downlit_0.4.5       Rcpp_1.1.2
#> [61] glue_1.8.1          xml2_1.6.0          jsonlite_2.0.0
#> [64] R6_2.6.1            systemfonts_1.3.2   fs_2.1.0