Tenofovir in vivo/ex vivo PK/PD for HIV prevention (Jayachandran 2021)
Source:vignettes/articles/Jayachandran_2021_tenofovir.Rmd
Jayachandran_2021_tenofovir.RmdModels and source
Jayachandran 2021 built a mechanistic in vivo / ex vivo pharmacokinetic-pharmacodynamic model of tenofovir (TFV) for rectal HIV pre-exposure prophylaxis, using data from the RMP-02/MTN-006 phase 1 trial. The paper is reproduced here as two coupled model files, matching the authors’ sequential build:
-
Jayachandran_2021_tenofovir– the seven-compartment multicompartment PK model: plasma TFV (two-compartment, oral or rectal absorption) plus four biophase effect compartments carrying TFV and its intracellular anabolite tenofovir-diphosphate (TFVdp) in rectal tissue, rectal mucosal mononuclear cells (MMCs), and peripheral blood mononuclear cells (PBMCs). -
Jayachandran_2021_tenofovir_p24– the ex vivo HIV-1 viral-dynamics PK/PD model: an exponential viral-growth compartment feeding a delayed p24-antigen compartment, with the MMC TFVdp concentration inhibiting viral growth. The MMC TFVdp trajectory comes from the PK model above; the authors fitted the PD layer with the PK parameters fixed.
pk <- readModelDb("Jayachandran_2021_tenofovir")
pd <- readModelDb("Jayachandran_2021_tenofovir_p24")- Citation: Jayachandran P, Garcia-Cremades M, Vucicevic K, Bumpus NN, Anton P, Hendrix C, Savic R. A Mechanistic In Vivo/Ex Vivo Pharmacokinetic-Pharmacodynamic Model of Tenofovir for HIV Prevention. CPT Pharmacometrics Syst Pharmacol. 2021;10(3):179-187. doi:10.1002/psp4.12583. Structural parameters from Table 1; plasma two-compartment and biophase effect-compartment equations from Methods (Eqs 1-4 and the plasma disposition); route stratification and fixed uptake rates from the Supplementary Model Code 1 NONMEM control stream.
- Article: CPT Pharmacometrics Syst Pharmacol. 2021;10(3):179-187
- Supplement (open access): NONMEM control streams (Supplementary Model Code 1 and 2) and Tables S1-S3.
Population
Eighteen HIV-1 seronegative healthy adults (14 men, 4 women; 22-66 years) in the two-site RMP-02/MTN-006 trial (NCT00984971) received a single oral 300 mg TDF dose (= 136 mg TFV), then a single rectal dose of 1% TFV gel (44 mg TFV) or placebo, then seven consecutive daily rectal doses. PK was sampled in five matrices (plasma and rectal-tissue TFV; PBMC, rectal-tissue and MMC TFVdp). Rectal-tissue explants were collected, infected ex vivo with HIV-1, and cumulative p24 antigen expression measured over a 14-day assay as a biomarker of microbicide efficacy (Study population design and Table S1).
The tissue and cellular matrices were sparse and heavily censored (70-94% below the limit of quantification), so between-subject variability was retained only on oral absorption rate and central volume; rectal PBMC uptake was not estimable (all rectal-arm PBMC concentrations were below quantification).
The same information is available programmatically via each model’s
population metadata
(e.g. readModelDb("Jayachandran_2021_tenofovir")()$population).
Source trace
Per-parameter origins are recorded as in-file comments next to each
ini() entry. Key entries:
| Equation / parameter | Value | Source location |
|---|---|---|
lka_oral / lka_rectal
|
1.78 / 22.2 /h | Table 1 (plasma TFV) |
lcl, lvc, lq,
lvp
|
52.1 L/h, 679 L, 7.90 L/h, 399 L | Table 1 (plasma TFV) |
lfrectal |
0.102 | Table 1 ‘F rectal’ |
lke0_* / lppc_* (rectal tissue, MMC,
PBMC) |
Table 1 k/R terms | Table 1; Methods Eqs 1-4 |
| plasma / matrix residual errors | Table 1 %CV | Table 1 |
IIV on ka_oral (51.2%) / vc (21.2%) |
var 0.262 / 0.045 | Table 1; Supplementary Model Code 1 $OMEGA
|
d/dt(virus) = kgrow*virus*(1-E) - kdeath*virus |
Eq 5 | Methods |
d/dt(p24) = kp24*(ratio*virus - p24) |
Eq 6 | Methods |
kgrow, kdeath, kp24,
ratio, kdeg
|
0.0320, 0.0193, 0.00400, 0.0404, 0.0018 | Table 2 (TOTAL) |
slope (linear drug effect) |
0.00011 (pg/mL)/(fmol/million cells) | Table 2 (TOTAL) |
E = slope * CP * exp(-kdeg*t) |
drug effect | Methods; Supplementary Model Code 2 |
Multicompartment PK model
Event tables
The model is multi-output: doses are placed on the depot
compartment and observation records are placed on a real ODE state
(central) with dvid = 1L;
rxSolve() then returns every observable (Cc,
Crt_tfv, Crt_tfvdp, Cmmc_tfvdp,
Cpbmc_tfvdp) as a column on every observation row.
ROUTE_ORAL selects the route-specific absorption,
bioavailability, residual-error and biophase parameter sets.
set.seed(20210301)
N_ARM <- 60L  # well under the 200/arm cap

pk_events <- function(dose, route, id_offset, tmax = 168, dt = 1) {
  dplyr::bind_rows(
    data.frame(id = 1L, time = 0, amt = dose, cmt = "depot",
               evid = 1L, dvid = NA_integer_, ROUTE_ORAL = route),
    data.frame(id = 1L, time = seq(0, tmax, dt), amt = NA_real_, cmt = "central",
               evid = 0L, dvid = 1L, ROUTE_ORAL = route)
  ) |>
    dplyr::slice(rep(seq_len(dplyr::n()), N_ARM)) |>
    dplyr::mutate(id = id_offset + rep(seq_len(N_ARM), each = dplyr::n() / N_ARM))
}

ev_oral   <- pk_events(dose = 136, route = 1L, id_offset = 0L)    |> mutate(arm = "Oral 300 mg TDF")
ev_rectal <- pk_events(dose = 44,  route = 0L, id_offset = 1000L) |> mutate(arm = "Rectal 1% TFV gel")
# IDs are disjoint across arms (offset by 1000), so no subject collapses.
stopifnot(length(intersect(ev_oral$id, ev_rectal$id)) == 0)
Simulation and Figure 3 (concentration-time profiles by matrix and route)
sim_oral   <- rxode2::rxSolve(pk, ev_oral,   useLinCmt = FALSE, returnType = "data.frame")
#> ℹ parameter labels from comments will be replaced by 'label()'
#> Warning: some etas defaulted to non-mu referenced, possible parsing error: etalka_oral
#> as a work-around try putting the mu-referenced expression on a simple line
sim_rectal <- rxode2::rxSolve(pk, ev_rectal, useLinCmt = FALSE, returnType = "data.frame")
sim_pk <- dplyr::bind_rows(
  sim_oral   |> mutate(arm = "Oral 300 mg TDF"),
  sim_rectal |> mutate(arm = "Rectal 1% TFV gel")
)
# Replicates Figure 3 of Jayachandran 2021: plasma TFV concentration-time
# profiles by study arm (median with 5-95% envelope).
sim_pk |>
  dplyr::filter(time > 0) |>
  group_by(arm, time) |>
  summarise(lo = quantile(Cc, 0.05), md = median(Cc), hi = quantile(Cc, 0.95),
            .groups = "drop") |>
  ggplot(aes(time, md)) +
  geom_ribbon(aes(ymin = pmax(lo, 1e-3), ymax = hi), alpha = 0.25) +
  geom_line() +
  facet_wrap(~arm, scales = "free_y") +
  scale_y_log10() +
  labs(x = "Time after dose (h)", y = "Plasma TFV (ng/mL)",
       title = "Figure 3 - plasma TFV by route",
       caption = "Replicates the plasma panels of Figure 3 of Jayachandran 2021.")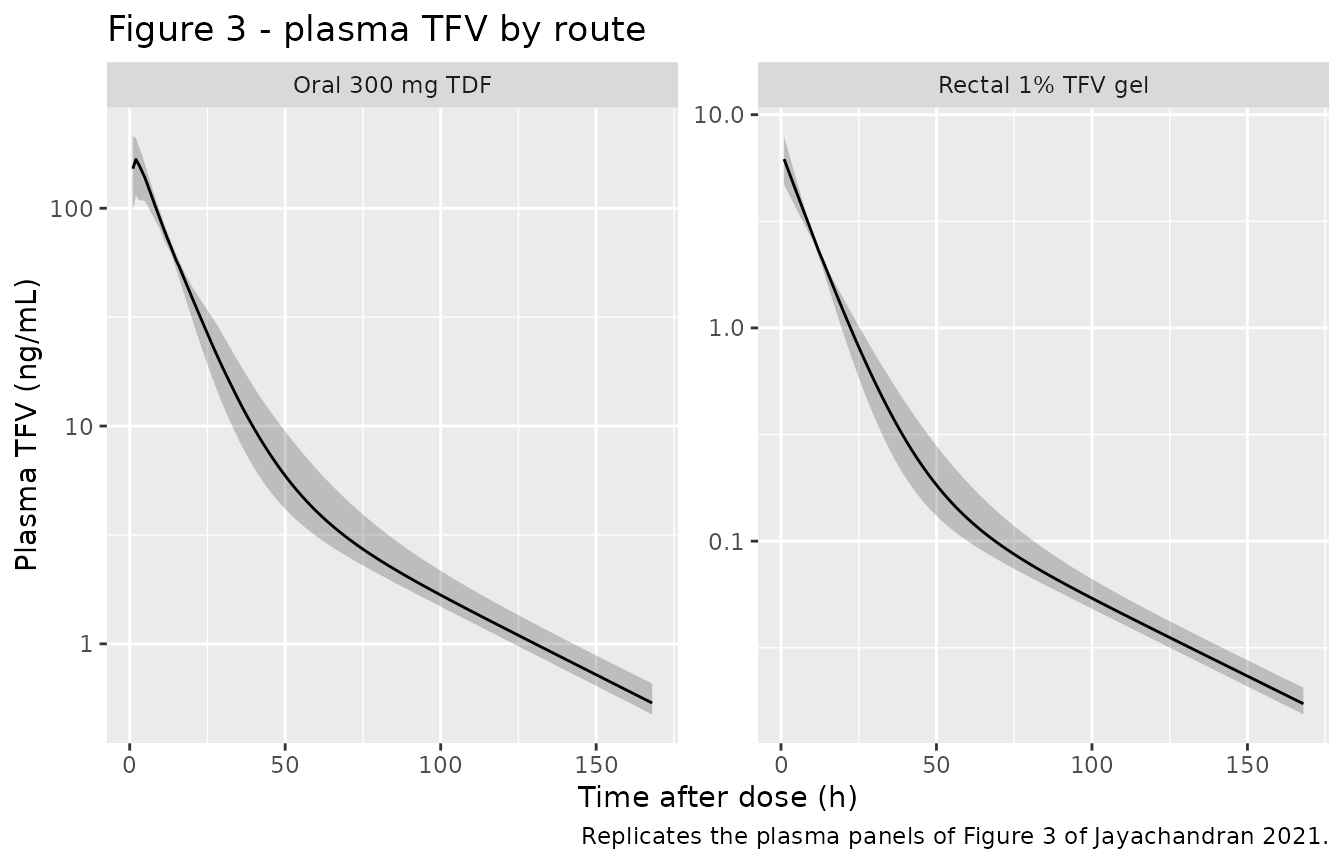
# Replicates Figure 3 of Jayachandran 2021: MMC TFVdp concentration-time
# profiles. Rectal dosing achieves much higher intracellular TFVdp.
sim_pk |>
  group_by(arm, time) |>
  summarise(md = median(Cmmc_tfvdp), .groups = "drop") |>
  ggplot(aes(time, md, colour = arm)) +
  geom_line(linewidth = 0.8) +
  labs(x = "Time after dose (h)", y = "MMC TFVdp (fmol/million cells)",
       colour = NULL, title = "Figure 3 - MMC TFVdp by route",
       caption = "Replicates the MMC panels of Figure 3 of Jayachandran 2021.")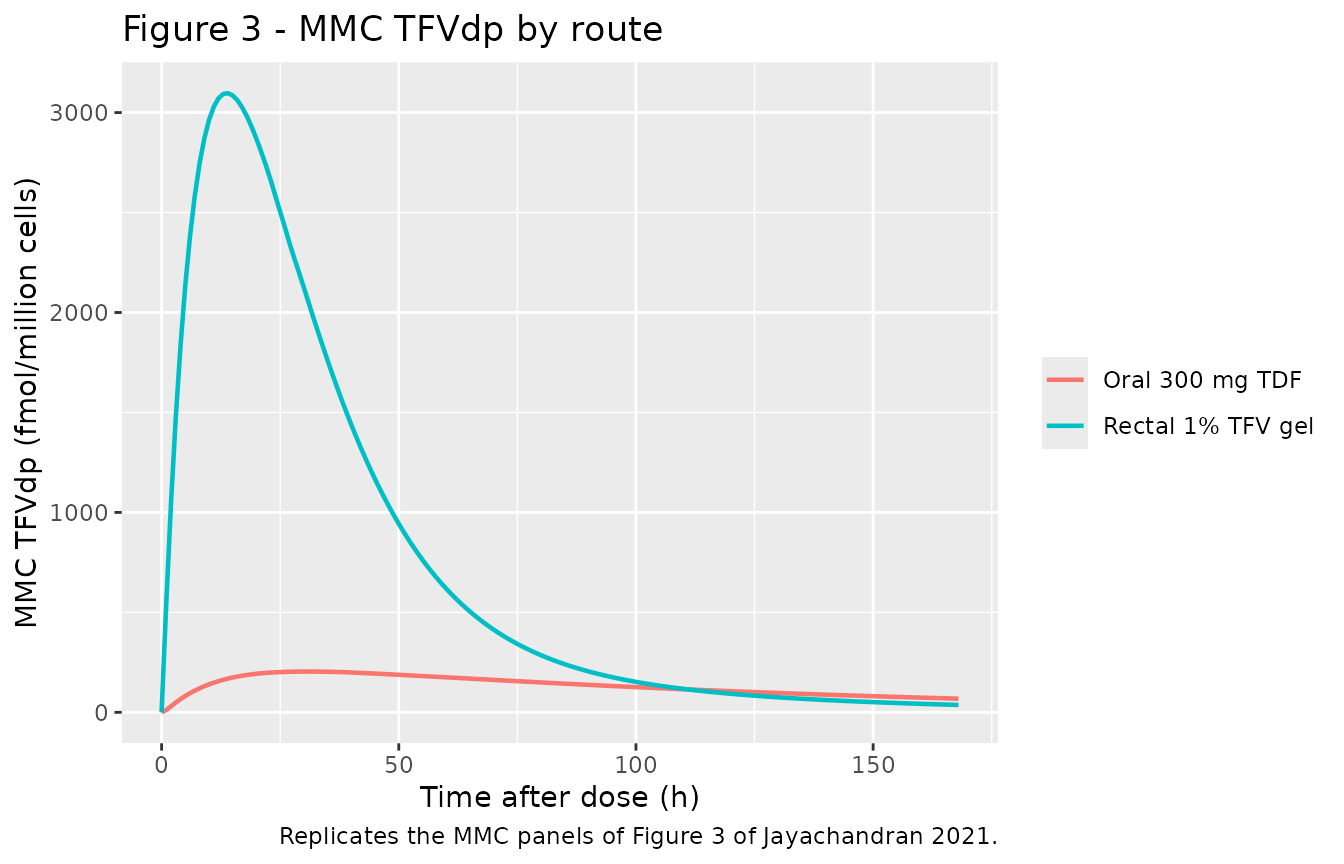
The published qualitative findings reproduce: rectal dosing yields lower plasma TFV but higher intracellular MMC TFVdp than oral dosing, and rectal-arm PBMC TFVdp is effectively zero (below quantification, gated in the model).
peak_plasma_oral   <- max(sim_oral$Cc, na.rm = TRUE)
peak_plasma_rectal <- max(sim_rectal$Cc, na.rm = TRUE)
peak_mmc_oral      <- max(sim_oral$Cmmc_tfvdp, na.rm = TRUE)
peak_mmc_rectal    <- max(sim_rectal$Cmmc_tfvdp, na.rm = TRUE)
max_pbmc_rectal    <- max(sim_rectal$Cpbmc_tfvdp, na.rm = TRUE)

stopifnot(
  # Plasma TFV peaks fall inside the observed 0.31-387 ng/mL range (Table S1).
  peak_plasma_oral   < 387,
  peak_plasma_rectal < 387,
  # Rectal gives lower plasma but higher MMC TFVdp than oral (paper's finding).
  peak_plasma_rectal < peak_plasma_oral,
  peak_mmc_rectal    > peak_mmc_oral,
  # Rectal PBMC TFVdp is gated to zero (all rectal PBMC data were BLQ).
  max_pbmc_rectal == 0
)
PKNCA characterisation of plasma TFV (oral arm)
Jayachandran 2021 reports no non-compartmental summary table of its own (initial estimates were seeded from an earlier NCA, ref 19), so the PKNCA output below is a characterisation of the packaged model rather than a row-by-row reproduction. It is validated against the observed plasma TFV concentration range in Table S1 (0.310-387 ng/mL).
sim_nca <- sim_oral |>
  dplyr::filter(!is.na(Cc)) |>
  dplyr::mutate(treatment = "Oral 300 mg TDF") |>
  dplyr::select(id, time, Cc, treatment)

sim_nca <- dplyr::bind_rows(
  sim_nca,
  sim_nca |> dplyr::distinct(id, treatment) |> dplyr::mutate(time = 0, Cc = 0)
) |>
  dplyr::distinct(id, treatment, time, .keep_all = TRUE) |>
  dplyr::arrange(id, treatment, time)

conc_obj <- PKNCA::PKNCAconc(sim_nca, Cc ~ time | treatment + id)
dose_df  <- ev_oral |> dplyr::filter(evid == 1) |>
  dplyr::mutate(treatment = "Oral 300 mg TDF") |>
  dplyr::select(id, time, amt, treatment)
dose_obj <- PKNCA::PKNCAdose(dose_df, amt ~ time | treatment + id)

intervals <- data.frame(start = 0, end = Inf,
                        cmax = TRUE, tmax = TRUE, aucinf.obs = TRUE, half.life = TRUE)
nca_res <- PKNCA::pk.nca(PKNCA::PKNCAdata(conc_obj, dose_obj, intervals = intervals))

nca_summary <- as.data.frame(nca_res) |>
  dplyr::group_by(PPTESTCD) |>
  dplyr::summarise(median = median(PPORRES, na.rm = TRUE), .groups = "drop")
knitr::kable(nca_summary, digits = 2,
caption = "Simulated plasma TFV NCA (oral arm), median across subjects.")| PPTESTCD | median |
|---|---|
| adj.r.squared | 1.00 |
| aucinf.obs | 2582.01 |
| clast.obs | 0.54 |
| clast.pred | 0.53 |
| cmax | 167.42 |
| half.life | 41.17 |
| lambda.z | 0.02 |
| lambda.z.n.points | 78.00 |
| lambda.z.time.first | 91.00 |
| lambda.z.time.last | 168.00 |
| r.squared | 1.00 |
| span.ratio | 1.87 |
| tlast | 168.00 |
| tmax | 2.00 |
cmax_med <- nca_summary$median[nca_summary$PPTESTCD == "cmax"]
thalf_med <- nca_summary$median[nca_summary$PPTESTCD == "half.life"]
stopifnot(
  # Simulated oral plasma TFV Cmax lies inside the observed range (Table S1).
  cmax_med > 0.31, cmax_med < 387,
  # Terminal half-life is on the multi-hour-to-day scale expected for plasma TFV.
  thalf_med > 2, thalf_med < 120
)
Ex vivo viral-dynamics PK/PD model
The PD model consumes the MMC TFVdp concentration as the exogenous
covariate CONC_TFVDP_FMOLMC (0 for a baseline /
no-treatment explant). The drug effect is
E = slope * CONC_TFVDP_FMOLMC * exp(-kdeg * t), so viral
growth is inhibited by (1 - E). The states start at 10^4
virions with no p24.
Target concentration for apparent viral suppression (Figure 5)
The paper’s headline result is a target MMC TFVdp concentration that
suppresses apparent viral replication to 1%. From the linear-effect
definition E = kg*(1 - slope*CP) (Methods), suppression to
1% of the uninhibited growth requires slope*CP = 0.99,
i.e. CP = 0.99/slope. With the packaged
slope = 0.00011 this is exactly the published 9,000
fmol/million cells.
p24 suppression trajectories (Figure 5)
pd_sim <- function(cp, tmax = 336, dt = 4) {
  ev <- data.frame(id = 1L, time = seq(0, tmax, dt), amt = NA_real_, cmt = "virus",
                   evid = 0L, dvid = 1L, CONC_TFVDP_FMOLMC = cp)
  rxode2::rxSolve(pd, ev, useLinCmt = FALSE, returnType = "data.frame") |>
    dplyr::mutate(cp = cp)
}

pd_grid <- dplyr::bind_rows(lapply(c(0, 500, 2000, 5000, 9000, 11000), pd_sim))
#> ℹ parameter labels from comments will be replaced by 'label()'

ggplot(pd_grid, aes(time, Cp24, colour = factor(cp), group = cp)) +
  geom_line(linewidth = 0.8) +
  labs(x = "Ex vivo assay time (h)", y = "Cumulative p24 antigen (pg/mL)",
       colour = "MMC TFVdp\n(fmol/10^6 cells)",
       title = "Figure 5 - simulated cumulative p24 by MMC TFVdp concentration",
       caption = "Replicates Figure 5 of Jayachandran 2021.")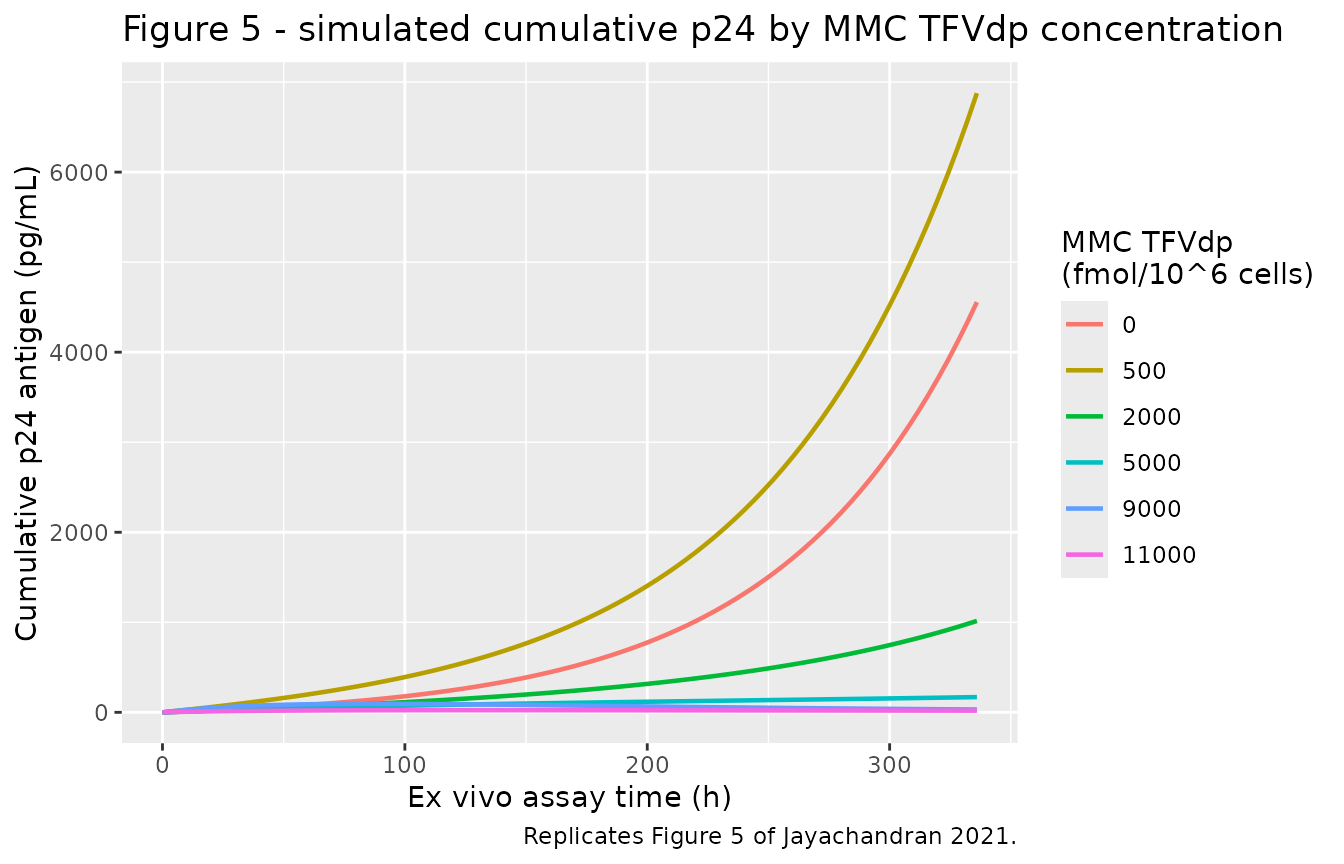
finals <- pd_grid |>
  dplyr::group_by(cp) |>
  dplyr::summarise(virus_final = dplyr::last(virus),
                   p24_final = dplyr::last(Cp24), .groups = "drop")
knitr::kable(finals, digits = 1,
caption = "End-of-assay virus and cumulative p24 by MMC TFVdp concentration.")| cp | virus_final | p24_final |
|---|---|---|
| 0 | 713216.6 | 4556.3 |
| 500 | 457626.6 | 6876.6 |
| 2000 | 120887.3 | 1015.2 |
| 5000 | 8435.7 | 169.1 |
| 9000 | 242.3 | 31.8 |
| 11000 | 41.1 | 18.6 |
virus0    <- finals$virus_final[finals$cp == 0]
virus9000 <- finals$virus_final[finals$cp == 9000]
p24_0     <- finals$p24_final[finals$cp == 0]
p24_9000  <- finals$p24_final[finals$cp == 9000]
# The end-of-assay virus count falls monotonically with increasing MMC TFVdp.
# Cumulative p24 is a heavily delayed follower of the virus trajectory (kp24
# half-life ~173 h), so end-of-assay p24 is NOT a monotonic function of CP -
# it plateaus and trends downward at higher concentrations, exactly as
# Jayachandran 2021 describes for the p24 slope. We therefore assert
# monotonicity only on the virus endpoint, and strong suppression of both
# endpoints at the 9,000 target relative to the untreated (CP = 0) explant.
stopifnot(
  all(diff(finals$virus_final) < 0),
  virus9000 < 0.02 * virus0,
  p24_9000  < 0.05 * p24_0
)
Assumptions and deviations
- Total-MMC cell type. Table 2 reports the PK/PD model for CD4-, CD4+ and total MMC cell types; only the drug-effect slope and residual error differ between them (0.00042, 0.00008 and 0.00011 respectively). The packaged PD model ships the total cell type, the one the authors used for their target-concentration simulations. The CD4-/CD4+ slopes are recorded here for completeness.
- Growth and expression rates fixed to literature. Table 2 fixes the viral growth rate at 0.0320/h and the p24 expression rate at 0.00400/h (“fixed to literature value”), and the packaged model uses those as-run values. The Methods text cites literature values of 0.045/h and 0.0059/h; where the text and the fitted table disagree, the maintainers used the as-run table values, which are what the model actually ran with.
- Route-stratified biophase parameters. Both the equilibration rate and the plasma-to-matrix ratio are stratified oral vs rectal (Table 1). The rectal PBMC rate and ratio were not estimated (all rectal PBMC data were below quantification), so the packaged model gates PBMC uptake to zero for rectal dosing; a rectal simulation therefore predicts no PBMC TFVdp, matching the data.
-
Concentration units. Plasma amounts are in mg and
volumes in L, so the observed plasma TFV concentration is formed as
1000 * central / vcto give ng/mL (= mcg/L), reproducing the control-streamS2 = V2/1000scaling. -
MMC TFVdp as an exogenous covariate. The PD model
takes the MMC TFVdp concentration as the covariate
CONC_TFVDP_FMOLMCrather than coupling the PK ODEs directly, exactly as the authors’ Supplementary Model Code 2 supplies it as the data columnCP. A downstream user couples the two models by feeding the PK model’sCmmc_tfvdp(30-minutes-postdose value) into this covariate. -
Cp24observation name. The cumulative p24 antigen output is a paper-mechanistic single-output PD endpoint with no canonical observation name; it is reported asCp24, which raises an expected non-canonical single-output convention warning. There is no canonical name for this endpoint and no second paper to justify minting one, so the warning is accepted. - No correction notice for this article was found as of 2026-09-28. ```