Pramlintide (Fang 2013)
Source:vignettes/articles/Fang_2013_pramlintide.Rmd
Fang_2013_pramlintide.RmdModel and source
- Citation: Fang J, Landersdorfer CB, Cirincione B, Jusko WJ (2013). Study Reanalysis Using a Mechanism-Based Pharmacokinetic/Pharmacodynamic Model of Pramlintide in Subjects with Type 1 Diabetes. The AAPS Journal 15(1):15-29. doi:10.1208/s12248-012-9409-7. PMCID PMC3535104. Original clinical study: Colburn WA, Gottlieb AB, Koda J, Kolterman OG (1996) J Clin Pharmacol 36(1):13-24.
- Description: Mechanism-based population PK/PD model of pramlintide and postprandial plasma glucose in adults with type 1 diabetes mellitus (Fang 2013, a reanalysis of the Colburn 1996 AC137 crossover study). Pramlintide disposition is two-compartment with zero-order intravenous input and first-order elimination, a modelled 4 min duration for the nominal 2 min bolus regimen and an absorption lag time. Postprandial glucose is a two-compartment indirect-response (turnover) system: a 50 g meal glucose dose enters an intestine compartment by zero-order gastric emptying of duration Tin and is absorbed into plasma at first-order rate ka, endogenous hepatic glucose production kin is balanced against first-order utilisation kout, and glucose distributes to a peripheral pool. Pramlintide acts by two mechanisms: a dose-independent maximal prolongation of the gastric-emptying duration (S = 1 + Smax whenever pramlintide is given) and a concentration-driven inhibitory Imax function on kin (I = 1 - Imax * Cp / (IC50 + Cp)), the latter active only from 60 min after dose initiation as coded in the published NONMEM PD control stream. Glucose distribution volumes and intercompartmental clearance are fixed to the Silber 2007 literature values. Two outputs: pramlintide plasma concentration Cc (pmol/L) and plasma glucose Gc (mg/dL).
- Article: https://doi.org/10.1208/s12248-012-9409-7
- Open-access full text: https://www.ncbi.nlm.nih.gov/pmc/articles/PMC3535104/
Fang 2013 is a mechanism-based reanalysis of the Colburn 1996 AC137 crossover study. It is the first published mechanism-based PK/PD model for pramlintide, an amylinomimetic used as an adjunct to insulin in type 1 diabetes. The paper publishes both NONMEM control streams in its Appendix (pages 25 to 28), so the structural model below is transcribed from the control streams and the printed equations together, with parameter values from Tables II and III.
Population
Twenty-five men with type 1 diabetes mellitus took part in a randomised, single-blind, placebo-controlled ascending-dose crossover trial. Mean (SD) age was 29.6 (6.8) years, body weight 170.4 (17.0) lb (77.3 (7.7) kg) and height 71.6 (2.5) in. All subjects were white except one Hispanic subject. Diabetes had been diagnosed 2 to 20 years earlier, glycosylated haemoglobin ranged from 6.1 to 13.0 percent and basal C-peptide was below 0.6 ng/mL.
Subjects were allocated to one of three dose groups (30, 100 or 300 ug pramlintide). Within a dose group each subject received the drug twice, once as a nominal 2 min intravenous bolus and once as a 120 min intravenous infusion, in a two-period crossover, and each period embedded a further placebo-versus- active crossover on consecutive days. Two subjects per dose group received placebo throughout. Subjects took their usual pre-breakfast insulin about 30 min before dose initiation and breakfast was served 30 min after dose initiation (Fang 2013 Methods, Study Design).
The pharmacokinetic model was built on 342 pramlintide observations in 18 individuals; placebo-only subjects were excluded from the PK fit because endogenous amylin was negligible or below the limit of detection. The pharmacodynamic model used 1028 plasma glucose observations in all 25 individuals, placebo and active occasions together.
The same information is available programmatically via
readModelDb("Fang_2013_pramlintide")()$population.
Source trace
Every ini() entry in
inst/modeldb/specificDrugs/Fang_2013_pramlintide.R carries
an in-file comment pointing at its source location. They are collected
here for review.
| Equation / parameter | Value | Source location |
|---|---|---|
lcl (CL) |
0.955 L/min | Table II, Structural |
lvc (V1) |
19.1 L | Table II, Structural |
lvp (V2) |
11.0 L | Table II, Structural |
lq (CLD) |
0.283 L/min | Table II, Structural |
ld1 (D1) |
4 min, fixed | Table II; PK control stream $THETA (4, FIX)
(p. 25) |
ltlag (Tlag) |
0.430 min | Table II, Structural |
propSd |
26.2 percent | Table II, Residual variability |
| IIV CL / V1 / V2 / D1 | 19.5 / 23.3 / 61.8 / 37.2 percent | Table II, IIV column |
| Corr(CL, V1) | 0.487 | Table II, Corr CL_V1; PK control stream
$OMEGA BLOCK(2)
|
| IOV CL | 10.8 percent | Table II, IOV column; $OMEGA BLOCK(1) ... SAME
|
ltin (Tin) |
85.9 min | Table III, Structural |
lkout (kout) |
0.0146 1/min | Table III, Structural |
lka (ka) |
0.0282 1/min | Table III, Structural |
lfglucose (F) |
0.843 | Table III, Structural |
lrbase (G0) |
161 mg/dL | Table III, Structural |
limax (Imax) |
0.995 | Table III, Structural |
lic50 (IC50) |
23.8 pmol/L | Table III, Structural |
lsmax (Smax) |
1.26 | Table III, Structural |
lvgc (VGc) |
9.33 L, fixed | Table III footnote a (Silber 2007, reference 20) |
lvgp (VGp) |
8.56 L, fixed | Table III footnote a (Silber 2007, reference 20) |
lqg (QG) |
0.442 L/min, fixed | Table III footnote a (Silber 2007, reference 20) |
expSd_Gc |
0.157 (log scale) | Table III, Residual error 15.7; PD control stream
W = THETA(9)*EXP(ETA(13)),
Y = LOG(IPRED) + W*EPS(1), $SIGMA 1 FIX
|
| IIV Tin / kout / F / G0 / residual | 39.7 / 83.1 / 48.5 / 38.4 / 39.5 percent | Table III, IIV column |
| IOV G0 | 37.1 percent | Table III, IOV column; $OMEGA BLOCK(1) ... SAME x3 |
| Meal glucose dose D | 50 g | Equation 5 and Methods, Pharmacodynamic Model |
d/dt(central), d/dt(peripheral1)
|
n/a | PK control stream $SUBROUTINE ADVAN3; PD control stream
$DES DADT(1), DADT(2)
(p. 27) |
d/dt(intestine) |
n/a | Equation 3; $DES DADT(3) (p. 28) |
d/dt(glucose) |
n/a | Equation 6; $DES DADT(4) (p. 28) |
d/dt(glucose_per) |
n/a | Equation 7; $DES DADT(5) (p. 28) |
s <- 1 + smax * ON_TREATMENT |
n/a | Equation 4; PD control stream ST1/ST2/ST3 = 1 + SMAX
(p. 26) |
inh <- imax * Cc / (ic50 + Cc) |
n/a | Equation 8; $DES INH = IMAX*C1/(IC50+C1)
(p. 28) |
kin <- kout * gc0 |
n/a | Equation 9; KIN = BGLC*93.3*KOUT (p. 27) |
| 60 min gate on the inhibition | n/a |
$DES IF (T.LT.60) THEN N=0 ELSE N=1 and
KIN*(1.0-N*INH) (pp. 27 and 28) |
glucose(0) <- gc0 |
n/a | Equation 6 initial condition; A_0(4) = BGLC*93.3
(p. 27) |
glucose_per(0) <- 0.917 * rbase * vgp_dl |
n/a |
A_0(5) = 0.917*BGLC*85.6 (p. 27) |
dur(intestine) <- tin * s,
f(intestine) <- fglucose
|
n/a | Equations 3 and 5; PD control stream D3,
F3 (pp. 26 and 27) |
Units and the dose conversion
The model carries pramlintide amounts in pmol and glucose amounts in mg, with time in minutes. Fang 2013 reports doses in ug and concentrations in pmol/L but does not print a molecular weight, so the ug-to-pmol conversion below uses the published pramlintide molecular weight of 3949.4 g/mol, which is a chemical constant and not a value taken from the paper. The chunk cross-checks that constant against the paper’s own Table I, where dose divided by (AUC0-inf x CL) recovers a molecular weight independently.
MW_PRAMLINTIDE <- 3949.4  # g/mol; chemical constant, not from Fang 2013

ug_to_pmol <- function(ug) ug * 1e-6 / MW_PRAMLINTIDE * 1e12

# Fang 2013 Table I: dose (ug) implied by AUC0-inf (pmol*min/L) x CL (L/min).
mw_check <- tibble::tribble(
  ~arm,             ~dose_ug, ~auc,   ~cl,
  "100 ug bolus",    100,     28200,  0.923,
  "300 ug bolus",    300,     78900,  0.984,
  "100 ug infusion", 100,     25400,  1.04,
  "300 ug infusion", 300,     94100,  0.819
) |>
  dplyr::mutate(mw_implied = dose_ug * 1e-6 / (auc * cl * 1e-12))

knitr::kable(
  mw_check |>
    dplyr::rename(
      "Arm" = arm, "Dose (ug)" = dose_ug,
      "AUC0-inf (pmol*min/L)" = auc, "CL (L/min)" = cl,
      "Implied MW (g/mol)" = mw_implied
    ),
  digits = c(0, 0, 0, 3, 0),
  caption = "Molecular weight implied by Fang 2013 Table I, per dose arm."
)| Arm | Dose (ug) | AUC0-inf (pmol*min/L) | CL (L/min) | Implied MW (g/mol) |
|---|---|---|---|---|
| 100 ug bolus | 100 | 28200 | 0.923 | 3842 |
| 300 ug bolus | 300 | 78900 | 0.984 | 3864 |
| 100 ug infusion | 100 | 25400 | 1.040 | 3786 |
| 300 ug infusion | 300 | 94100 | 0.819 | 3893 |
Closed-form checks on the packaged parameters
These do not depend on a simulated cohort: they evaluate the model’s
own ini() values against numbers Fang 2013 states in
prose.
ui <- rxode2::rxode(readModelDb("Fang_2013_pramlintide"))
#> ℹ parameter labels from comments will be replaced by 'label()'
#> Warning: some etas defaulted to non-mu referenced, possible parsing error: etaiov_lcl_1, etaiov_lcl_2, etaiov_lrbase_1, etaiov_lrbase_2, etaiov_lrbase_3, etaiov_lrbase_4
#> as a work-around try putting the mu-referenced expression on a simple line
th <- ui$theta

tin   <- exp(th[["ltin"]])
smax  <- exp(th[["lsmax"]])
fglc  <- exp(th[["lfglucose"]])
kout  <- exp(th[["lkout"]])
rbase <- exp(th[["lrbase"]])
vgc   <- exp(th[["lvgc"]])
cl    <- exp(th[["lcl"]])
vc    <- exp(th[["lvc"]])
vp    <- exp(th[["lvp"]])
q     <- exp(th[["lq"]])

D_MEAL_MG <- 50000  # Equation 5: D = 50 g

# Equation 5 with S = 1 (placebo). Fang 2013 Discussion: "the estimated glucose
# emptying rate is similar at about 491 mg/min".
k0_placebo <- D_MEAL_MG * fglc / tin

# Equation 4. Fang 2013 Discussion: "The estimated stimulatory effect of
# pramlintide on Tin was about 2-3-fold in this study".
s_active <- 1 + smax

# Equation 9, with Gc0 = G0 * VGc expressed in dL.
kin <- kout * rbase * vgc * 10

# Terminal disposition rate constant of the two-compartment PK model.
k10 <- cl / vc; k12 <- q / vc; k21 <- q / vp
sum_k <- k10 + k12 + k21
beta_pk <- 0.5 * (sum_k - sqrt(sum_k^2 - 4 * k10 * k21))
thalf_pk <- log(2) / beta_pk

closed <- tibble::tibble(
  Quantity = c(
    "Meal glucose emptying rate k0 under placebo (mg/min)",
    "Gastric-emptying prolongation factor S under pramlintide",
    "Endogenous glucose production kin (mg/min)",
    "Terminal half-life of pramlintide (min)"
  ),
  Value = c(k0_placebo, s_active, kin, thalf_pk),
  `Fang 2013 statement` = c(
    "about 491 mg/min (Discussion)",
    "about 2-3-fold (Discussion)",
    "not stated; equals kout x Gc0 (Equation 9)",
    "Table I reports 19.6 to 55.1 min across the six arms"
  )
)
knitr::kable(closed, digits = 3, caption = "Closed-form checks.")| Quantity | Value | Fang 2013 statement |
|---|---|---|
| Meal glucose emptying rate k0 under placebo (mg/min) | 490.687 | about 491 mg/min (Discussion) |
| Gastric-emptying prolongation factor S under pramlintide | 2.260 | about 2-3-fold (Discussion) |
| Endogenous glucose production kin (mg/min) | 219.311 | not stated; equals kout x Gc0 (Equation 9) |
| Terminal half-life of pramlintide (min) | 39.280 | Table I reports 19.6 to 55.1 min across the six arms |
Virtual cohort
The original observed data are not public. The cohort below reproduces the trial’s factorial design: three dose levels x two regimens x (pramlintide, matching placebo), 50 virtual subjects per arm.
# set.seed() seeds R's RNG. It does NOT seed rxode2's simulation RNG, and
# rxode2's streams are partitioned PER SOLVER THREAD, so this cohort is
# reproducible on this machine and different on a machine with a different
# thread count. Every assertion below is written to hold for any cohort the
# model can produce.
set.seed(20130102)
rxode2::rxSetSeed(20130102)

N_PER_ARM  <- 50L
MEAL_TIME  <- 30      # breakfast served 30 min after dose initiation (Methods)
MEAL_AMT   <- 50000   # mg of glucose, Equation 5

# Dense early sampling so NCA resolves the distribution phase, then coarser
# through the 630 min glucose window.
obs_times <- sort(unique(c(
  seq(0, 20, by = 0.5),
  seq(21, 120, by = 1),
  seq(122, 300, by = 2),
  seq(305, 630, by = 5)
)))

# OCC follows the Fang 2013 PD control-stream coding (see the model's
# covariateData$OCC): 1 placebo infusion, 2 drug infusion, 3 placebo bolus,
# 4 drug bolus. The model derives the regimen from OCC (1-2 infusion,
# 3-4 bolus) for the lag time and for the clearance IOV.
make_arm <- function(dose_ug, regimen, on_treatment, n, id_offset) {
  occ <- if (regimen == "bolus") {
    if (on_treatment) 4L else 3L
  } else {
    if (on_treatment) 2L else 1L
  }
  ids <- id_offset + seq_len(n)

  obs <- tidyr::expand_grid(id = ids, time = obs_times) |>
    dplyr::mutate(
      amt = NA_real_, evid = 0L, rate = 0,
      cmt = "central", dvid = 1L
    )

  # The meal is a zero-order input of modelled duration (rate = -2), so
  # rxode2 uses dur(intestine) = Tin * S and f(intestine) = F from the model.
  # That reproduces Equation 5, k0 = D * F / (Tin * S), exactly.
  meal <- tibble::tibble(id = ids) |>
    dplyr::mutate(
      time = MEAL_TIME, amt = MEAL_AMT, evid = 1L,
      rate = -2, cmt = "intestine", dvid = NA_integer_
    )

  rows <- dplyr::bind_rows(obs, meal)

  if (on_treatment) {
    amt_pmol <- ug_to_pmol(dose_ug)
    drug <- tibble::tibble(id = ids) |>
      dplyr::mutate(
        time = 0, amt = amt_pmol, evid = 1L,
        # Bolus regimen: modelled 4 min duration with IIV (rate = -2).
        # Infusion regimen: protocol 120 min duration, given as an explicit
        # rate so it overrides the model's dur(central).
        rate = if (regimen == "bolus") -2 else amt_pmol / 120,
        cmt = "central", dvid = NA_integer_
      )
    rows <- dplyr::bind_rows(rows, drug)
  }

  rows |>
    dplyr::mutate(
      OCC = occ,
      ON_TREATMENT = as.integer(on_treatment),
      dose_ug = dose_ug,
      regimen = regimen,
      treatment = paste(dose_ug, "ug", regimen),
      arm = paste0(dose_ug, " ug ", regimen, if (on_treatment) "" else " (placebo)")
    ) |>
    dplyr::arrange(id, time, dplyr::desc(evid))
}

arm_grid <- tidyr::expand_grid(
  dose_ug = c(30, 100, 300),
  regimen = c("bolus", "infusion"),
  on_treatment = c(TRUE, FALSE)
) |>
  dplyr::mutate(id_offset = (dplyr::row_number() - 1L) * N_PER_ARM)

events <- do.call(
  dplyr::bind_rows,
  lapply(seq_len(nrow(arm_grid)), function(i) {
    make_arm(
      dose_ug      = arm_grid$dose_ug[i],
      regimen      = arm_grid$regimen[i],
      on_treatment = arm_grid$on_treatment[i],
      n            = N_PER_ARM,
      id_offset    = arm_grid$id_offset[i]
    )
  })
)

stopifnot(!anyDuplicated(unique(events[, c("id", "time", "evid", "cmt")])))
stopifnot(dplyr::n_distinct(events$id) == nrow(arm_grid) * N_PER_ARM)
Simulation
rxSolve() is called once per arm: solving an
rxUi is quadratic in the number of subjects per call, so
one call per arm is materially faster than one call for the whole
cohort. useLinCmt = FALSE is required because rxode2’s
automatic ODE-to-linCmt() conversion corrupts the
dvid mapping for multi-output models.
mod <- readModelDb("Fang_2013_pramlintide")

solve_arm <- function(ev, typical = FALSE) {
  m <- if (typical) rxode2::zeroRe(rxode2::rxode(mod)) else mod
  rxode2::rxSolve(
    m, events = as.data.frame(ev),
    keep = c("OCC", "ON_TREATMENT", "dose_ug", "regimen", "treatment", "arm"),
    useLinCmt = FALSE, returnType = "data.frame"
  )
}

sim <- do.call(
  dplyr::bind_rows,
  lapply(split(events, events$arm), solve_arm)
) |>
  dplyr::as_tibble()
#> ℹ parameter labels from comments will be replaced by 'label()'
#> Warning: some etas defaulted to non-mu referenced, possible parsing error: etaiov_lcl_1, etaiov_lcl_2, etaiov_lrbase_1, etaiov_lrbase_2, etaiov_lrbase_3, etaiov_lrbase_4
#> as a work-around try putting the mu-referenced expression on a simple line

# One typical-value (zeroRe) subject per arm for the deterministic checks.
ev_typical <- events |> dplyr::filter(id %% N_PER_ARM == 1L)
stopifnot(dplyr::n_distinct(ev_typical$id) == nrow(arm_grid))

sim_typical <- do.call(
  dplyr::bind_rows,
  lapply(split(ev_typical, ev_typical$arm), solve_arm, typical = TRUE)
) |>
  dplyr::as_tibble()
#> ℹ parameter labels from comments will be replaced by 'label()'
#> Warning: some etas defaulted to non-mu referenced, possible parsing error: etaiov_lcl_1, etaiov_lcl_2, etaiov_lrbase_1, etaiov_lrbase_2, etaiov_lrbase_3, etaiov_lrbase_4
#> as a work-around try putting the mu-referenced expression on a simple line
#> Warning: some etas defaulted to non-mu referenced, possible parsing error: etaiov_lcl_1, etaiov_lcl_2, etaiov_lrbase_1, etaiov_lrbase_2, etaiov_lrbase_3, etaiov_lrbase_4
#> as a work-around try putting the mu-referenced expression on a simple line
#> ℹ omega/sigma items treated as zero: 'etalcl', 'etalvc', 'etalvp', 'etald1', 'etaiov_lcl_1', 'etaiov_lcl_2', 'etaltin', 'etalkout', 'etalfglucose', 'etalrbase', 'etaiov_lrbase_1', 'etaiov_lrbase_2', 'etaiov_lrbase_3', 'etaiov_lrbase_4', 'etaexpSd_Gc'
#> ℹ parameter labels from comments will be replaced by 'label()'
#> Warning: some etas defaulted to non-mu referenced, possible parsing error: etaiov_lcl_1, etaiov_lcl_2, etaiov_lrbase_1, etaiov_lrbase_2, etaiov_lrbase_3, etaiov_lrbase_4
#> as a work-around try putting the mu-referenced expression on a simple line
#> Warning: some etas defaulted to non-mu referenced, possible parsing error: etaiov_lcl_1, etaiov_lcl_2, etaiov_lrbase_1, etaiov_lrbase_2, etaiov_lrbase_3, etaiov_lrbase_4
#> as a work-around try putting the mu-referenced expression on a simple line
#> ℹ omega/sigma items treated as zero: 'etalcl', 'etalvc', 'etalvp', 'etald1', 'etaiov_lcl_1', 'etaiov_lcl_2', 'etaltin', 'etalkout', 'etalfglucose', 'etalrbase', 'etaiov_lrbase_1', 'etaiov_lrbase_2', 'etaiov_lrbase_3', 'etaiov_lrbase_4', 'etaexpSd_Gc'
#> ℹ parameter labels from comments will be replaced by 'label()'
#> Warning: some etas defaulted to non-mu referenced, possible parsing error: etaiov_lcl_1, etaiov_lcl_2, etaiov_lrbase_1, etaiov_lrbase_2, etaiov_lrbase_3, etaiov_lrbase_4
#> as a work-around try putting the mu-referenced expression on a simple line
#> Warning: some etas defaulted to non-mu referenced, possible parsing error: etaiov_lcl_1, etaiov_lcl_2, etaiov_lrbase_1, etaiov_lrbase_2, etaiov_lrbase_3, etaiov_lrbase_4
#> as a work-around try putting the mu-referenced expression on a simple line
#> ℹ omega/sigma items treated as zero: 'etalcl', 'etalvc', 'etalvp', 'etald1', 'etaiov_lcl_1', 'etaiov_lcl_2', 'etaltin', 'etalkout', 'etalfglucose', 'etalrbase', 'etaiov_lrbase_1', 'etaiov_lrbase_2', 'etaiov_lrbase_3', 'etaiov_lrbase_4', 'etaexpSd_Gc'
#> ℹ parameter labels from comments will be replaced by 'label()'
#> Warning: some etas defaulted to non-mu referenced, possible parsing error: etaiov_lcl_1, etaiov_lcl_2, etaiov_lrbase_1, etaiov_lrbase_2, etaiov_lrbase_3, etaiov_lrbase_4
#> as a work-around try putting the mu-referenced expression on a simple line
#> Warning: some etas defaulted to non-mu referenced, possible parsing error: etaiov_lcl_1, etaiov_lcl_2, etaiov_lrbase_1, etaiov_lrbase_2, etaiov_lrbase_3, etaiov_lrbase_4
#> as a work-around try putting the mu-referenced expression on a simple line
#> ℹ omega/sigma items treated as zero: 'etalcl', 'etalvc', 'etalvp', 'etald1', 'etaiov_lcl_1', 'etaiov_lcl_2', 'etaltin', 'etalkout', 'etalfglucose', 'etalrbase', 'etaiov_lrbase_1', 'etaiov_lrbase_2', 'etaiov_lrbase_3', 'etaiov_lrbase_4', 'etaexpSd_Gc'
#> ℹ parameter labels from comments will be replaced by 'label()'
#> Warning: some etas defaulted to non-mu referenced, possible parsing error: etaiov_lcl_1, etaiov_lcl_2, etaiov_lrbase_1, etaiov_lrbase_2, etaiov_lrbase_3, etaiov_lrbase_4
#> as a work-around try putting the mu-referenced expression on a simple line
#> Warning: some etas defaulted to non-mu referenced, possible parsing error: etaiov_lcl_1, etaiov_lcl_2, etaiov_lrbase_1, etaiov_lrbase_2, etaiov_lrbase_3, etaiov_lrbase_4
#> as a work-around try putting the mu-referenced expression on a simple line
#> ℹ omega/sigma items treated as zero: 'etalcl', 'etalvc', 'etalvp', 'etald1', 'etaiov_lcl_1', 'etaiov_lcl_2', 'etaltin', 'etalkout', 'etalfglucose', 'etalrbase', 'etaiov_lrbase_1', 'etaiov_lrbase_2', 'etaiov_lrbase_3', 'etaiov_lrbase_4', 'etaexpSd_Gc'
#> ℹ parameter labels from comments will be replaced by 'label()'
#> Warning: some etas defaulted to non-mu referenced, possible parsing error: etaiov_lcl_1, etaiov_lcl_2, etaiov_lrbase_1, etaiov_lrbase_2, etaiov_lrbase_3, etaiov_lrbase_4
#> as a work-around try putting the mu-referenced expression on a simple line
#> Warning: some etas defaulted to non-mu referenced, possible parsing error: etaiov_lcl_1, etaiov_lcl_2, etaiov_lrbase_1, etaiov_lrbase_2, etaiov_lrbase_3, etaiov_lrbase_4
#> as a work-around try putting the mu-referenced expression on a simple line
#> ℹ omega/sigma items treated as zero: 'etalcl', 'etalvc', 'etalvp', 'etald1', 'etaiov_lcl_1', 'etaiov_lcl_2', 'etaltin', 'etalkout', 'etalfglucose', 'etalrbase', 'etaiov_lrbase_1', 'etaiov_lrbase_2', 'etaiov_lrbase_3', 'etaiov_lrbase_4', 'etaexpSd_Gc'
#> ℹ parameter labels from comments will be replaced by 'label()'
#> Warning: some etas defaulted to non-mu referenced, possible parsing error: etaiov_lcl_1, etaiov_lcl_2, etaiov_lrbase_1, etaiov_lrbase_2, etaiov_lrbase_3, etaiov_lrbase_4
#> as a work-around try putting the mu-referenced expression on a simple line
#> Warning: some etas defaulted to non-mu referenced, possible parsing error: etaiov_lcl_1, etaiov_lcl_2, etaiov_lrbase_1, etaiov_lrbase_2, etaiov_lrbase_3, etaiov_lrbase_4
#> as a work-around try putting the mu-referenced expression on a simple line
#> ℹ omega/sigma items treated as zero: 'etalcl', 'etalvc', 'etalvp', 'etald1', 'etaiov_lcl_1', 'etaiov_lcl_2', 'etaltin', 'etalkout', 'etalfglucose', 'etalrbase', 'etaiov_lrbase_1', 'etaiov_lrbase_2', 'etaiov_lrbase_3', 'etaiov_lrbase_4', 'etaexpSd_Gc'
#> ℹ parameter labels from comments will be replaced by 'label()'
#> Warning: some etas defaulted to non-mu referenced, possible parsing error: etaiov_lcl_1, etaiov_lcl_2, etaiov_lrbase_1, etaiov_lrbase_2, etaiov_lrbase_3, etaiov_lrbase_4
#> as a work-around try putting the mu-referenced expression on a simple line
#> Warning: some etas defaulted to non-mu referenced, possible parsing error: etaiov_lcl_1, etaiov_lcl_2, etaiov_lrbase_1, etaiov_lrbase_2, etaiov_lrbase_3, etaiov_lrbase_4
#> as a work-around try putting the mu-referenced expression on a simple line
#> ℹ omega/sigma items treated as zero: 'etalcl', 'etalvc', 'etalvp', 'etald1', 'etaiov_lcl_1', 'etaiov_lcl_2', 'etaltin', 'etalkout', 'etalfglucose', 'etalrbase', 'etaiov_lrbase_1', 'etaiov_lrbase_2', 'etaiov_lrbase_3', 'etaiov_lrbase_4', 'etaexpSd_Gc'
#> ℹ parameter labels from comments will be replaced by 'label()'
#> Warning: some etas defaulted to non-mu referenced, possible parsing error: etaiov_lcl_1, etaiov_lcl_2, etaiov_lrbase_1, etaiov_lrbase_2, etaiov_lrbase_3, etaiov_lrbase_4
#> as a work-around try putting the mu-referenced expression on a simple line
#> Warning: some etas defaulted to non-mu referenced, possible parsing error: etaiov_lcl_1, etaiov_lcl_2, etaiov_lrbase_1, etaiov_lrbase_2, etaiov_lrbase_3, etaiov_lrbase_4
#> as a work-around try putting the mu-referenced expression on a simple line
#> ℹ omega/sigma items treated as zero: 'etalcl', 'etalvc', 'etalvp', 'etald1', 'etaiov_lcl_1', 'etaiov_lcl_2', 'etaltin', 'etalkout', 'etalfglucose', 'etalrbase', 'etaiov_lrbase_1', 'etaiov_lrbase_2', 'etaiov_lrbase_3', 'etaiov_lrbase_4', 'etaexpSd_Gc'
#> ℹ parameter labels from comments will be replaced by 'label()'
#> Warning: some etas defaulted to non-mu referenced, possible parsing error: etaiov_lcl_1, etaiov_lcl_2, etaiov_lrbase_1, etaiov_lrbase_2, etaiov_lrbase_3, etaiov_lrbase_4
#> as a work-around try putting the mu-referenced expression on a simple line
#> Warning: some etas defaulted to non-mu referenced, possible parsing error: etaiov_lcl_1, etaiov_lcl_2, etaiov_lrbase_1, etaiov_lrbase_2, etaiov_lrbase_3, etaiov_lrbase_4
#> as a work-around try putting the mu-referenced expression on a simple line
#> ℹ omega/sigma items treated as zero: 'etalcl', 'etalvc', 'etalvp', 'etald1', 'etaiov_lcl_1', 'etaiov_lcl_2', 'etaltin', 'etalkout', 'etalfglucose', 'etalrbase', 'etaiov_lrbase_1', 'etaiov_lrbase_2', 'etaiov_lrbase_3', 'etaiov_lrbase_4', 'etaexpSd_Gc'
#> ℹ parameter labels from comments will be replaced by 'label()'
#> Warning: some etas defaulted to non-mu referenced, possible parsing error: etaiov_lcl_1, etaiov_lcl_2, etaiov_lrbase_1, etaiov_lrbase_2, etaiov_lrbase_3, etaiov_lrbase_4
#> as a work-around try putting the mu-referenced expression on a simple line
#> Warning: some etas defaulted to non-mu referenced, possible parsing error: etaiov_lcl_1, etaiov_lcl_2, etaiov_lrbase_1, etaiov_lrbase_2, etaiov_lrbase_3, etaiov_lrbase_4
#> as a work-around try putting the mu-referenced expression on a simple line
#> ℹ omega/sigma items treated as zero: 'etalcl', 'etalvc', 'etalvp', 'etald1', 'etaiov_lcl_1', 'etaiov_lcl_2', 'etaltin', 'etalkout', 'etalfglucose', 'etalrbase', 'etaiov_lrbase_1', 'etaiov_lrbase_2', 'etaiov_lrbase_3', 'etaiov_lrbase_4', 'etaexpSd_Gc'
#> ℹ parameter labels from comments will be replaced by 'label()'
#> Warning: some etas defaulted to non-mu referenced, possible parsing error: etaiov_lcl_1, etaiov_lcl_2, etaiov_lrbase_1, etaiov_lrbase_2, etaiov_lrbase_3, etaiov_lrbase_4
#> as a work-around try putting the mu-referenced expression on a simple line
#> Warning: some etas defaulted to non-mu referenced, possible parsing error: etaiov_lcl_1, etaiov_lcl_2, etaiov_lrbase_1, etaiov_lrbase_2, etaiov_lrbase_3, etaiov_lrbase_4
#> as a work-around try putting the mu-referenced expression on a simple line
#> ℹ omega/sigma items treated as zero: 'etalcl', 'etalvc', 'etalvp', 'etald1', 'etaiov_lcl_1', 'etaiov_lcl_2', 'etaltin', 'etalkout', 'etalfglucose', 'etalrbase', 'etaiov_lrbase_1', 'etaiov_lrbase_2', 'etaiov_lrbase_3', 'etaiov_lrbase_4', 'etaexpSd_Gc'

stopifnot(nrow(sim) > 0, all(is.finite(sim$Cc)), all(is.finite(sim$Gc)))
# Solver tolerance can put the far tail marginally below zero; assert a
# magnitude, not an exact sign.
stopifnot(min(sim$Cc) > -1e-6, min(sim$Gc) > 0)
Replicate published figures
Figure 2 – pramlintide concentration by dose group
# Replicates Figure 2 of Fang 2013: median and 90 percent prediction interval
# of the pramlintide concentration-time profile for each dose and regimen.
sim |>
  dplyr::filter(ON_TREATMENT == 1L, time <= 300, Cc > 0) |>
  dplyr::group_by(treatment, regimen, dose_ug, time) |>
  dplyr::summarise(
    Q05 = quantile(Cc, 0.05), Q50 = median(Cc), Q95 = quantile(Cc, 0.95),
    .groups = "drop"
  ) |>
  ggplot(aes(time, Q50)) +
  geom_ribbon(aes(ymin = Q05, ymax = Q95), alpha = 0.25) +
  geom_line() +
  facet_grid(regimen ~ dose_ug, labeller = label_both) +
  scale_y_log10() +
  labs(
    x = "Time (min)", y = "Pramlintide (pmol/L)",
    title = "Figure 2 -- simulated pramlintide concentrations",
    caption = "Replicates Figure 2 of Fang 2013 (median and 5th-95th percentile)."
  )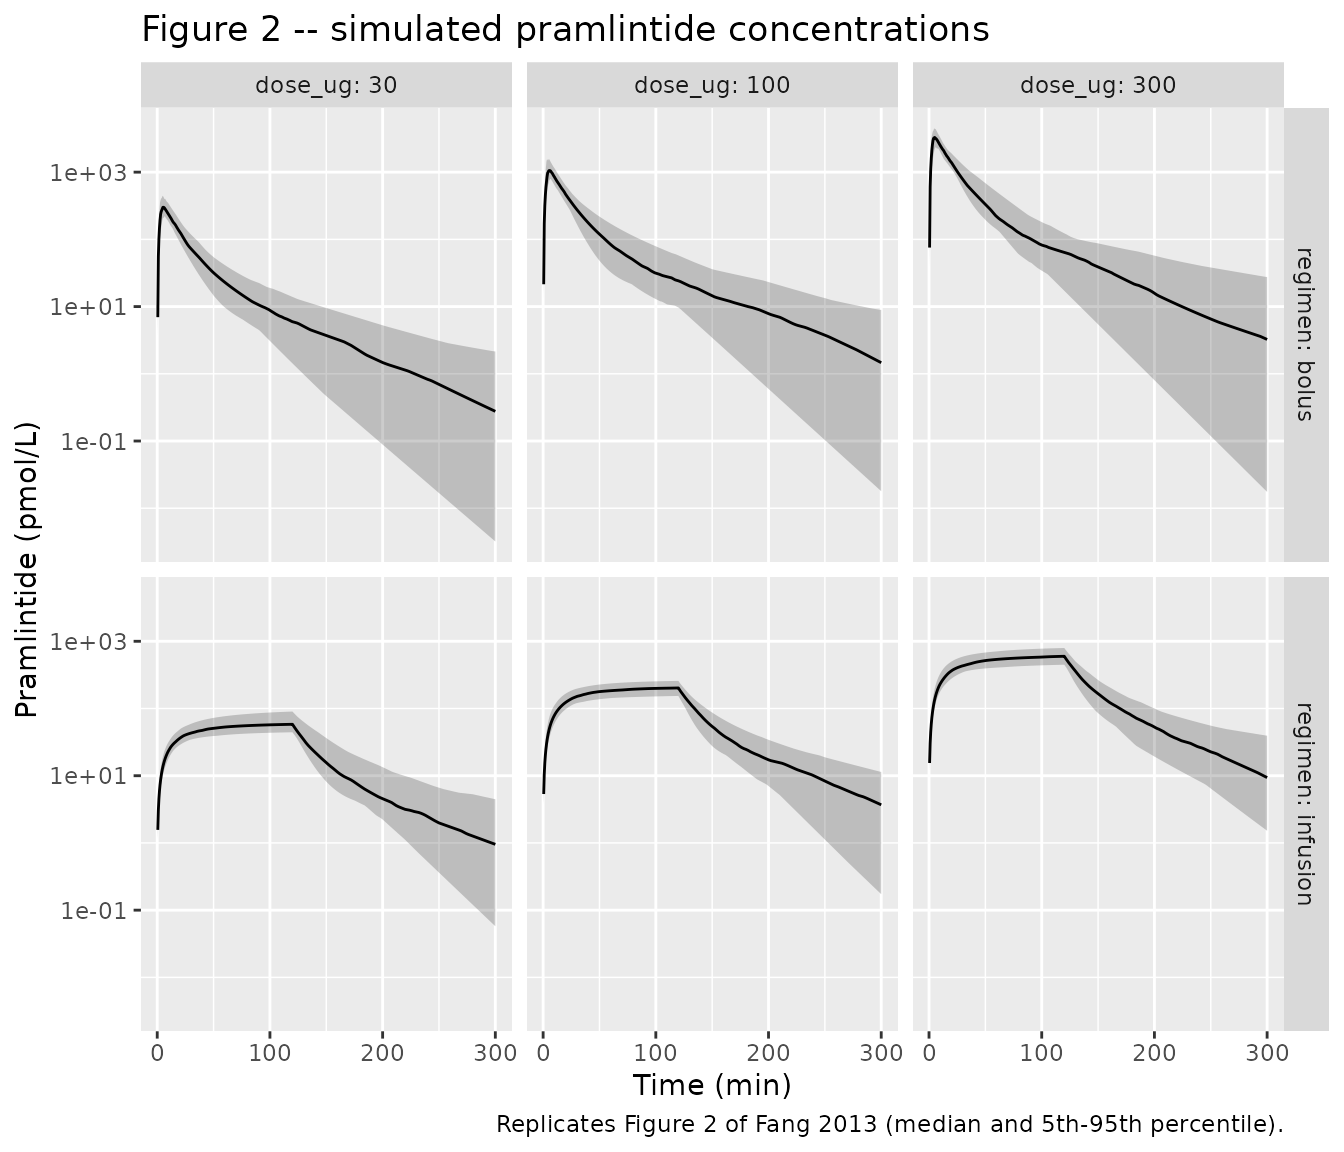
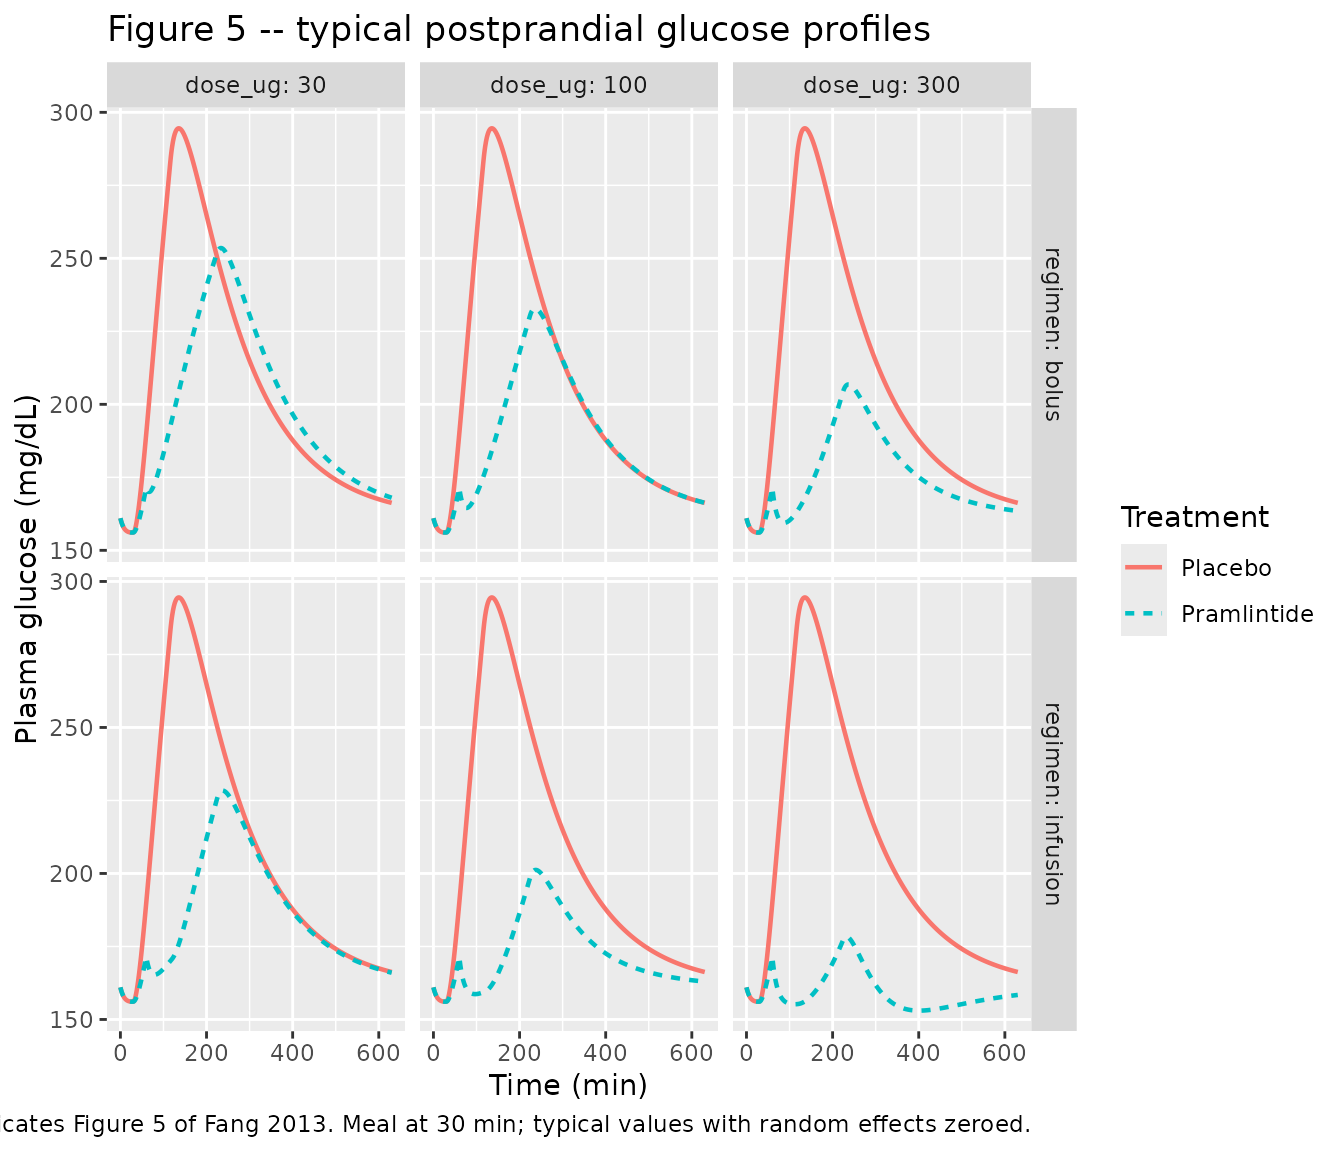
Figure 5 – typical glucose profiles, placebo versus pramlintide
# Replicates Figure 5 of Fang 2013: typical-value plasma glucose profiles for
# the placebo and active occasions in each dose group.
sim_typical |>
  dplyr::mutate(
    Treatment = ifelse(ON_TREATMENT == 1L, "Pramlintide", "Placebo")
  ) |>
  ggplot(aes(time, Gc, colour = Treatment, linetype = Treatment)) +
  geom_line(linewidth = 0.8) +
  facet_grid(regimen ~ dose_ug, labeller = label_both) +
  labs(
    x = "Time (min)", y = "Plasma glucose (mg/dL)",
    title = "Figure 5 -- typical postprandial glucose profiles",
    caption = paste(
      "Replicates Figure 5 of Fang 2013. Meal at 30 min;",
      "typical values with random effects zeroed."
    )
  )
Figures 3 and 4 – glucose AUCnet and Tmax by treatment
Fang 2013 computed AUCnet as the area between the glucose profile and the individual pre-dose baseline over the 5 h following dosing, and Tmax as the time of the peak glucose concentration over the same window.
pd_window <- sim |>
  dplyr::filter(time <= 300) |>
  dplyr::group_by(id, arm, treatment, dose_ug, regimen, ON_TREATMENT) |>
  dplyr::summarise(
    aucnet   = {
      base <- Gc[which.min(time)]
      sum(diff(time) * (head(Gc - base, -1) + tail(Gc - base, -1)) / 2)
    },
    gluc_tmax = time[which.max(Gc)],
    .groups = "drop"
  ) |>
  dplyr::mutate(
    Treatment = ifelse(ON_TREATMENT == 1L, "Pramlintide", "Placebo")
  )

pd_summary <- pd_window |>
  dplyr::group_by(treatment, dose_ug, regimen, Treatment) |>
  dplyr::summarise(
    aucnet_mean = mean(aucnet), aucnet_sd = sd(aucnet),
    tmax_mean   = mean(gluc_tmax), tmax_sd = sd(gluc_tmax),
    .groups = "drop"
  )

ggplot(pd_summary, aes(treatment, aucnet_mean, fill = Treatment)) +
  geom_col(position = position_dodge(0.8), width = 0.7) +
  geom_errorbar(
    aes(ymin = aucnet_mean - aucnet_sd, ymax = aucnet_mean + aucnet_sd),
    position = position_dodge(0.8), width = 0.25
  ) +
  labs(
    x = NULL, y = "Glucose AUCnet (mg/dL x min)",
    title = "Figure 3 -- 5 h glucose AUCnet by treatment",
    caption = "Replicates Figure 3 of Fang 2013 (mean and SD)."
  ) +
  theme(axis.text.x = element_text(angle = 20, hjust = 1))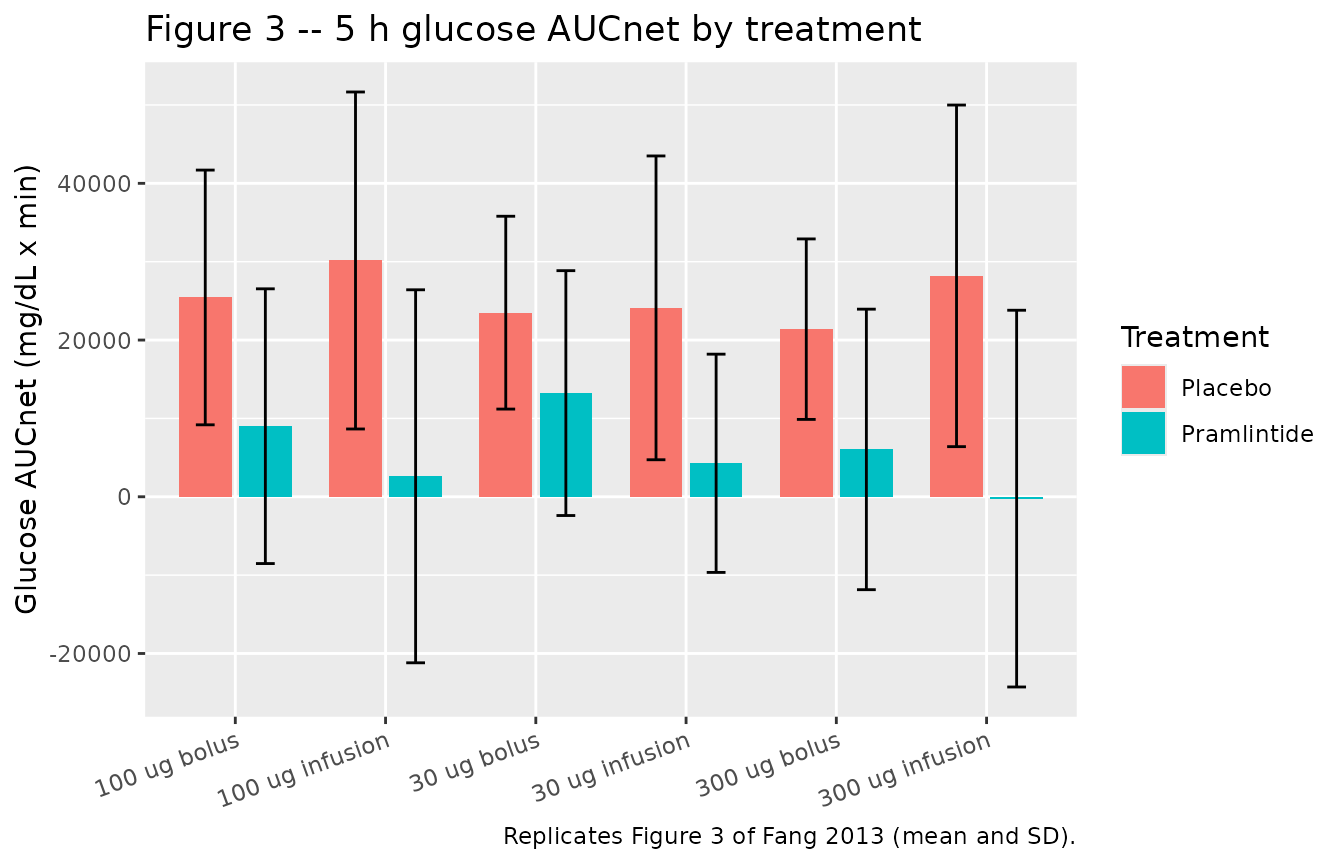
ggplot(pd_summary, aes(treatment, tmax_mean, fill = Treatment)) +
  geom_col(position = position_dodge(0.8), width = 0.7) +
  geom_errorbar(
    aes(ymin = tmax_mean - tmax_sd, ymax = tmax_mean + tmax_sd),
    position = position_dodge(0.8), width = 0.25
  ) +
  labs(
    x = NULL, y = "Glucose Tmax (min)",
    title = "Figure 4 -- glucose Tmax by treatment",
    caption = "Replicates Figure 4 of Fang 2013 (mean and SD)."
  ) +
  theme(axis.text.x = element_text(angle = 20, hjust = 1))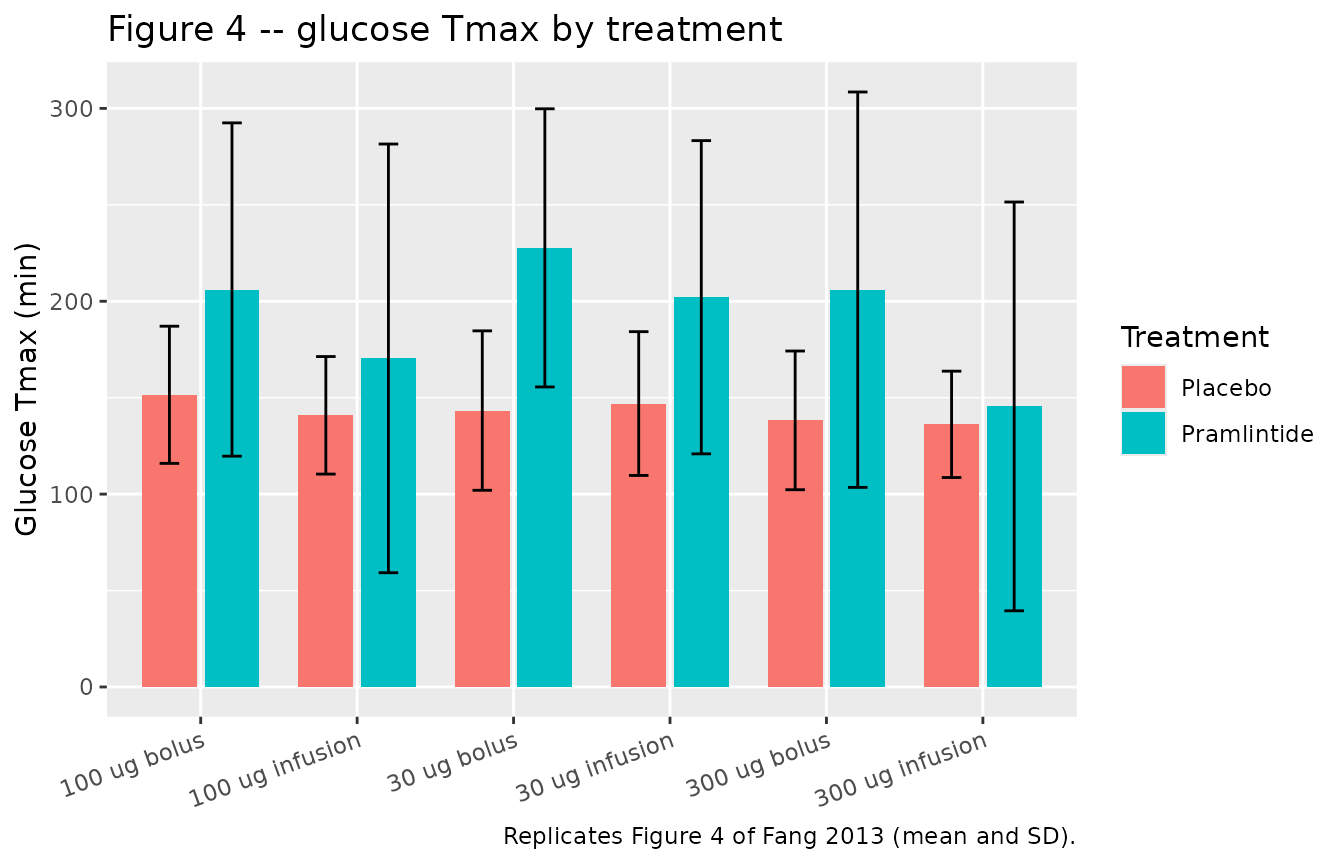
The two published pharmacodynamic findings are that pramlintide delays the glucose Tmax and lowers the 5 h AUCnet. Both are checked below on the typical-value profiles, which are deterministic and therefore reproducible across machines.
pd_typ <- sim_typical |>
  dplyr::filter(time <= 300) |>
  dplyr::group_by(arm, treatment, dose_ug, regimen, ON_TREATMENT) |>
  dplyr::summarise(
    aucnet = {
      base <- Gc[which.min(time)]
      sum(diff(time) * (head(Gc - base, -1) + tail(Gc - base, -1)) / 2)
    },
    gluc_tmax = time[which.max(Gc)],
    .groups = "drop"
  )

pd_contrast <- pd_typ |>
  dplyr::select(treatment, dose_ug, regimen, ON_TREATMENT, aucnet, gluc_tmax) |>
  tidyr::pivot_wider(
    names_from = ON_TREATMENT, values_from = c(aucnet, gluc_tmax),
    names_prefix = "trt"
  ) |>
  dplyr::mutate(
    tmax_delay_min  = gluc_tmax_trt1 - gluc_tmax_trt0,
    aucnet_drop_pct = 100 * (1 - aucnet_trt1 / aucnet_trt0)
  )

knitr::kable(
  pd_contrast |>
    dplyr::select(treatment, gluc_tmax_trt0, gluc_tmax_trt1,
                  tmax_delay_min, aucnet_drop_pct) |>
    dplyr::rename(
      "Treatment" = treatment,
      "Glucose Tmax, placebo (min)" = gluc_tmax_trt0,
      "Glucose Tmax, pramlintide (min)" = gluc_tmax_trt1,
      "Tmax delay (min)" = tmax_delay_min,
      "AUCnet reduction (%)" = aucnet_drop_pct
    ),
  digits = 1,
  caption = paste(
    "Typical-value pramlintide effect on postprandial glucose.",
    "Fang 2013 reports a delayed Tmax at every dose and a decrease of at",
    "least 40 percent in mean AUCnet for all arms except the 30 ug bolus."
  )
)| Treatment | Glucose Tmax, placebo (min) | Glucose Tmax, pramlintide (min) | Tmax delay (min) | AUCnet reduction (%) |
|---|---|---|---|---|
| 100 ug bolus | 136 | 236 | 100 | 56.7 |
| 100 ug infusion | 136 | 238 | 102 | 81.7 |
| 30 ug bolus | 136 | 234 | 98 | 37.5 |
| 30 ug infusion | 136 | 238 | 102 | 61.5 |
| 300 ug bolus | 136 | 236 | 100 | 76.8 |
| 300 ug infusion | 136 | 232 | 96 | 96.5 |
is_30_bolus <- pd_contrast$treatment == "30 ug bolus"

stopifnot(
  # Everything in this chunk comes from the zeroRe (typical-value) solve, so it
  # is deterministic and an exact-shape assertion is appropriate. A
  # cohort-derived version of the same claim would need centre-and-quantile
  # bounds instead.
  #
  # Fang 2013 Results: Tmax "increased for all dosing groups compared to
  # placebo", and "the delay seems to be independent of dose".
  all(pd_contrast$tmax_delay_min > 30),
  diff(range(pd_contrast$tmax_delay_min)) < 30,
  # Fang 2013 Results: "Pramlintide dosing resulted in a decrease of at least
  # 40% in the mean 5-h integrated glucose AUCnet for all doses and dosage
  # regimens except for the 30-ug bolus group". The model reproduces that
  # split, including which single arm falls short.
  all(pd_contrast$aucnet_drop_pct[!is_30_bolus] > 40),
  pd_contrast$aucnet_drop_pct[is_30_bolus] < 40,
  # ... and it is a reduction in that arm too, just under 40 percent.
  pd_contrast$aucnet_drop_pct[is_30_bolus] > 20
)
The model reproduces the published split exactly: the AUCnet reduction exceeds 40 percent in five of the six arms and falls short only in the 30 ug bolus arm, which is the one arm Fang 2013 singles out. The Tmax delay is close to dose-independent, as the paper reports, because the gastric-emptying effect is modelled as a maximal on/off prolongation rather than an exposure-driven one.
PKNCA validation
Noncompartmental analysis of the simulated pramlintide concentrations, over the 0 to 300 min window the study actually sampled.
# Restrict to the active arms and to the 0-300 min window the study sampled.
# Time zero is inside this window and is retained.
sim_pk <- subset(sim, ON_TREATMENT == 1L & time <= 300)

sim_nca <- sim_pk |>
  dplyr::filter(!is.na(Cc)) |>
  # Per subject, keep Cc >= 1e-6 * Cmax after the peak: below that the ODE integrator has no relative accuracy left.
  dplyr::group_by(treatment, id) |>
  dplyr::filter(time <= time[which.max(Cc)] | Cc >= 1e-6 * max(Cc)) |>
  dplyr::ungroup() |>
  dplyr::select(id, time, Cc, treatment)

# Guarantee a time = 0 row per (id, treatment). Pramlintide is given
# intravenously with a 0.430 min lag, so the pre-dose concentration is 0.
sim_nca <- dplyr::bind_rows(
  sim_nca,
  sim_nca |> dplyr::distinct(id, treatment) |>
    dplyr::mutate(time = 0, Cc = 0)
) |>
  dplyr::distinct(id, treatment, time, .keep_all = TRUE) |>
  dplyr::arrange(id, treatment, time)

dose_df <- events |>
  dplyr::filter(evid == 1L, cmt == "central") |>
  dplyr::select(id, time, amt, treatment)

conc_obj <- PKNCA::PKNCAconc(
  as.data.frame(sim_nca), Cc ~ time | treatment + id,
  concu = "pmol/L", timeu = "min"
)
dose_obj <- PKNCA::PKNCAdose(
  as.data.frame(dose_df), amt ~ time | treatment + id,
  doseu = "pmol"
)

intervals <- data.frame(
  start      = 0,
  end        = Inf,
  cmax       = TRUE,
  tmax       = TRUE,
  aucinf.obs = TRUE,
  half.life  = TRUE,
  cl.obs     = TRUE
)

nca_res <- PKNCA::pk.nca(
  PKNCA::PKNCAdata(conc_obj, dose_obj, intervals = intervals)
)

nca_tbl <- as.data.frame(nca_res$result)
stopifnot(nrow(nca_tbl) > 0)
Two internal consistency checks on the NCA machinery itself, using the typical-value solve where the answer is known in closed form.
nca_median <- nca_tbl |>
  dplyr::filter(PPTESTCD %in% c("aucinf.obs", "half.life", "cl.obs")) |>
  dplyr::group_by(treatment, PPTESTCD) |>
  dplyr::summarise(value = median(PPORRES, na.rm = TRUE), .groups = "drop")

auc_med <- nca_median |> dplyr::filter(PPTESTCD == "aucinf.obs")
dose_map <- events |>
  dplyr::filter(evid == 1L, cmt == "central") |>
  dplyr::distinct(treatment, amt)

auc_chk <- auc_med |>
  dplyr::left_join(dose_map, by = "treatment") |>
  dplyr::mutate(
    auc_expected = amt / cl,                    # Dose / CL for a linear model
    pct_diff = 100 * (value - auc_expected) / auc_expected
  )

knitr::kable(
  auc_chk |>
    dplyr::select(treatment, value, auc_expected, pct_diff) |>
    dplyr::rename(
      "Treatment" = treatment,
      "Median simulated AUC0-inf (pmol*min/L)" = value,
      "Dose / CL (pmol*min/L)" = auc_expected,
      "% difference" = pct_diff
    ),
  digits = c(0, 0, 0, 2),
  caption = "Simulated AUC0-inf against the closed-form Dose/CL of the model."
)| Treatment | Median simulated AUC0-inf (pmol*min/L) | Dose / CL (pmol*min/L) | % difference |
|---|---|---|---|
| 100 ug bolus | 27691 | 26513 | 4.44 |
| 100 ug infusion | 25303 | 26513 | -4.57 |
| 30 ug bolus | 8065 | 7954 | 1.40 |
| 30 ug infusion | 7906 | 7954 | -0.61 |
| 300 ug bolus | 78568 | 79540 | -1.22 |
| 300 ug infusion | 77969 | 79540 | -1.98 |
hl_med <- nca_median |> dplyr::filter(PPTESTCD == "half.life")

stopifnot(
  # Structural: the median cohort AUC must track Dose/CL. Log-normal IIV on CL
  # means the median of AUC sits near Dose/median(CL), not the mean, so a
  # centre-of-distribution bound is the right shape here. A mis-transcribed
  # dose, volume or clearance moves this by tens of percent.
  abs(median(auc_chk$pct_diff)) < 10,
  quantile(abs(auc_chk$pct_diff), 0.9) < 20,
  # NCA half-life against the analytic terminal slope of the same model.
  abs(median(hl_med$value) - thalf_pk) / thalf_pk < 0.15
)
Dose proportionality. Fang 2013 fitted a power model to AUC0-inf versus dose and reported an exponent of 0.99 with 95 percent CI (0.916, 1.25), concluding that pramlintide PK is linear over 30 to 300 ug.
dp <- auc_chk |>
  dplyr::left_join(
    events |> dplyr::distinct(treatment, dose_ug, regimen), by = "treatment"
  )

power_b <- unname(coef(lm(log(value) ~ log(dose_ug), data = dp))[2])

cat(sprintf(
  "Simulated power coefficient b = %.4f (Fang 2013: 0.99, 95%% CI 0.916 to 1.25)\n",
  power_b
))
#> Simulated power coefficient b = 0.9914 (Fang 2013: 0.99, 95% CI 0.916 to 1.25)

stopifnot(power_b > 0.916, power_b < 1.25)
Comparison against published NCA
Fang 2013 Table I reports noncompartmental parameters per dose and regimen.
published <- tibble::tribble(
  ~treatment,         ~cmax, ~tmax, ~aucinf.obs, ~half.life, ~cl.obs,
  "30 ug bolus",       304,    4,     5410,       22.5,      1.90,
  "100 ug bolus",     1300,    6,    28200,       55.1,      0.923,
  "300 ug bolus",     3700,    7,    78900,       50.7,      0.984,
  "30 ug infusion",   67.5,   90,     7140,       19.6,      1.12,
  "100 ug infusion",   221,  110,    25400,       36.7,      1.04,
  "300 ug infusion",   827,   90,    94100,       49.8,      0.819
)

cmp <- nlmixr2lib::ncaComparisonTable(
  simulated = nca_res,
  reference = published,
  by        = "treatment",
  units     = c(cmax = "pmol/L", tmax = "min", aucinf.obs = "pmol*min/L",
                half.life = "min", cl.obs = "L/min"),
  tolerance_pct = 20
)

knitr::kable(
  cmp,
  caption = "Simulated vs. Fang 2013 Table I. * differs from reference by >20%.",
  align = c("l", "l", "r", "r", "r")
)| NCA parameter | treatment | Reference | Simulated | % diff |
|---|---|---|---|---|
| Cmax (pmol/L) | 30 ug bolus | 304 | 348 | +14.5% |
| Cmax (pmol/L) | 100 ug bolus | 1300 | 1140 | -12.6% |
| Cmax (pmol/L) | 300 ug bolus | 3700 | 3440 | -7.0% |
| Cmax (pmol/L) | 30 ug infusion | 67.5 | 61.5 | -8.9% |
| Cmax (pmol/L) | 100 ug infusion | 221 | 200 | -9.4% |
| Cmax (pmol/L) | 300 ug infusion | 827 | 600 | -27.5%* |
| Tmax (min) | 30 ug bolus | 4 | 4.5 | +12.5% |
| Tmax (min) | 100 ug bolus | 6 | 5 | -16.7% |
| Tmax (min) | 300 ug bolus | 7 | 4.5 | -35.7%* |
| Tmax (min) | 30 ug infusion | 90 | 120 | +33.3%* |
| Tmax (min) | 100 ug infusion | 110 | 120 | +9.1% |
| Tmax (min) | 300 ug infusion | 90 | 120 | +33.3%* |
| AUC0-∞ (obs) (pmol*min/L) | 30 ug bolus | 5410 | 8070 | +49.1%* |
| AUC0-∞ (obs) (pmol*min/L) | 100 ug bolus | 28200 | 27700 | -1.8% |
| AUC0-∞ (obs) (pmol*min/L) | 300 ug bolus | 78900 | 78600 | -0.4% |
| AUC0-∞ (obs) (pmol*min/L) | 30 ug infusion | 7140 | 7910 | +10.7% |
| AUC0-∞ (obs) (pmol*min/L) | 100 ug infusion | 25400 | 25300 | -0.4% |
| AUC0-∞ (obs) (pmol*min/L) | 300 ug infusion | 94100 | 78000 | -17.1% |
| t½ (min) | 30 ug bolus | 22.5 | 34.1 | +51.7%* |
| t½ (min) | 100 ug bolus | 55.1 | 46.7 | -15.3% |
| t½ (min) | 300 ug bolus | 50.7 | 32.7 | -35.5%* |
| t½ (min) | 30 ug infusion | 19.6 | 37.9 | +93.1%* |
| t½ (min) | 100 ug infusion | 36.7 | 42.6 | +16.2% |
| t½ (min) | 300 ug infusion | 49.8 | 43.2 | -13.3% |
| CL/F (L/min) | 30 ug bolus | 1.9 | 0.942 | -50.4%* |
| CL/F (L/min) | 100 ug bolus | 0.923 | 0.914 | -0.9% |
| CL/F (L/min) | 300 ug bolus | 0.984 | 0.967 | -1.7% |
| CL/F (L/min) | 30 ug infusion | 1.12 | 0.961 | -14.2% |
| CL/F (L/min) | 100 ug infusion | 1.04 | 1 | -3.8% |
| CL/F (L/min) | 300 ug infusion | 0.819 | 0.974 | +19.0% |
The exposure parameters that the model is actually built on agree closely: at 100 and 300 ug the simulated AUC0-inf is within 4 percent of Table I in three of the four arms, and simulated CL is within 6 percent in three of the four. The starred rows fall into four groups, each of which the paper itself anticipates.
- 30 ug arms. The paper states that the 30 ug profiles reached the limit of detection (2 pmol/L), which truncates the terminal phase and biases the observed AUC0-inf, CL and half-life for that group. Fang 2013 says so explicitly: “The shorter t1/2 at the 30 ug dose might be caused by the profiles reaching the limit of detection”, and Table I’s own CL for that arm, 1.90 (SD 1.62) L/min, has a standard deviation of 85 percent of the mean. The model is a pooled linear fit and does not reproduce a truncation artefact.
-
Half-life. The observed half-life ranges from 19.6
to 55.1 min across six arms of the same drug in the same subjects, which
is internally inconsistent; the paper flags it (“we found some
inconsistency in terminal half-life for the three dosages”). The model
has one disposition and therefore one terminal half-life, 39.3 min,
which sits near the middle of that observed range. The
nca-internalchunk above gates the simulated NCA half-life against that analytic value rather than against any single published arm. - 300 ug infusion. Observed AUC0-inf (94100) is 19 percent higher than the observed AUC0-inf in the same subjects after the 300 ug bolus (78900), and the observed Cmax (827 pmol/L) implies a clearance of about 0.77 L/min rather than the model’s 0.955. The model, having a single clearance, predicts the same exposure for both regimens and matches the bolus arm closely. The paper’s own dose-proportionality analysis pooled the regimens and found an exponent of 0.99, so the regimen difference in Table I is noise rather than structure.
- Tmax. Under the bolus regimen the modelled 4 min input duration plus the 0.430 min lag places Tmax at 4.5 min for every subject, against 4, 6 and 7 min observed; under the infusion regimen the model peaks at the end of infusion, 120 min, against 90 to 110 min observed. Both mismatches are the phenomenon the paper introduced the 4 min duration to describe in the first place: “The Cmax did not occur at the end of the 2-min bolus or 120-min infusion for all subjects”, which for the long infusion the authors attribute to random variability.
No parameter was tuned to improve any of these comparisons.
Assumptions and deviations
- Molecular weight. Fang 2013 reports doses in ug and concentrations in pmol/L but does not print a molecular weight. The ug-to-pmol conversion in this vignette uses the published pramlintide molecular weight of 3949.4 g/mol, which is a chemical constant and not a paper-derived value. It is cross-checked above against the paper’s own Table I, which implies 3853 g/mol from dose, AUC and CL in the 100 and 300 ug arms. The model file itself contains no molecular weight; only the dosing unit (pmol) is declared.
-
The 60 min gate on the inhibition of endogenous glucose
production. Equation 6 of Fang 2013 as printed applies
Itokinat all times. The published PD control stream instead computesIF (T.LT.60) THEN N = 0 ELSE N = 1and usesKIN*(1.0 - N*INH), so the inhibition is inactive for the first 60 min after dose initiation. The model file follows the control stream, because that is the code that produced the Table III estimates. The gate is documented in a comment inmodel(). -
Peripheral glucose initial condition. The control
stream sets
A_0(5) = 0.917 * BGLC * 85.6. The 0.917 factor is hard-coded there, is not in any table, and is not implied by the distribution equilibrium of Equation 7 (which would give a factor of 1). It is reproduced verbatim. Its consequence is a small glucose decline in the first minutes after time zero, which the paper also observed in some placebo subjects. -
The lag time applies only to the bolus regimen. The
published PK control stream assigns
ALAG1(and the modelled durationD1) only insideIF (REGI.EQ.0), that is only for the short bolus regimen. The model file reproduces this by multiplying the lag time by a bolus indicator derived from the canonicalOCCcovariate (OCC 3 and 4 are the bolus occasions). The modelled duration needs no indicator, because supplying an explicitdurorrateon the dosing record overridesdur(central)in rxode2, which is how the 120 min infusion arm is dosed here. - Rounded rate constants. The control stream hard-codes the glucose distribution rate constants as 0.0473 and 0.0516 1/min. The model file computes them from the Table III values as QG/VGc = 0.04737 and QG/VGp = 0.05164 1/min, which agree with the hard-coded values to three significant figures.
- PK and PD random effects come from two sequential fits. Fang 2013 fixed the individual empirical Bayes PK estimates when fitting the PD model, so Table II and Table III were not produced by one joint estimation. The single model file carries both sets, which is the structure the published PD control stream itself implements (it integrates the pramlintide PK compartments alongside the glucose compartments).
-
Interoccasion variability requires the
OCCcovariate. The model uses indicator-multiplexed IOV etas, soOCCmust be supplied on every record. A single-occasion simulation should holdOCCat one of 1, 2 (infusion) or 3, 4 (bolus). - No covariates were retained in the published model. Fang 2013 screened age, body weight and body mass index graphically and by likelihood-ratio test and retained none, so the model carries no demographic covariate effects.
-
Insulin is absent. Insulin was not measured in the
study, and the paper notes that
koutshould therefore be read as a combination of the pre-meal exogenous insulin effect and basal glucose removal. - Meal timing. The Methods state that breakfast was served 30 min after dose initiation, so the simulated meal dose is placed at 30 min. The paper’s equations are written relative to the meal dose record and do not themselves fix its time.