Imipenem popPK model review (Zhang 2025)
Source:vignettes/articles/Zhang_2025_imipenem_model_review.Rmd
Zhang_2025_imipenem_model_review.RmdModel and source
- Citation: Zhang P, Zhao Y, Zhu J, Yang Y, Liang G, Wang X, Yu Z. Population pharmacokinetics of imipenem in different populations for individualized dosing: a systematic review. Frontiers in Pharmacology 2025;16:1738055.
- Article: https://doi.org/10.3389/fphar.2025.1738055
- Supplement (Table S1, study protocols): https://www.frontiersin.org/articles/10.3389/fphar.2025.1738055/full#supplementary-material
This vignette is unusual for the package: its source is a secondary one. Zhang 2025 is a PRISMA-style systematic review that develops no model of its own. It catalogues 18 previously published imipenem population-PK models and tabulates, for each, the structural parameter estimates (Table 2), the inter-individual and residual variability (Table 2), the covariate screening and the final covariate equations (Table 3), and the dosing and sampling protocol (Supplementary Table S1).
Reviews are normally not transcribed; their primary publications are
extracted instead. That practice has an explicit exception for a review
that tabulates the parameters, and this one does:
Tables 2 and 3 together are enough to write down every differential
equation and initialise every ini() value for most of the
18 constituent models. So the models below are transcribed from the
review, each carrying a “re-verify against the primary” note in its
description and reference metadata.
Every model file in this family records
ALL PARAMETER VALUES ARE SECONDARY in its
population$notes, except those marked “re-verified against
primary” in the coverage table below, which have since been rewritten
from their primary publications and have their own articles (de Velde 2020, Nguyen 2021, Por 2021). Read the “Assumptions and
deviations” section at the foot of this page before using any of them;
it reports a measured audit of how faithfully the
review reproduces its primaries, and that audit found a real defect.
For example, deVelde_2020_imipenem has since been
re-verified against its primary publication. It is now documented,
together with the primary’s nonparametric arm
(deVelde_2020_imipenem_nonparametric), in its own de Velde 2020 article, and it no
longer carries the secondary-source notes. It still appears in the
tables below so that the review’s own numbers can be checked.
Coverage of the review’s 18 studies
Four of the review’s 18 studies were already in
nlmixr2lib, extracted directly from their primary
publications. Those were not re-extracted; they are
better provenance than anything this review can supply, and they serve
below as the validation set for the review’s own accuracy. Two studies
could not be reconstructed from the review alone. Nothing was silently
dropped.
| Study | Author (review’s citation) | Disposition | Model file |
|---|---|---|---|
| 1 | Ikawa et al. (2008) | Extracted | Ikawa_2008_imipenem |
| 2 | Lamoth et al. (2009) | Already in registry | Lamoth_2009_imipenem |
| 3 | Yoshizawa et al. (2013) | Extracted (2 files) | Yoshizawa_2013_imipenem_neonates / _children |
| 4 | Couffignal et al. (2014) | Already in registry | Couffignal_2014_imipenem |
| 5 | Li and Xie (2019) | Blocked: sieving coefficient unreported | NA |
| 6 | Dong et al. (2019) | Extracted | Dong_2019_imipenem |
| 7 | Li et al. (2020) | Blocked: dialysate-compartment role + Qd units | NA |
| 8 | Chen et al. (2020b) | Extracted | Chen_2020_imipenem |
| 9 | de Velde et al. (2020) | Re-verified against primary (2 files) | deVelde_2020_imipenem / _nonparametric |
| 10 | Nguyen et al. (2021) | Extracted; re-verified against primary | Nguyen_2021_imipenem |
| 11 | Jaruratanasirikul et al. (2021) | Extracted | Jaruratanasirikul_2021_imipenem |
| 12 | Por et al. (2021) | Extracted; re-verified against primary | Por_2021_imipenem |
| 13 | Dao et al. (2022) | Extracted | Dao_2022_imipenem |
| 14 | Dinh et al. (2022) | Extracted | Dinh_2022_imipenem |
| 15 | Bai et al. (2024) | Already in registry | Bai_2024_imipenem |
| 16 | Lafaurie et al. (2023) | Extracted (2 files) | Lafaurie_2023_imipenem_neutropenia / _recovery |
| 17 | Truong et al. (2025) | Extracted | Truong_2025_imipenem |
| 18 | Wang et al. (2024) | Already in registry | Wang_2024_imipenem |
14 model files extracted from 12 studies, 4 already covered from their primaries, 2 blocked. The two blocked studies are:
-
Li and Xie (2019) – a CRRT cohort whose total
clearance is
CL_CRRT + CL_body, withCL_CRRT = Sd x CRRTintensity x BW/1000. The sieving coefficientSdis never given a value by the review, and every patient in that study was on CRRT, so the extracorporeal arm is not optional. The review also cites this study inconsistently – Table 1 and Table 2 say “Li and Xie (2019)” while Supplementary Table S1 says “Li et al., 2018” – so the primary should be identified before re-extraction. -
Li et al. (2020) – a three-compartment CRRT model
whose third compartment is a dialysate space carrying its own volume
(0.012 L), its own intercompartmental clearance and its own assayed
effluent concentration. The package’s canonical
dialysatecompartment is defined as a cumulative collected amount, not a volume-bearing distribution compartment, so the role needs ratifying. Separately, the dialysate-flow covariateQdis centred on 500 with no unit stated; CRRT flows are prescribed in mL/h while the canonicalDFRcolumn is mL/min, and with an exponent of 1.944 a 60-fold unit error becomes a 2800-fold clearance error. Both questions turn on what the primary says, so this study is deferred until the primary (Clin Ther 2020;42(8):1564-1577.e8, doi:10.1016/j.clinthera.2020.06.010) is available, rather than shipped on a guessed unit.
Jaruratanasirikul et al. (2021) was previously blocked and is
now included. It needs an ABW (adjusted body
weight) covariate column, which the register did not carry –
WT, IBW, BMI, BSA
and FFM were registered, ABW was not – because
its central volume is V1 = 13.8 - 0.348 x (ABW - 60).
ABW was ratified as a canonical covariate column with this
extraction as its founding example; see
inst/references/covariate-columns.md. Its two source quirks
(a Table 2 central volume of 13.6 L against a Table 3 formula intercept
of 13.8 L, and a linear volume term that goes negative above 99.7 kg)
are recorded in the per-model deviations below.
Population
The review pools 18 studies from 10 countries published between 2008 and 2025, spanning neonates through the elderly. Sample sizes run from 10 patients (Ikawa 2008) to 247 (Chen 2020); only three studies enrolled more than 100. The study populations are predominantly critically ill adults, with specific cohorts for burns, intraabdominal infection, haematological malignancy, neutropenia, AECOPD, CRRT, ECMO, neonates and children.
Per-model demographics are in each file’s population
metadata; the table below collects the cohorts for the 14 models
extracted here from the review’s Table 1.
| Model | Country | N | Age | Weight (kg) | Patient group |
|---|---|---|---|---|---|
| Ikawa_2008_imipenem | Japan | 10 | 43.7 +/- 14.9 y | 56.7 +/- 10.5 | Intraabdominal infections |
| Yoshizawa_2013_imipenem_neonates | Japan | 60 | 10.5 +/- 8.3 d | 2.93 +/- 0.7 | Neonates |
| Yoshizawa_2013_imipenem_children | Japan | 39 | 9.61 +/- 3.16 y | 29.5 +/- 10.9 | Children |
| Dong_2019_imipenem | China | 56 | 4.86 +/- 2.33 y | 18.65 +/- 6.90 | Children, haematological malignancy |
| Chen_2020_imipenem | China | 247 | 67 (20-97) y | 65 (37.5-110) | Critically ill, +/- ECMO |
| deVelde_2020_imipenem | Switzerland | 26 | 51 (39-54) y | 75 (66-85) | Critically ill |
| Nguyen_2021_imipenem | Vietnam | 44 | 65 (60-72) y | 50 (47-55) | AECOPD |
| Jaruratanasirikul_2021_imipenem | Thailand | 50 | 56.2 (41-66.6) y | 62.9 (52.8-70) | Critically ill, +/- ECMO |
| Por_2021_imipenem | USA | 23 | 51-55 y | 89.6-105.1 | Burns, +/- CVVH |
| Dao_2022_imipenem | Switzerland | 82 | GA 26.9 wk, PNA 21 d | 1.16 (0.5-4.1) | Neonates (extremely preterm) |
| Dinh_2022_imipenem | Vietnam | 24 | 57.5 +/- 19.9 y | 51.3 +/- 8.6 | Critically ill |
| Lafaurie_2023_imipenem_neutropenia | France | 16 | 37 (18.3-78.3) y | 65.5 (48-101) | Neutropenic adults (during) |
| Lafaurie_2023_imipenem_recovery | France | 16 | 37 (18.3-78.3) y | 65.5 (48-101) | Neutropenic adults (recovered) |
| Truong_2025_imipenem | Netherlands | 151 | 63 (51-72) y | 70 (61.2-82) | Critically ill and non-critically ill |
Programmatic access, e.g.:
str(readModelDb("Dao_2022_imipenem")()$population[c("n_subjects", "ga_range", "weight_median")])
#> List of 3
#>  $ n_subjects   : int 82
#>  $ ga_range     : chr "24.2-41.3 weeks (median 26.9)"
#>  $ weight_median: chr "1.16 kg (range 0.5-4.1)"
Source trace
Every ini() value in every file carries an in-file
comment naming its origin. Because all 14 models share one secondary
source, the trace collapses to a single rule, stated here once and
repeated per parameter in the files:
| Quantity | Source location in Zhang 2025 |
|---|---|
| Structural typical values (CL, V1, V2, V3, Q, Q2, Q3, Ke, Kcp, Kpc) | Table 2, “Population typical value” column, the row for that study |
| Inter-individual variability | Table 2, “Inter-individual variability (IIV)” column |
| Residual variability (proportional, additive) | Table 2, “Residual variability (RV)” column |
| Covariate reference values and exponents | Table 3, “Formulation” column |
| Which covariates were screened but not retained | Table 3, “Covariates screened” vs “Covariates incorporated” |
| Covariate selection method and thresholds | Table 3, “Covariate analysis method” column |
| Demographics (N, age, weight, sex, country, design) | Table 1 |
| Dose, sampling schedule, bioanalytical assay | Supplementary Table S1 |
| Software and model-evaluation method | Table 2, last two columns |
The covariate equations transcribed from Table 3 are:
| Model | Covariate model (Zhang 2025 Table 3, verbatim) |
|---|---|
Ikawa_2008_imipenem |
none reported (“NR”) |
Yoshizawa_2013_imipenem_* |
per-kg parameters; no other covariate reported (“NR”) |
Dong_2019_imipenem |
CL = 8.6 x (BW/18)^0.75 x (age/4.69)^0.265 x (CLcr/214)^0.509;
V1 = 7.2 x (BW/18); V2 = 6.51 x (BW/18);
Q = 0.996 x (BW/18)^0.75
|
Chen_2020_imipenem |
CL = 8.88 x (CLcr/59.1)^0.295 x (BW/65.0)^0.306 x e^1.16 [ECMO] x e^eta |
deVelde_2020_imipenem |
Ke = 0.637 x ((eGFR CKD-EPI-abs)/119)^0.655 x e^eta |
Nguyen_2021_imipenem |
CL = 7.88 x (CLcr/75.54)^0.532 x e^eta |
Jaruratanasirikul_2021_imipenem |
CL = 13.3 + 0.112 x (eGFR CKD-EPI - 89);
V1 = 13.8 - 0.348 x (ABW - 60)
|
Por_2021_imipenem |
Vc = 32.67 x (BW/99.5)^0.74 x (ALB/2.7)^-1.17 x e^eta;
Vp = 41.23 x (ALB/2.7)^-3.68; no CVVH:
CL = 15.31 x (CLcr/145.83)^0.46 x (BW/99.5)^0.33 x e^eta;
with CVVH: CL = 13.78 x (BW/99.5)^0.75 x e^eta + 1.56
|
Dao_2022_imipenem |
CL = 0.21 x (BW/1.16)^0.75 x (1 + 0.22 x (PNA-21)/21) x (1 + 1.31 x (GA-26.9)/26.9) x (46.6/SCr)^0.2;
V = 0.73 x (BW/1.16)^0.75
|
Dinh_2022_imipenem |
CL = 4.79 x e^(0.00642 x CLcr) |
Lafaurie_2023_imipenem_* |
none reported (“NR”) |
Truong_2025_imipenem |
CL = 14.6 x (CLcr CG/87.6)^0.462 |
The Por_2021_imipenem row is the review’s rendering. The
primary publication (Por 2021 Equations 5 and 11, Table 1) shows that
the “+ 1.56” is the cohort-mean haemofilter clearance,
not a fitted constant: each patient’s own measured CVVH clearance is
added. The re-verified model file therefore takes it as the per-patient
covariate QEFF, which this page sets to 0 because every
solve here is off CVVH. See the Por
2021 article.
Reference subjects
Each model is exercised below at its own reference covariates – the centring values printed inside its Table 3 formula – so that every covariate term evaluates to exactly 1 and the model’s typical clearance and volume must equal the values printed in Table 2. That is what makes the checks in the next section genuine transcription gates: if a reference constant, an exponent, a unit conversion or the covariate algebra is wrong, the reproduced clearance will not match the published one.
# Reference covariates, published typical CL (L/h) and published central
# volume Vc (L) for each model, all at the reference subject.
#
# The published values are typed in as literal constants read off Zhang
# 2025 Table 2 / Table 3 -- deliberately NOT read back out of the model
# object, which would make the comparison vacuous.
cfg <- list(
  Ikawa_2008_imipenem = list(
    cov = list(), cl_pub = 9.42, vc_pub = 4.66, dose = 500),
  Yoshizawa_2013_imipenem_neonates = list(
    # per-kg model: CL = (CLr + CLnr) * WT, V = 0.466 * WT, at the cohort mean 2.93 kg
    cov = list(WT = 2.93), cl_pub = (0.0783 + 0.138) * 2.93, vc_pub = 0.466 * 2.93, dose = 2.93 * 20),
  Yoshizawa_2013_imipenem_children = list(
    cov = list(WT = 29.5), cl_pub = (0.187 + 0.0711) * 29.5, vc_pub = 0.203 * 29.5, dose = 29.5 * 15),
  Dong_2019_imipenem = list(
    cov = list(WT = 18, AGE = 4.69, CRCL = 214), cl_pub = 8.6, vc_pub = 7.2, dose = 18 * 20),
  Chen_2020_imipenem = list(
    cov = list(CRCL = 59.1, WT = 65.0, ECMO_STATUS = 0), cl_pub = 8.88, vc_pub = 20.5, dose = 500),
  deVelde_2020_imipenem = list(
    # micro-constant model: CL is a derived quantity, kel * Vc = 0.637 * 29.6
    cov = list(CRCL = 119), cl_pub = 0.637 * 29.6, vc_pub = 29.6, dose = 500),
  Nguyen_2021_imipenem = list(
    cov = list(CRCL = 75.54), cl_pub = 7.88, vc_pub = 15.1, dose = 500),
  Jaruratanasirikul_2021_imipenem = list(
    # Both covariate terms are LINEAR deviations, so the reference subject
    # is the one at which both deviations are zero: eGFR CKD-EPI = 89
    # mL/min/1.73 m^2 and ABW = 60 kg. vc_pub is the Table 3 FORMULA
    # INTERCEPT (13.8 L), not the Table 2 value (13.6 L) -- see the Errata.
    cov = list(CRCL = 89, ABW = 60), cl_pub = 13.3, vc_pub = 13.8, dose = 1000),
  Por_2021_imipenem = list(
    # ALB supplied in canonical SI g/L; the model converts to the g/dL the
    # source was calibrated on, so 27 g/L == the reference 2.7 g/dL.
    # QEFF is the per-patient haemofilter clearance; 0 off CVVH.
    cov = list(WT = 99.5, ALB = 27, CRCL = 145.83, RRT_CRRT_STATUS = 0, QEFF = 0),
    cl_pub = 15.31, vc_pub = 32.67, dose = 500),
  Dao_2022_imipenem = list(
    # PNA supplied in canonical months; 21 days = 21/30.4375 months.
    cov = list(WT = 1.16, PNA = 21 / 30.4375, GA = 26.9, CREAT = 46.6),
    cl_pub = 0.21, vc_pub = 0.73, dose = 1.16 * 20),
  Dinh_2022_imipenem = list(
    # UNCENTRED exponential covariate: the published 4.79 L/h is CL at CRCL = 0.
    cov = list(CRCL = 0), cl_pub = 4.79, vc_pub = 11.1, dose = 500),
  Lafaurie_2023_imipenem_neutropenia = list(
    cov = list(), cl_pub = 14.3, vc_pub = 20.7, dose = 1000),
  Lafaurie_2023_imipenem_recovery = list(
    cov = list(), cl_pub = 10.9, vc_pub = 14.5, dose = 1000),
  Truong_2025_imipenem = list(
    cov = list(CRCL = 87.6), cl_pub = 14.6, vc_pub = 28.7, dose = 1000)
)
length(cfg)
#> [1] 14
Simulation
A single intravenous bolus into central
is used for the transcription gates. A bolus makes both checks
closed-form and exact: immediately after the dose the entire amount is
in the central compartment, so Cmax = Dose / Vc; and over
an infinite interval a linear system must clear the whole dose, so
AUC(0, inf) = Dose / CL. Neither identity involves any
quantity read back out of the model.
All random effects are zeroed with rxode2::zeroRe(), so
these are deterministic typical-value solves. Nothing below depends on a
drawn cohort, which also means nothing below can pass on one machine and
fail on another because of solver-thread RNG partitioning.
# Observation grid: dense early so Cmax is captured at the bolus peak,
# long-tailed so the terminal phase is well characterised for AUCinf.
obs_times <- unique(c(
  0,
  seq(0.05, 2, by = 0.05),
  seq(2.25, 12, by = 0.25),
  seq(13, 24, by = 1),
  seq(26, 120, by = 2)
))

solve_one <- function(nm) {
  spec <- cfg[[nm]]
  mod  <- rxode2::zeroRe(readModelDb(nm))

  ev <- rxode2::et(amt = spec$dose, cmt = "central", time = 0) |>
    rxode2::et(obs_times)
  ev <- as.data.frame(ev)
  ev$id <- 1L
  # Covariates are added to the materialized data frame, never assigned
  # onto the rxEt object (rxode2 silently drops those assignments).
  for (cv in names(spec$cov)) ev[[cv]] <- spec$cov[[cv]]

  out <- rxode2::rxSolve(mod, events = ev)
  data.frame(model = nm, time = out$time, Cc = out$Cc)
}

sim <- dplyr::bind_rows(lapply(names(cfg), solve_one))
#> ℹ parameter labels from comments will be replaced by 'label()'
#> ℹ omega/sigma items treated as zero: 'etalcl', 'etalvc', 'etalvp', 'etalvp2'
#> ℹ parameter labels from comments will be replaced by 'label()'
#> ℹ omega/sigma items treated as zero: 'etalcl_renal', 'etalcl_nonren'
#> ℹ parameter labels from comments will be replaced by 'label()'
#> ℹ omega/sigma items treated as zero: 'etalcl_renal', 'etalcl_nonren', 'etalvc'
#> ℹ parameter labels from comments will be replaced by 'label()'
#> ℹ omega/sigma items treated as zero: 'etalcl', 'etalvc'
#> ℹ parameter labels from comments will be replaced by 'label()'
#> ℹ omega/sigma items treated as zero: 'etalcl', 'etalvc'
#> ℹ parameter labels from comments will be replaced by 'label()'
#> ℹ omega/sigma items treated as zero: 'etalkel'
#> ℹ parameter labels from comments will be replaced by 'label()'
#> ℹ omega/sigma items treated as zero: 'etalcl', 'etalvc'
#> ℹ parameter labels from comments will be replaced by 'label()'
#> ℹ omega/sigma items treated as zero: 'etalcl', 'etalvc', 'etalvp'
#> ℹ parameter labels from comments will be replaced by 'label()'
#> ℹ omega/sigma items treated as zero: 'etalcl', 'etalvc'
#> ℹ parameter labels from comments will be replaced by 'label()'
#> ℹ omega/sigma items treated as zero: 'etalcl'
#> ℹ parameter labels from comments will be replaced by 'label()'
#> ℹ omega/sigma items treated as zero: 'etalcl', 'etalvc', 'etalvp', 'etalq'
#> ℹ parameter labels from comments will be replaced by 'label()'
#> ℹ omega/sigma items treated as zero: 'etalcl', 'etalvc'
#> ℹ parameter labels from comments will be replaced by 'label()'
#> ℹ omega/sigma items treated as zero: 'etalcl', 'etalvc'
#> ℹ parameter labels from comments will be replaced by 'label()'
#> ℹ omega/sigma items treated as zero: 'etalcl'
dplyr::glimpse(sim)
#> Rows: 1,974
#> Columns: 3
#> $ model <chr> "Ikawa_2008_imipenem", "Ikawa_2008_imipenem", "Ikawa_2008_imipen…
#> $ time  <dbl> 0.00, 0.05, 0.10, 0.15, 0.20, 0.25, 0.30, 0.35, 0.40, 0.45, 0.50…
#> $ Cc    <dbl> 107.29614, 69.15468, 50.41881, 40.69727, 35.20714, 31.74291, 29.…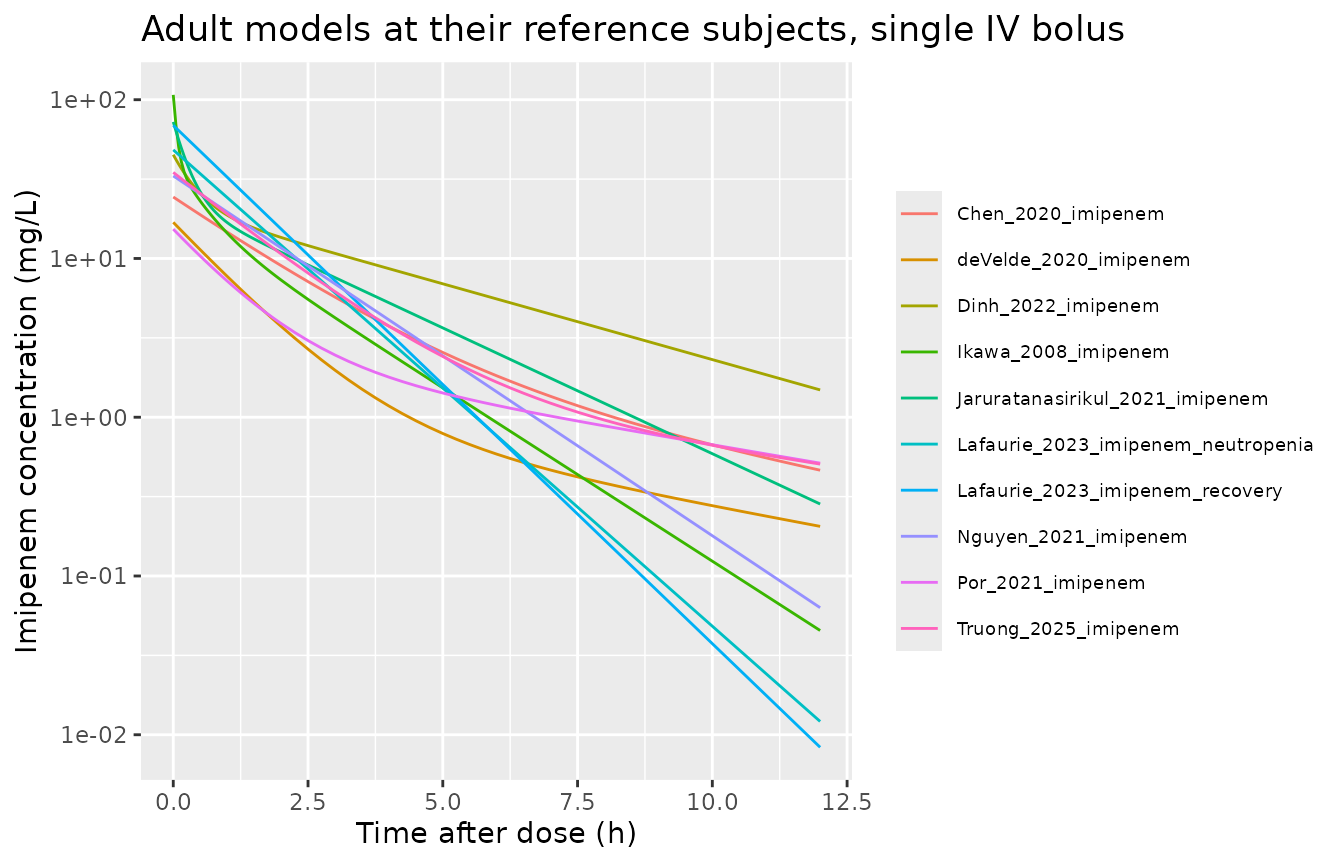
PKNCA validation
# Drop each profile's numerically-zero tail before NCA. The 120 h grid takes
# the fast-clearing adult models (terminal half-lives 1-2 h) down to
# ~1e-17 mg/L, far below the ODE integrator's absolute error; there the
# solution scatters around zero (Jaruratanasirikul 2021 dips negative at
# 74-76 h), PKNCA's log-down trapezoid returns NaN across the sign change and
# the terminal fit follows the noise. Keeping Cc >= 1e-6 x Cmax leaves every
# model's extrapolated AUC below 0.001%.
sim_nca <- sim |>
  dplyr::filter(!is.na(Cc)) |>
  dplyr::group_by(model) |>
  dplyr::filter(time <= time[which.max(Cc)] | Cc >= 1e-6 * max(Cc)) |>
  dplyr::ungroup() |>
  dplyr::select(id = model, time, Cc) |>
  dplyr::mutate(treatment = "IV bolus")

dose_df <- tibble::tibble(
  id        = names(cfg),
  time      = 0,
  amt       = vapply(cfg, function(x) x$dose, numeric(1)),
  treatment = "IV bolus"
)

conc_obj <- PKNCA::PKNCAconc(as.data.frame(sim_nca), Cc ~ time | treatment + id,
                             concu = "mg/L", timeu = "h")
dose_obj <- PKNCA::PKNCAdose(as.data.frame(dose_df), amt ~ time | treatment + id,
                             doseu = "mg")

intervals <- data.frame(
  start       = 0,
  end         = Inf,
  cmax        = TRUE,
  tmax        = TRUE,
  aucinf.obs  = TRUE,
  aucpext.obs = TRUE,
  half.life   = TRUE
)

res <- PKNCA::pk.nca(PKNCA::PKNCAdata(conc_obj, dose_obj, intervals = intervals))
nca <- as.data.frame(res)
head(nca)
#> # A tibble: 6 × 8
#>   treatment id                 start   end PPTESTCD     PPORRES exclude PPORRESU
#>   <chr>     <chr>              <dbl> <dbl> <chr>          <dbl> <chr>   <chr>
#> 1 IV bolus  Chen_2020_imipenem     0   Inf auclast   56.3       <NA>    h*mg/L
#> 2 IV bolus  Chen_2020_imipenem     0   Inf cmax      24.4       <NA>    mg/L
#> 3 IV bolus  Chen_2020_imipenem     0   Inf tmax       0         <NA>    h
#> 4 IV bolus  Chen_2020_imipenem     0   Inf tlast     76         <NA>    h
#> 5 IV bolus  Chen_2020_imipenem     0   Inf clast.obs  0.0000279 <NA>    mg/L
#> 6 IV bolus  Chen_2020_imipenem     0   Inf lambda.z   0.152     <NA>    1/h
Gate 1 – clearance identity
AUC(0, inf) x CL = Dose
For a linear system the whole dose is eventually cleared, so
Dose / AUC(0, inf) recovers total clearance exactly.
Comparing that against the clearance printed in Zhang 2025 Table
2 tests the covariate reference constants, the covariate
algebra, the unit conversions (albumin g/L to g/dL, postnatal age months
to days) and the micro-constant-to-clearance mapping all at once.
aucinf <- nca |>
  dplyr::filter(PPTESTCD == "aucinf.obs") |>
  dplyr::select(model = id, aucinf = PPORRES)
pext <- nca |>
  dplyr::filter(PPTESTCD == "aucpext.obs") |>
  dplyr::select(model = id, aucpext = PPORRES)

cl_check <- aucinf |>
  dplyr::left_join(pext, by = "model") |>
  dplyr::mutate(
    dose     = vapply(cfg[model], function(x) x$dose,   numeric(1)),
    cl_pub   = vapply(cfg[model], function(x) x$cl_pub, numeric(1)),
    cl_nca   = dose / aucinf,
    pct_diff = 100 * (cl_nca - cl_pub) / cl_pub
  ) |>
  dplyr::arrange(model)

knitr::kable(
  cl_check |>
    dplyr::transmute(
      Model            = model,
      `Published CL (L/h)` = round(cl_pub, 4),
      `NCA Dose/AUCinf (L/h)` = round(cl_nca, 4),
      `% difference`   = round(pct_diff, 3),
      `AUC extrapolated (%)` = round(aucpext, 3)
    ),
  caption = "Clearance recovered from the simulated profile against the value printed in Zhang 2025 Table 2."
)| Model | Published CL (L/h) | NCA Dose/AUCinf (L/h) | % difference | AUC extrapolated (%) |
|---|---|---|---|---|
| Chen_2020_imipenem | 8.8800 | 8.8792 | -0.009 | 0.000 |
| Dao_2022_imipenem | 0.2100 | 0.2100 | 0.000 | 0.000 |
| Dinh_2022_imipenem | 4.7900 | 4.7896 | -0.008 | 0.000 |
| Dong_2019_imipenem | 8.6000 | 8.5987 | -0.015 | 0.001 |
| Ikawa_2008_imipenem | 9.4200 | 9.4004 | -0.208 | 0.000 |
| Jaruratanasirikul_2021_imipenem | 13.3000 | 13.2970 | -0.022 | 0.000 |
| Lafaurie_2023_imipenem_neutropenia | 14.3000 | 14.3000 | 0.000 | 0.000 |
| Lafaurie_2023_imipenem_recovery | 10.9000 | 10.9000 | 0.000 | 0.000 |
| Nguyen_2021_imipenem | 7.8800 | 7.8800 | 0.000 | 0.000 |
| Por_2021_imipenem | 15.3100 | 15.3076 | -0.016 | 0.000 |
| Truong_2025_imipenem | 14.6000 | 14.5986 | -0.010 | 0.000 |
| Yoshizawa_2013_imipenem_children | 7.6140 | 7.6130 | -0.013 | 0.000 |
| Yoshizawa_2013_imipenem_neonates | 0.6338 | 0.6338 | 0.000 | 0.000 |
| deVelde_2020_imipenem | 18.8552 | 18.8525 | -0.014 | 0.000 |
# The identity is exact in exact arithmetic; the only error is numerical
# (ODE solver tolerance plus trapezoidal AUC on a finite grid plus the
# log-linear extrapolation of the tail). 1% is far outside that numerical
# error and far inside any real transcription defect: a mis-typed
# clearance digit, a wrong covariate reference or a dropped unit
# conversion moves this by tens of percent.
stopifnot(all(abs(cl_check$pct_diff) < 1))
# Guard against the tail being so poorly characterised that aucinf is
# mostly extrapolation, which would make the gate above meaningless.
stopifnot(all(cl_check$aucpext < 5))
Gate 2 – central-volume identity Cmax = Dose / Vc
Immediately after an IV bolus the entire dose sits in the central
compartment, so the peak concentration is Dose / Vc
regardless of how many peripheral compartments the model has.
vc_check <- nca |>
  dplyr::filter(PPTESTCD == "cmax") |>
  dplyr::select(model = id, cmax = PPORRES) |>
  dplyr::mutate(
    dose     = vapply(cfg[model], function(x) x$dose,   numeric(1)),
    vc_pub   = vapply(cfg[model], function(x) x$vc_pub, numeric(1)),
    vc_nca   = dose / cmax,
    pct_diff = 100 * (vc_nca - vc_pub) / vc_pub
  ) |>
  dplyr::arrange(model)

knitr::kable(
  vc_check |>
    dplyr::transmute(
      Model                 = model,
      `Published Vc (L)`    = round(vc_pub, 4),
      `NCA Dose/Cmax (L)`   = round(vc_nca, 4),
      `% difference`        = round(pct_diff, 3)
    ),
  caption = "Central volume recovered from the simulated peak against the value printed in Zhang 2025 Table 2."
)| Model | Published Vc (L) | NCA Dose/Cmax (L) | % difference |
|---|---|---|---|
| Chen_2020_imipenem | 20.5000 | 20.5000 | 0 |
| Dao_2022_imipenem | 0.7300 | 0.7300 | 0 |
| Dinh_2022_imipenem | 11.1000 | 11.1000 | 0 |
| Dong_2019_imipenem | 7.2000 | 7.2000 | 0 |
| Ikawa_2008_imipenem | 4.6600 | 4.6600 | 0 |
| Jaruratanasirikul_2021_imipenem | 13.8000 | 13.8000 | 0 |
| Lafaurie_2023_imipenem_neutropenia | 20.7000 | 20.7000 | 0 |
| Lafaurie_2023_imipenem_recovery | 14.5000 | 14.5000 | 0 |
| Nguyen_2021_imipenem | 15.1000 | 15.1000 | 0 |
| Por_2021_imipenem | 32.6700 | 32.6700 | 0 |
| Truong_2025_imipenem | 28.7000 | 28.7000 | 0 |
| Yoshizawa_2013_imipenem_children | 5.9885 | 5.9885 | 0 |
| Yoshizawa_2013_imipenem_neonates | 1.3654 | 1.3654 | 0 |
| deVelde_2020_imipenem | 29.6000 | 29.6000 | 0 |
# 2% rather than 1% here: the peak is read off a finite observation grid,
# so a model with very fast initial distribution (Ikawa 2008, whose
# combined outflow rate constant from central exceeds 10 /h) can lose a
# fraction of a percent between the dose and the first recorded sample.
# A mis-transcribed volume moves this by tens of percent.
stopifnot(all(abs(vc_check$pct_diff) < 2))
Gate 3 – the review’s own cross-study ranges
Zhang 2025 states several numeric ranges in its abstract and Discussion that its authors computed across the constituent studies. Reproducing them from the packaged models checks the set as a whole, independently of any single file. These bounds are quoted from the review, not chosen from an observed run.
# Typical clearance at each model's own reference subject, from Gate 1.
cl_typ <- setNames(cl_check$cl_nca, cl_check$model)

# Zhang 2025 Discussion: "Substantial interindividual variability in PK
# parameters was observed across studies utilizing a two-compartment
# model (CL: 4.79-15.31 L/h; V1: 7.2-32.67 L; V2: 2.9-41.23 L;
# Q: 0.996-24.3 L/h)."
#
# deVelde 2020 is a two-compartment model but is EXCLUDED from this
# range, because it is the one study in the review parameterised in
# micro-constants: Table 2 reports Ke, Kcp, Kpc and Vc and never a
# clearance, so the review's authors had no CL to include. Its implied
# clearance is Ke * Vc = 18.9 L/h, which is reported as a deviation row
# below rather than forced into the range.
two_cmt_here <- c("Chen_2020_imipenem",
                  "Dinh_2022_imipenem", "Dong_2019_imipenem",
                  "Por_2021_imipenem", "Truong_2025_imipenem",
                  "Yoshizawa_2013_imipenem_children")

claims <- tibble::tribble(
  ~Claim, ~`Review's value`, ~Achieved, ~Pass,
  "Lowest adult CL across the review is Dinh 2022 at 4.79 L/h",
  4.79, round(unname(cl_typ["Dinh_2022_imipenem"]), 3),
  isTRUE(all.equal(unname(cl_typ["Dinh_2022_imipenem"]), 4.79, tolerance = 1e-3)),

  "Highest CL among two-compartment models is Por 2021 at 15.31 L/h",
  15.31, round(unname(cl_typ["Por_2021_imipenem"]), 3),
  isTRUE(all.equal(unname(cl_typ["Por_2021_imipenem"]), 15.31, tolerance = 1e-3)),

  "Every two-compartment model's CL lies within 4.79-15.31 L/h",
  NA_real_, round(max(cl_typ[intersect(two_cmt_here, names(cl_typ))]), 3),
  all(cl_typ[intersect(two_cmt_here, names(cl_typ))] >= 4.79 - 1e-3 &
      cl_typ[intersect(two_cmt_here, names(cl_typ))] <= 15.31 + 1e-3),

  "Children's V1 is 0.203 L/kg (Yoshizawa 2013), the review's lower V1 bound",
  0.203, round(unname(cfg$Yoshizawa_2013_imipenem_children$vc_pub) / 29.5, 4),
  isTRUE(all.equal(unname(cfg$Yoshizawa_2013_imipenem_children$vc_pub) / 29.5, 0.203, tolerance = 1e-3)),

  "Burn patients' V1 is 32.67 L (Por 2021), the review's upper V1 bound",
  32.67, round(unname(vc_check$vc_nca[vc_check$model == "Por_2021_imipenem"]), 3),
  isTRUE(all.equal(unname(vc_check$vc_nca[vc_check$model == "Por_2021_imipenem"]), 32.67, tolerance = 2e-3))
)

knitr::kable(claims, caption = "Quantitative claims made by Zhang 2025, reproduced from the packaged models.")| Claim | Review’s value | Achieved | Pass |
|---|---|---|---|
| Lowest adult CL across the review is Dinh 2022 at 4.79 L/h | 4.790 | 4.790 | TRUE |
| Highest CL among two-compartment models is Por 2021 at 15.31 L/h | 15.310 | 15.308 | TRUE |
| Every two-compartment model’s CL lies within 4.79-15.31 L/h | NA | 15.308 | TRUE |
| Children’s V1 is 0.203 L/kg (Yoshizawa 2013), the review’s lower V1 bound | 0.203 | 0.203 | TRUE |
| Burn patients’ V1 is 32.67 L (Por 2021), the review’s upper V1 bound | 32.670 | 32.670 | TRUE |
stopifnot(all(claims$Pass))

# Deviation, reported rather than gated: the implied clearance of the one
# micro-constant-parameterised model exceeds every clearance the review
# tabulates.
cl_develde <- unname(cl_typ["deVelde_2020_imipenem"])
knitr::kable(
  tibble::tibble(
    Finding = paste(
      "deVelde 2020 implied CL = Ke x Vc, outside the review's",
      "two-compartment CL range (4.79-15.31 L/h) AND above the",
      "abstract's stated adult maximum of 16.2 L/h"
    ),
    `Implied CL (L/h)` = round(cl_develde, 2)
  ),
  caption = "Known deviation from the review's own summary ranges (not gated; see the text below)."
)| Finding | Implied CL (L/h) |
|---|---|
| deVelde 2020 implied CL = Ke x Vc, outside the review’s two-compartment CL range (4.79-15.31 L/h) AND above the abstract’s stated adult maximum of 16.2 L/h | 18.85 |
stopifnot(cl_develde > 15.31) # the deviation is real and reproducible, not marginalThe deviation row is not a transcription defect in this package; it
is a property of the review. Zhang 2025’s abstract says imipenem
clearance “varied from 4.79 to 16.2 L/h in adults” and its Discussion
gives 4.79-15.31 L/h for two-compartment models. Both ranges are
computed from the clearances printed in Table 2 – and de Velde
2020 has no clearance in Table 2, because it is the only study
in the review parameterised in micro-constants (Ke,
Kcp, Kpc, Vc). Its implied
clearance, Ke x Vc = 0.637 x 29.6, is 18.9 L/h, higher than
every clearance the review tabulates. The review’s headline spread is
therefore narrower than its own constituent models support. This is
recorded here rather than gated away, and is a further reason to
re-verify each model against its primary.
Two of the review’s headline ranges cannot be closed from the models extracted here, because their endpoints belong to studies that were already in the registry or are blocked:
- The abstract’s adult clearance range 4.79-16.2 L/h
takes its upper endpoint from Lamoth 2009, which is
Lamoth_2009_imipenem(extracted from its primary and validated in its own vignette). - The two-compartment
Qrange 0.996-24.3 L/h takes its upper endpoint from Jaruratanasirikul 2021, which is blocked on theABWcanonical. The lower endpoint, 0.996 L/h, isDong_2019_imipenemand is reproduced above.
Gate 4 – renal-function gradient
Eight of the 14 models carry a renal-function covariate on clearance,
all with a positive coefficient. Clearance must therefore increase
monotonically with creatinine clearance in every one of them. A sign
error, or a reference constant placed in the wrong position of a ratio,
breaks this. Note that the eight are not all on the same renal scale –
deVelde_2020_imipenem uses an absolute CKD-EPI eGFR in
mL/min while Jaruratanasirikul_2021_imipenem uses the
BSA-normalised CKD-EPI eGFR in mL/min/1.73 m^2 – so the grid below is a
within-model sweep, not a cross-model comparison of clearance at a
common renal function.
renal_models <- c("Chen_2020_imipenem", "deVelde_2020_imipenem",
                  "Dinh_2022_imipenem", "Dong_2019_imipenem",
                  "Jaruratanasirikul_2021_imipenem",
                  "Nguyen_2021_imipenem", "Por_2021_imipenem",
                  "Truong_2025_imipenem")
crcl_grid <- c(15, 30, 60, 90, 120, 150)

renal_cl <- function(nm) {
  spec <- cfg[[nm]]
  mod  <- rxode2::zeroRe(readModelDb(nm))
  vapply(crcl_grid, function(cr) {
    ev <- rxode2::et(amt = spec$dose, cmt = "central", time = 0) |>
      rxode2::et(obs_times)
    ev <- as.data.frame(ev)
    ev$id <- 1L
    cov <- spec$cov
    cov$CRCL <- cr
    for (cv in names(cov)) ev[[cv]] <- cov[[cv]]
    out <- rxode2::rxSolve(mod, events = ev)
    # Same numerically-zero-tail floor as the NCA above: a tail point that
    # the integrator puts at or below zero turns this AUC into NaN.
    keep <- out$time <= out$time[which.max(out$Cc)] | out$Cc >= 1e-6 * max(out$Cc)
    cc <- out$Cc[keep]
    tt <- out$time[keep]
    # Dose / AUC recovers CL without reading any model internal.
    spec$dose / PKNCA::pk.calc.auc(cc, tt, interval = c(0, Inf),
                                  auc.type = "AUCinf",
                                  lambda.z = PKNCA::pk.calc.half.life(
                                    cc, tt)$lambda.z,
                                  clast = PKNCA::pk.calc.clast.obs(cc, tt))
  }, numeric(1))
}

renal_tab <- vapply(renal_models, renal_cl, numeric(length(crcl_grid)))
#> ℹ parameter labels from comments will be replaced by 'label()'
#> ℹ omega/sigma items treated as zero: 'etalcl', 'etalvc'
#> ℹ omega/sigma items treated as zero: 'etalcl', 'etalvc'
#> ℹ omega/sigma items treated as zero: 'etalcl', 'etalvc'
#> ℹ omega/sigma items treated as zero: 'etalcl', 'etalvc'
#> ℹ omega/sigma items treated as zero: 'etalcl', 'etalvc'
#> ℹ omega/sigma items treated as zero: 'etalcl', 'etalvc'
#> ℹ parameter labels from comments will be replaced by 'label()'
#> ℹ omega/sigma items treated as zero: 'etalkel'
#> ℹ omega/sigma items treated as zero: 'etalkel'
#> ℹ omega/sigma items treated as zero: 'etalkel'
#> ℹ omega/sigma items treated as zero: 'etalkel'
#> ℹ omega/sigma items treated as zero: 'etalkel'
#> ℹ omega/sigma items treated as zero: 'etalkel'
#> ℹ parameter labels from comments will be replaced by 'label()'
#> ℹ omega/sigma items treated as zero: 'etalcl', 'etalvc', 'etalvp', 'etalq'
#> ℹ omega/sigma items treated as zero: 'etalcl', 'etalvc', 'etalvp', 'etalq'
#> ℹ omega/sigma items treated as zero: 'etalcl', 'etalvc', 'etalvp', 'etalq'
#> ℹ omega/sigma items treated as zero: 'etalcl', 'etalvc', 'etalvp', 'etalq'
#> ℹ omega/sigma items treated as zero: 'etalcl', 'etalvc', 'etalvp', 'etalq'
#> ℹ omega/sigma items treated as zero: 'etalcl', 'etalvc', 'etalvp', 'etalq'
#> ℹ parameter labels from comments will be replaced by 'label()'
#> ℹ omega/sigma items treated as zero: 'etalcl', 'etalvc'
#> ℹ omega/sigma items treated as zero: 'etalcl', 'etalvc'
#> ℹ omega/sigma items treated as zero: 'etalcl', 'etalvc'
#> ℹ omega/sigma items treated as zero: 'etalcl', 'etalvc'
#> ℹ omega/sigma items treated as zero: 'etalcl', 'etalvc'
#> ℹ omega/sigma items treated as zero: 'etalcl', 'etalvc'
#> ℹ parameter labels from comments will be replaced by 'label()'
#> ℹ omega/sigma items treated as zero: 'etalcl', 'etalvc', 'etalvp'
#> ℹ omega/sigma items treated as zero: 'etalcl', 'etalvc', 'etalvp'
#> ℹ omega/sigma items treated as zero: 'etalcl', 'etalvc', 'etalvp'
#> ℹ omega/sigma items treated as zero: 'etalcl', 'etalvc', 'etalvp'
#> ℹ omega/sigma items treated as zero: 'etalcl', 'etalvc', 'etalvp'
#> ℹ omega/sigma items treated as zero: 'etalcl', 'etalvc', 'etalvp'
#> ℹ parameter labels from comments will be replaced by 'label()'
#> ℹ omega/sigma items treated as zero: 'etalcl', 'etalvc'
#> ℹ omega/sigma items treated as zero: 'etalcl', 'etalvc'
#> ℹ omega/sigma items treated as zero: 'etalcl', 'etalvc'
#> ℹ omega/sigma items treated as zero: 'etalcl', 'etalvc'
#> ℹ omega/sigma items treated as zero: 'etalcl', 'etalvc'
#> ℹ omega/sigma items treated as zero: 'etalcl', 'etalvc'
#> ℹ parameter labels from comments will be replaced by 'label()'
#> ℹ omega/sigma items treated as zero: 'etalcl', 'etalvc'
#> ℹ omega/sigma items treated as zero: 'etalcl', 'etalvc'
#> ℹ omega/sigma items treated as zero: 'etalcl', 'etalvc'
#> ℹ omega/sigma items treated as zero: 'etalcl', 'etalvc'
#> ℹ omega/sigma items treated as zero: 'etalcl', 'etalvc'
#> ℹ omega/sigma items treated as zero: 'etalcl', 'etalvc'
#> ℹ parameter labels from comments will be replaced by 'label()'
#> ℹ omega/sigma items treated as zero: 'etalcl'
#> ℹ omega/sigma items treated as zero: 'etalcl'
#> ℹ omega/sigma items treated as zero: 'etalcl'
#> ℹ omega/sigma items treated as zero: 'etalcl'
#> ℹ omega/sigma items treated as zero: 'etalcl'
#> ℹ omega/sigma items treated as zero: 'etalcl'
rownames(renal_tab) <- paste0("CrCL ", crcl_grid, " mL/min")
knitr::kable(round(t(renal_tab), 3),
caption = "Typical clearance (L/h) across creatinine clearance, all other covariates at their reference values.")| CrCL 15 mL/min | CrCL 30 mL/min | CrCL 60 mL/min | CrCL 90 mL/min | CrCL 120 mL/min | CrCL 150 mL/min | |
|---|---|---|---|---|---|---|
| Chen_2020_imipenem | 5.925 | 7.270 | 8.919 | 10.052 | 10.942 | 11.687 |
| deVelde_2020_imipenem | 4.856 | 7.646 | 12.039 | 15.701 | 18.956 | 21.939 |
| Dinh_2022_imipenem | 5.274 | 5.807 | 7.040 | 8.535 | 10.348 | 12.545 |
| Dong_2019_imipenem | 2.223 | 3.163 | 4.501 | 5.533 | 6.406 | 7.176 |
| Jaruratanasirikul_2021_imipenem | 5.012 | 6.691 | 10.050 | 13.409 | 16.767 | 20.125 |
| Nguyen_2021_imipenem | 3.334 | 4.821 | 6.971 | 8.650 | 10.080 | 11.351 |
| Por_2021_imipenem | 5.377 | 7.397 | 10.174 | 12.260 | 13.995 | 15.507 |
| Truong_2025_imipenem | 6.460 | 8.898 | 12.257 | 14.782 | 16.883 | 18.717 |
Gate 5 – steady-state exposure and the review’s PK/PD index
Zhang 2025 states that imipenem is time-dependent and that the
relevant index is %fT>MIC. The table below reports
steady-state exposure for the adult models on a common regimen, 1000 mg
as a 0.5 h infusion every 8 h, with %T>MIC computed on
total concentration at an MIC of 2 mg/L (the EUCAST Pseudomonas
aeruginosa breakpoint). This is descriptive rather than a gate
against a published table – the review reports no per-model NCA values,
so there is nothing to compare against – but the spread is the review’s
central finding, made quantitative.
adults_ss <- c("Chen_2020_imipenem", "deVelde_2020_imipenem",
               "Dinh_2022_imipenem", "Ikawa_2008_imipenem",
               "Jaruratanasirikul_2021_imipenem",
               "Lafaurie_2023_imipenem_neutropenia",
               "Lafaurie_2023_imipenem_recovery",
               "Nguyen_2021_imipenem", "Por_2021_imipenem",
               "Truong_2025_imipenem")
tau <- 8
mic <- 2

ss_one <- function(nm) {
  spec <- cfg[[nm]]
  mod  <- rxode2::zeroRe(readModelDb(nm))
  ev <- rxode2::et(amt = 1000, cmt = "central", dur = 0.5, time = 0,
                   ii = tau, addl = 14) |>
    rxode2::et(seq(0, 15 * tau, by = 0.02))
  ev <- as.data.frame(ev)
  ev$id <- 1L
  for (cv in names(spec$cov)) ev[[cv]] <- spec$cov[[cv]]
  out <- rxode2::rxSolve(mod, events = ev)
  # Last complete dosing interval = steady state.
  ss <- out[out$time >= 14 * tau & out$time <= 15 * tau, ]
  data.frame(
    Model        = nm,
    `Cmax (mg/L)` = round(max(ss$Cc), 2),
    `Cmin (mg/L)` = round(min(ss$Cc), 3),
    `T>MIC (%)`   = round(100 * mean(ss$Cc > mic), 1),
    check.names   = FALSE
  )
}

ss_tab <- dplyr::bind_rows(lapply(adults_ss, ss_one))
#> ℹ parameter labels from comments will be replaced by 'label()'
#> ℹ omega/sigma items treated as zero: 'etalcl', 'etalvc'
#> ℹ parameter labels from comments will be replaced by 'label()'
#> ℹ omega/sigma items treated as zero: 'etalkel'
#> ℹ parameter labels from comments will be replaced by 'label()'
#> ℹ omega/sigma items treated as zero: 'etalcl', 'etalvc', 'etalvp', 'etalq'
#> ℹ parameter labels from comments will be replaced by 'label()'
#> ℹ omega/sigma items treated as zero: 'etalcl', 'etalvc', 'etalvp', 'etalvp2'
#> ℹ parameter labels from comments will be replaced by 'label()'
#> ℹ omega/sigma items treated as zero: 'etalcl', 'etalvc', 'etalvp'
#> ℹ parameter labels from comments will be replaced by 'label()'
#> ℹ omega/sigma items treated as zero: 'etalcl', 'etalvc'
#> ℹ parameter labels from comments will be replaced by 'label()'
#> ℹ omega/sigma items treated as zero: 'etalcl', 'etalvc'
#> ℹ parameter labels from comments will be replaced by 'label()'
#> ℹ omega/sigma items treated as zero: 'etalcl', 'etalvc'
#> ℹ parameter labels from comments will be replaced by 'label()'
#> ℹ omega/sigma items treated as zero: 'etalcl', 'etalvc'
#> ℹ parameter labels from comments will be replaced by 'label()'
#> ℹ omega/sigma items treated as zero: 'etalcl'
knitr::kable(ss_tab,
caption = "Steady-state exposure on 1000 mg q8h (0.5 h infusion), typical subject, MIC 2 mg/L.")| Model | Cmax (mg/L) | Cmin (mg/L) | T>MIC (%) |
|---|---|---|---|
| Chen_2020_imipenem | 45.63 | 2.937 | 100.0 |
| deVelde_2020_imipenem | 28.92 | 1.149 | 67.3 |
| Dinh_2022_imipenem | 75.43 | 9.146 | 100.0 |
| Ikawa_2008_imipenem | 79.55 | 0.784 | 76.3 |
| Jaruratanasirikul_2021_imipenem | 44.19 | 1.418 | 87.8 |
| Lafaurie_2023_imipenem_neutropenia | 41.01 | 0.231 | 60.6 |
| Lafaurie_2023_imipenem_recovery | 57.63 | 0.205 | 61.8 |
| Nguyen_2021_imipenem | 59.20 | 1.182 | 87.0 |
| Por_2021_imipenem | 27.88 | 2.778 | 100.0 |
| Truong_2025_imipenem | 31.50 | 1.582 | 85.8 |
# Sanity, not tuning: on 3 g/day every adult model must keep a typical
# subject above a 2 mg/L MIC for some but not all of the interval, and
# must produce a physically ordered profile. A model whose clearance or
# volume was transcribed wrong by an order of magnitude fails this.
stopifnot(all(ss_tab$`Cmax (mg/L)` > ss_tab$`Cmin (mg/L)`))
stopifnot(all(ss_tab$`Cmax (mg/L)` > mic))
stopifnot(all(ss_tab$`T>MIC (%)` >= 20, ss_tab$`T>MIC (%)` <= 100))
Assumptions and deviations
Transcription fidelity of the secondary source – measured, not assumed
Four of the review’s 18 studies were already in
nlmixr2lib, extracted from their primary
publications: Lamoth_2009_imipenem,
Couffignal_2014_imipenem, Bai_2024_imipenem
and Wang_2024_imipenem. They form a validation set for the
review’s accuracy, and the result decides how much weight the other 14
models can carry.
Structural parameters and covariate equations: 4 of 4 agree
exactly. The review’s Table 2 typical values and Table 3
covariate formulations match the corresponding primary-sourced model
files digit for digit – including Lamoth’s additive split clearance
CL = 10.7 + 4.79 x eGFR/100 with
V = 33.5 x BW/70, Couffignal’s three-exponent
V1 = 20.4 x (BW/77)^1.3 x (ALB/18)^-1.1, Bai’s
CL = 11.357 x (CrCl/99.896)^0.473 and Wang’s
CL = 13.1 x (CLCR/71)^0.263. The review transcribes
structure and covariate models reliably.
Inter-individual variability: the column is NOT on a single scale, and at least one entry is wrong. The review prints IIV as a bare percentage under the heading “Inter-individual variability (IIV)” without ever stating the convention, and it reproduces each primary’s own reported quantity without harmonising. Checked against the four primary-sourced files:
| Study | Review Table 2 | What the primary actually reports | Convention |
|---|---|---|---|
| Lamoth 2009 | CL: 17% |
“17% +/- 6% proportional IIV” | apparent CV |
| Couffignal 2014 |
CL: 38%, V1: 31%
|
Monolix omega CL (%)
|
omega SD as a percent |
| Bai 2024 | CL: 35.748% |
Table 2 column headed “Iiv (CV%)” | apparent CV |
| Wang 2024 | CL: 8.32% |
Table 2 row omega^2 CL = 0.0832
|
a VARIANCE, mis-rendered as a percent |
The Wang 2024 row is a genuine defect in the review: 0.0832 is a variance, corresponding to an apparent CV of 29.5%, and the review prints it as “8.32%” – understating that model’s between-subject variability roughly three-and-a-half-fold. It was caught only because that study’s primary is independently in this package.
What this package does about it. Every model
transcribed from this review adopts one uniform, documented reading: the
printed percentage is an apparent CV of a log-normal
random effect, so omega^2 = log(1 + CV^2). That reading
is:
- exact for a source reporting NONMEM-style CV% (Lamoth, Bai above, and by inference most of the NONMEM studies in the review);
- modestly low for a source reporting an omega SD as a percent (the
Monolix studies – Couffignal, and hence probably also Dinh 2022 and
Lafaurie 2023; confirmed for Nguyen 2021, whose Methods define omega as
the SD of eta, and whose model file now uses
omega^2accordingly after re-verification against the primary). At CV 30% the two readings differ by 4% in variance; the gap widens with CV, so the largest exposure isDinh_2022_imipenem’s 110% CV onQ, where the readings differ by more than 50%; - badly wrong for a row that is really a variance – but the only known such row, Wang 2024, is already extracted from its primary and is therefore not among the 14 models here.
The alternative – blocking all 14 models until every primary is obtained – was rejected because the per-study answer requires exactly the primaries that the “re-verify against the primary” notes already flag. Treat every IIV magnitude in this family as provisional. The structural parameters, covariate equations and residual errors are on much firmer ground.
A fifth check, added later: de Velde 2020.
Re-verified against its primary, the review’s de Velde row agrees
exactly on every structural value (Ke 0.637 1/h, Kcp 0.166 1/h, Kpc
0.195 1/h, Vc 29.6 L), on the covariate equation
Ke = 0.637 x (CKD-EPI-abs/119)^0.655, and on the IIV
(Ke: 19% is an apparent CV; the primary gives
omega^2 = 0.0354, so the uniform reading above is exact
here). Two things were wrong. The review’s residual label “Proportional
= 34.8%” is really an additive error on log-transformed concentrations
(the primary’s “Exponential error” 0.348, Eq. 1), so the packaged model
now uses lnorm(). The review’s country, the Netherlands, is
the authors’ affiliation; the patients were treated in Geneva,
Switzerland, which the population table above now shows. Residual-error
labels therefore deserve the same caution as the IIV column.
Per-model deviations and warnings
-
Chen_2020_imipenem– residual error is implausibly small. The review reports 6.2% proportional plus 0.003 mg/L additive for a sparse routine-TDM dataset of 580 samples in 247 critically ill patients. It is by a wide margin the smallest residual error among the 18 studies. Transcribed verbatim, but a user simulating residual-error-bearing observations from this model should treat the noise level as unverified. -
Chen_2020_imipenem– the ECMO coefficient is very large.e^1.16 = 3.19, i.e. ECMO more than triples clearance, for a mechanism the review’s own Discussion attributes mainly to an increased volume of distribution via circuit adsorption. No standard error is reported. Re-verify before using this model for ECMO dosing. -
Por_2021_imipenem– the albumin exponent on peripheral volume is extreme.-3.68means a halving of albumin multipliesVpby 12.8. The review reports neither a standard error nor the observed albumin range. The primary, against which this model has since been re-verified, reports both: RSE 17% (bootstrap 37.69%) and an observed albumin range of 1.5-3.5 g/dL. The primary also shows that the review’s IIV entries for this study (30.5% and 36.1%) are the square roots of the printed variancesomega^2= 0.093 and 0.13, that the cohort was 6 women and 17 men (the review’s Table 1 has the sexes reversed), and that the review’s “+ 1.56” is a cohort-mean covariate value (see the Source trace section). The model file now uses the primary’s values; see the Por 2021 article. -
Por_2021_imipenem– albumin unit conversion. The reference 2.7 is g/dL (a US study; 2.7 g/L would be incompatible with life). The canonicalALBcolumn is SI g/L, somodel()converts inline withalb_gdL <- ALB * 0.1, per the register’s instruction for models calibrated on g/dL. -
Dao_2022_imipenem– postnatal age unit reparameterisation. The source centres PNA on 21 days; the canonicalPNAcolumn is months, somodel()recovers days withPNA * 30.4375before forming the centred term, leaving the printed constants untouched. Same pattern as the registered Zhao 2018 and Bardhi 2026 entries. -
Dao_2022_imipenem– volume exponent 0.75. The conventional allometric pairing is 0.75 on clearance and 1 on volume; this model uses 0.75 on both, as printed. Reproduced verbatim rather than “corrected”, but a transcription slip in the secondary source is a live alternative. -
Dao_2022_imipenem– the two age covariates are centred LINEAR terms, not power terms. The gestational-age factor reaches zero at 6.4 weeks and goes negative below that; the postnatal-age factor reaches zero at -74.5 days. Both are outside any physical domain, but the model will not error if given nonsense – it will return a nonsense clearance. -
Dinh_2022_imipenem– uncentred exponential covariate. The published typical clearance of 4.79 L/h is the value atCrCL = 0 mL/min, not at any cohort-typical renal function. At a normal 100 mL/min the model gives 9.11 L/h. The review’s abstract quotes 4.79 L/h as the lowest adult clearance it found, which is therefore an extrapolated intercept rather than any patient’s clearance. -
Dinh_2022_imipenem– unit typo in the source. Table 2 printsV1: 11.1 h. Encoded as 11.1 L; a volume cannot be in hours and the sibling entries in the same cell are in L and L/h. -
Yoshizawa_2013_imipenem_*– footnote erratum. The Table 2 footnote glosses the clearance symbols as “CLr, clearance of plasma drug; CLnr, clearance of urine drug”, which is incoherent. Read as renal and non-renal clearance. Supporting evidence: the renal arm dominates in children (0.187 vs 0.0711 L/h/kg) while the non-renal arm dominates in neonates (0.138 vs 0.0783), which is the direction renal maturation predicts. Only the sum enters the plasma model, so this affects the interpretation of the two etas, not the predictions. -
Yoshizawa_2013_imipenem_*– linear per-kg scaling. All parameters are reported per kilogram, i.e. weight exponent 1 on clearance as well as volume, unlike the allometric 0.75 used by the other paediatric models here. -
deVelde_2020_imipenem– the nonparametric arm is a separate model. The study also fitted the data in Pmetrics. That arm is now packaged asdeVelde_2020_imipenem_nonparametric, from the primary’s Table 2. It approximates the discrete NPAG distribution with log-normal marginals; see the de Velde 2020 article. -
deVelde_2020_imipenem– absolute, not BSA-normalised, eGFR. The covariate is CKD-EPI multiplied by BSA, in mL/min. Supplying a standard mL/min/1.73 m^2 eGFR understates the ratio for anyone larger than 1.73 m^2. -
Dong_2019_imipenem– allometric exponents left unwrapped. The 0.75 on clearance and 1 on volume may well have been fixed rather than estimated, but the review reports no standard errors and does not say, so they are not wrapped infixed(). The same applies toDao_2022_imipenem. -
Truong_2025_imipenem– dose not reported. The review records “NR” for this study’s dosage and says so explicitly in its Results. The steady-state table above therefore assumes a regimen for this model rather than reproducing the study’s own. -
Truong_2025_imipenem– all-male cohort. Table 1 records the sex split as 151/0. Unusual enough to warrant re-checking against the primary; it would make sex unidentifiable by construction rather than merely non-significant. -
Jaruratanasirikul_2021_imipenem– the source disagrees with itself about the central volume. Table 2 printsV1: 13.6 L, while the Table 3 covariate formula readsV1 = 13.8 - 0.348 x (ABW - 60), i.e. an intercept of 13.8 L at the referenceABWof 60 kg. The formula intercept is encoded, because it is the quantity the covariate term is conditioned on: pairing the Table 2 value with the Table 3 slope would shift every predicted volume by a constant 0.2 L and break the reference-subject identity that Gate 2 tests. The discrepancy is 1.5%. Clearance has no such conflict – Table 2 and the Table 3 intercept agree exactly at 13.3 L/h – which is mild evidence that the 13.6 is the slip. -
Jaruratanasirikul_2021_imipenem– the volume term has a bounded domain and the model will not tell you when you leave it.V1is linear inABWwith a negative slope, so it falls to zero atABW = 60 + 13.8/0.348 = 99.7 kgand is negative above that. The study’s own cohort is light (median total body weight 62.9 kg, IQR 52.8-70.0), so the term was fitted far from the zero-crossing; do not simulate this model at obese adjusted body weights. The clearance term is linear too but with a positive slope, so it has no reachable zero-crossing. This is the same failure shape as the two centred linear age terms inDao_2022_imipenemnoted above. -
Jaruratanasirikul_2021_imipenem– ABW is a newly ratified canonical, and its formula is not in the source.ABW(adjusted body weight) was added toinst/references/covariate-columns.mdwith this extraction as its founding example. Neither the review nor its Table 3 footnote – which glosses only “ABW, adjusted body weight” – states which ideal-body-weight formula or which interpolation factor the primary used. The conventionalIBW + 0.4 x (TBW - IBW)is recorded in the register and in the model file as the usual convention, explicitly not as a value read from this source. A user driving this model must supplyABWon whatever scale the primary used, which means the primary is needed before the covariate can be reproduced exactly. -
Jaruratanasirikul_2021_imipenem– the most permissive covariate selection thresholds in the review. Forward inclusion atdOFV > 3.84(p < 0.05) and backward elimination atdOFV > 6.64(p < 0.01), against the10.828(p < 0.001) backward threshold used by, for example, Nguyen 2021. Both retained effects should be read with that in mind. The study’s headline negative result – that ECMO support, ECMO type, ECMO flow rate and ECMO duration were all screened and none retained – is correspondingly stronger, since it survived the easiest threshold to pass. -
Lafaurie_2023_imipenem_*– two files, not one. The review reports the neutropenic and recovered phases with separate structural values, separate IIV and separate residual error. A per-phase residual error is the signature of two independent fits rather than one model carrying a phase covariate, so they are shipped as two files.
What is not validated here
-
No published NCA comparison. The review reports no
Cmax, Tmax, AUC or half-life for any constituent study, so
nlmixr2lib::ncaComparisonTable()has nothing to compare against. Gates 1 and 2 are closed-form identities instead; Gate 3 reproduces the review’s own cross-study claims; Gate 5 is descriptive. - No observed data and no VPC. No study’s individual concentrations are available, and the review reproduces no goodness-of-fit or VPC figure in a digitisable form.
- The gates test the packaged encoding, not the review’s arithmetic. Gates 1 and 2 confirm that each model’s ODE system, covariate algebra and unit conversions deliver the clearance and volume printed in Table 2 at the reference subject. They cannot confirm that Table 2 itself faithfully reproduces the primary – only re-reading each primary can, which is what the “re-verify against the primary” notes ask for. The fidelity audit above is the closest available substitute, and it found the IIV-scale defect described there.