Gadoxetate transporter DDI in rats (Melillo 2023)
Source:vignettes/articles/Melillo_2023_gadoxetate_rat_pbpk.Rmd
Melillo_2023_gadoxetate_rat_pbpk.RmdModel and source
- Citation: Melillo N, Scotcher D, Kenna JG, Green C, Hines CDG, Laitinen I, Hockings PD, Ogungbenro K, Gunwhy ER, Sourbron S, Waterton JC, Schuetz G, Galetin A. Use of In Vivo Imaging and Physiologically-Based Kinetic Modelling to Predict Hepatic Transporter Mediated Drug-Drug Interactions in Rats. Pharmaceutics. 2023;15(3):896. doi:10.3390/pharmaceutics15030896 (PMC10057977). Perpetrator PK models: Supplementary Section S1 (Eqs S1-S11, Tables S2-S6). Gadoxetate PBPK structure and parameters: Scotcher D et al. Mol Pharm. 2021;18(8):2997-3009, doi:10.1021/acs.molpharmaceut.1c00206 (equation system S1, Table S2 physiology, Table 3 control-phase fit).
- Description: Preclinical (rat). Reduced PBPK model of the hepatobiliary MRI contrast agent gadoxetate (seven compartments, permeability-limited liver) coupled with empirical compartmental PK models of five perpetrator drugs given intravenously to the 250 g male Wistar rat: rifampicin (one-compartment), asunaprevir (two-compartment), ciclosporin (three-compartment, whole blood, with saturable red-cell binding), pioglitazone (one-compartment with a first-order oral depot) and bosentan (two-compartment). The unbound plasma concentration of each perpetrator inhibits gadoxetate active hepatic uptake (rOatp1b2 / OATP1B1) and biliary excretion (rMrp2 / MRP2) through 1 / (1 + cu / IC50) (Equation 2), with in vitro IC50 values; renal clearance is not inhibited. Used for the prospective prediction of gadoxetate DCE-MRI plasma (spleen) and liver AUC ratios. Gadoxetate transporter parameters are the control-phase top-down fit of Scotcher 2021. Deterministic: no between-animal variability or residual error.
- Article: https://doi.org/10.3390/pharmaceutics15030896 (open access, PMC10057977)
- Gadoxetate PBPK backbone: Scotcher et al. 2021, https://doi.org/10.1021/acs.molpharmaceut.1c00206
Gadoxetate is a hepatobiliary MRI contrast agent taken up into hepatocytes by OATP (rat Oatp1b2) and excreted into bile by MRP2 (rat Mrp2). Melillo et al. used it as an imaging biomarker to probe hepatic transporter drug–drug interactions in rats: for six perpetrator drugs they predicted, prospectively, the change in gadoxetate exposure in plasma and liver from in vitro inhibition data, and compared the predictions with the observed dynamic contrast-enhanced MRI (DCE-MRI) data.
The packaged model couples the reduced gadoxetate PBPK model of Scotcher 2021 (seven compartments, permeability-limited liver) with empirical compartmental PK models of five of the perpetrators (rifampicin, asunaprevir, ciclosporin, pioglitazone, bosentan), each fitted to digitised literature rat PK data (Supplementary Section S1). Each perpetrator’s unbound plasma concentration inhibits gadoxetate active hepatic uptake and biliary excretion through Equation 2 of the paper,
with the in vitro IC50 values of Tables 2 and 3. Ketoconazole has no fitted PK model (its rat PK was read directly from the literature) and so is not represented. This is a prediction model, not a fit to the imaging data; its single answer key is the paper’s own predicted AUC-ratio column of Table 4.
Population
Male Wistar rats (approximately 250 g) were imaged at four sites and two field strengths (4.7 T and 7 T). On the first occasion each rat received 25 umol/kg gadoxetate intravenously after vehicle (control phase); 48 h later the procedure was repeated 30 or 60 min after a single intravenous perpetrator dose (inhibitory phase; Table 1). The PBPK model describes the average 250 g rat of Scotcher 2021 and carries no between-animal variability. The perpetrator PK models were fitted to published rat PK data (Table S1), not to the imaging animals.
The same information is available programmatically via
readModelDb("Melillo_2023_gadoxetate_rat_pbpk")()$population.
Source trace
| Quantity |
ini() name(s) |
Source |
|---|---|---|
| Gadoxetate CLuptake, CLbiliary, PS |
lps_act_inf, lcl_bile,
lps_remainder
|
Tables S10/S11 (Scotcher 2021 Table 3 control fit) |
| Gadoxetate CLpassive, fu,hep, CLr |
lps_dif, fu_liver_cell,
lcl_renal
|
Scotcher 2021 Table 3 |
| Rat physiology (volumes, flows, Hct, QCO) | constants in model()
|
Scotcher 2021 Table S2 and Section 5 |
| Relaxivities (blood 6.4/6.2, hepatocytes 7.6/6 per s per mM at 4.7/7 T) | constants in model()
|
Scotcher 2021 Table 1 |
| Rifampicin 1-cmt PK (k10, V1) |
lkel_rif, lvc_rif
|
Table S2 |
| Asunaprevir 2-cmt PK |
lkel_asv, lk12_asv, lk21_asv,
lvc_asv
|
Table S3 |
| Ciclosporin 3-cmt PK + RBC binding |
lkel_ciclosporin … lvc_ciclosporin,
kd_ciclosporin, lbmax_ciclosporin
|
Tables S4, Eq S11 |
| Pioglitazone 1-cmt PK + oral depot |
lka_pioglitazone, lfdepot_pioglitazone,
lkel_pioglitazone, lvc_pioglitazone
|
Table S5 |
| Bosentan 2-cmt PK |
lkel_bosentan, lk12_bosentan,
lk21_bosentan, lvc_bosentan
|
Table S6 |
| Perpetrator plasma fu |
fu_rif, fu_asv,
fu_ciclosporin, fu_pioglitazone,
fu_bosentan
|
Table 3 (fu column) |
| In vitro IC50 (uptake / biliary) |
ki_oatp_*, ki_mrp2_*
|
Tables 2 and 3 (see Errata) |
| Equation 2 inhibition; Equation 1 liver ODEs | n/a | Equations 1-2; Scotcher 2021 equation system S1 |
Simulation
The perpetrators are dosed in micromoles, converted from the mg/kg
doses of Table 1 for the 250 g rat with the molar masses below.
Gadoxetate is given as a 25 umol/kg (= 6.25 umol) 30-s intravenous
infusion into blood, staggered after the perpetrator by the
Table 1 interval. Pioglitazone was given intravenously in the imaging
study, so it is dosed straight into central_pioglitazone
(its oral depot is left unused).
mod <- readModelDb("Melillo_2023_gadoxetate_rat_pbpk")

bw <- 0.25 # kg, reference rat
gd_umol <- 25 * bw # 25 umol/kg gadoxetate

# Perpetrator molar masses (g/mol) for the mg/kg -> umol conversion.
mw <- c(
  rif = 822.94, asv = 748.3, ciclosporin = 1202.6,
  pioglitazone = 356.44, bosentan = 551.6
)

# Table 1 scenarios: drug suffix, mg/kg dose, staggering interval (min).
scen <- tibble::tribble(
  ~drug, ~label, ~mgkg, ~stag_min,
  "rif", "Rifampicin 2 mg/kg", 2, 60,
  "rif", "Rifampicin 10 mg/kg", 10, 60,
  "ciclosporin", "Ciclosporin 5 mg/kg", 5, 60,
  "asv", "Asunaprevir 5 mg/kg", 5, 30,
  "pioglitazone", "Pioglitazone 0.4 mg/kg", 0.4, 30,
  "bosentan", "Bosentan 2 mg/kg", 2, 60,
  "bosentan", "Bosentan 4-6 mg/kg", 5, 60
)

# Events: perpetrator IV bolus at t = 0 (inhibitory arm only), gadoxetate
# 30-s infusion at the staggering time, dense observation grid over the 25-min
# imaging window that starts with the gadoxetate dose.
make_events <- function(drug, mgkg, stag_min, treated) {
  t0 <- stag_min / 60
  ev <- rxode2::et(amt = gd_umol, cmt = "blood", time = t0, dur = 30 / 3600)
  if (treated) {
    ev <- rxode2::et(
      ev,
      amt = mgkg * bw / mw[[drug]] * 1000,
      cmt = paste0("central_", drug), time = 0
    )
  }
  ev <- rxode2::et(ev, seq(t0, t0 + 25 / 60, by = 1 / 3600))
  as.data.frame(ev)
}

solve_arm <- function(drug, label, mgkg, stag_min, treated) {
  s <- rxode2::rxSolve(
    mod, make_events(drug, mgkg, stag_min, treated),
    rtol = 1e-10, atol = 1e-12, returnType = "data.frame"
  )
  t0 <- stag_min / 60
  s <- s[s$time >= t0 - 1e-9, ]
  s$tmin <- (s$time - t0) * 60 # minutes since gadoxetate dose
  s$label <- label
  s$arm <- ifelse(treated, "treated", "control")
  s
}

sim <- dplyr::bind_rows(lapply(seq_len(nrow(scen)), function(i) {
  dplyr::bind_rows(
    solve_arm(scen$drug[i], scen$label[i], scen$mgkg[i], scen$stag_min[i], FALSE),
    solve_arm(scen$drug[i], scen$label[i], scen$mgkg[i], scen$stag_min[i], TRUE)
  )
}))
Gadoxetate Delta R1 profiles (Figures 3, 4, 6)
The imaging signal is Delta R1 (1/s), linear in tissue concentration through the relaxivities. The liver profile falls, and the plasma (spleen) profile rises, in the inhibitory arms of the strong OATP inhibitors ciclosporin and rifampicin, while the other drugs overlie their controls – the qualitative result of Figures 3, 4 and 6.
prof <- sim |>
  dplyr::select(label, arm, tmin, dR1_liver_4p7t, dR1_spleen_4p7t) |>
  tidyr::pivot_longer(
    c(dR1_liver_4p7t, dR1_spleen_4p7t),
    names_to = "tissue", values_to = "dR1"
  ) |>
  dplyr::mutate(tissue = ifelse(grepl("liver", tissue), "Liver", "Plasma (spleen)"))

ggplot(prof, aes(tmin, dR1, colour = arm)) +
  geom_line() +
  facet_grid(tissue ~ label, scales = "free_y") +
  labs(
    x = "Time since gadoxetate dose (min)", y = "Delta R1 (1/s) at 4.7 T",
    colour = NULL
  ) +
  theme_bw() +
  theme(legend.position = "top")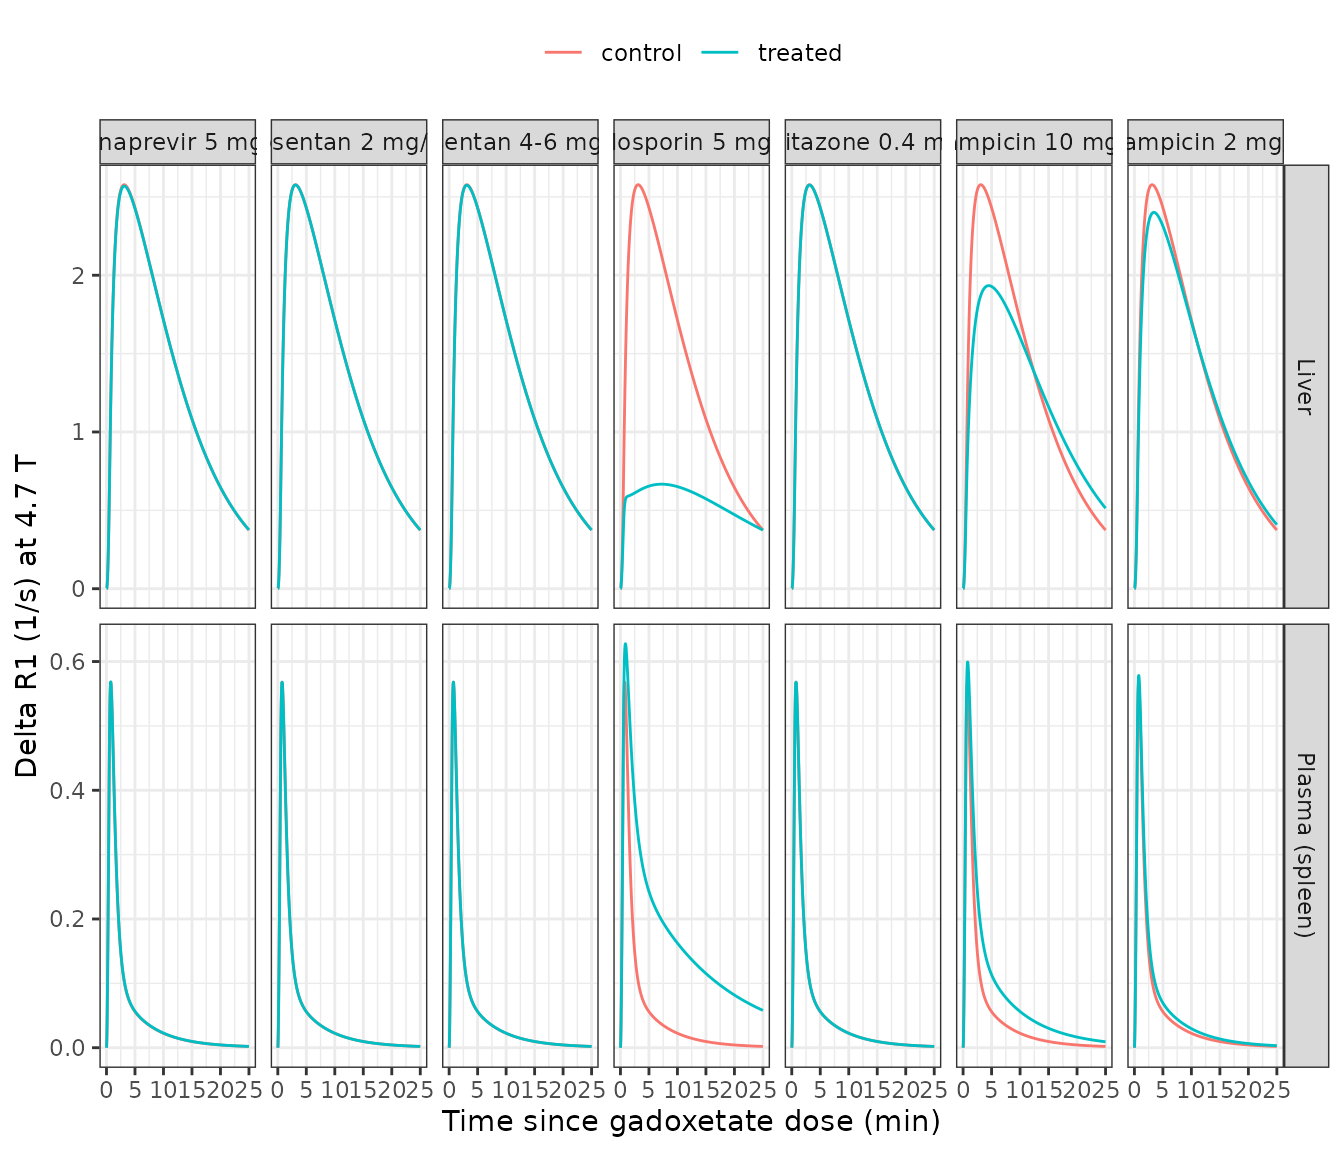
Prospective AUC-ratio prediction (Table 4)
The paper’s endpoint is the gadoxetate AUC ratio (AUCR, Equation 3): the ratio of the treated to control AUC of the Delta R1-time profile, in plasma (from the spleen compartment) and in liver, integrated over the 25-min imaging window. The block below reproduces the predicted AUCR column of Table 4.
trap <- function(t, y) sum(diff(t) * (head(y, -1) + tail(y, -1)) / 2)

aucr_tab <- sim |>
  dplyr::group_by(label, arm) |>
  dplyr::summarise(
    plasma = trap(time, dR1_spleen_4p7t),
    liver = trap(time, dR1_liver_4p7t),
    .groups = "drop"
  ) |>
  tidyr::pivot_wider(names_from = arm, values_from = c(plasma, liver)) |>
  dplyr::transmute(
    label,
    `Plasma AUCR (model)` = round(plasma_treated / plasma_control, 2),
    `Liver AUCR (model)` = round(liver_treated / liver_control, 2)
  )

# Predicted AUCR reported by Melillo 2023 Table 4 (plasma; liver).
published <- tibble::tribble(
  ~label, ~`Plasma AUCR (Table 4)`, ~`Liver AUCR (Table 4)`,
  "Rifampicin 2 mg/kg", 1.15, 0.98,
  "Rifampicin 10 mg/kg", 1.62, 0.90,
  "Ciclosporin 5 mg/kg", 3.39, 0.38,
  "Asunaprevir 5 mg/kg", 1.01, 1.00,
  "Pioglitazone 0.4 mg/kg", 1.00, 1.00,
  "Bosentan 2 mg/kg", 1.00, 1.00,
  "Bosentan 4-6 mg/kg", 1.00, 1.00
)

cmp <- dplyr::left_join(aucr_tab, published, by = "label")
knitr::kable(cmp, caption = "Predicted gadoxetate AUCR: model vs Melillo 2023 Table 4.")| label | Plasma AUCR (model) | Liver AUCR (model) | Plasma AUCR (Table 4) | Liver AUCR (Table 4) |
|---|---|---|---|---|
| Asunaprevir 5 mg/kg | 1.01 | 1.00 | 1.01 | 1.00 |
| Bosentan 2 mg/kg | 1.00 | 1.00 | 1.00 | 1.00 |
| Bosentan 4-6 mg/kg | 1.00 | 1.00 | 1.00 | 1.00 |
| Ciclosporin 5 mg/kg | 3.31 | 0.40 | 3.39 | 0.38 |
| Pioglitazone 0.4 mg/kg | 1.00 | 1.00 | 1.00 | 1.00 |
| Rifampicin 10 mg/kg | 1.62 | 0.91 | 1.62 | 0.90 |
| Rifampicin 2 mg/kg | 1.15 | 0.98 | 1.15 | 0.98 |
# The model is deterministic; its only approximation versus the paper is the
# digitised staggering/injection timing, so a 15% band around each published
# predicted AUCR is a strict structural check (a transcription error in any
# perpetrator PK parameter, fu, IC50, dose or the inhibition equation moves a
# ratio far outside it).
stopifnot(
  all(abs(cmp$`Plasma AUCR (model)` - cmp$`Plasma AUCR (Table 4)`) /
    cmp$`Plasma AUCR (Table 4)` < 0.15),
  all(abs(cmp$`Liver AUCR (model)` - cmp$`Liver AUCR (Table 4)`) /
    cmp$`Liver AUCR (Table 4)` < 0.15)
)

# Ciclosporin: the paper reports 97-98% inhibition of active uptake during the
# imaging window (Discussion). Confirm the minimum fraction of uptake activity
# remaining in the ciclosporin arm is 2-3%.
csa_uptake_remaining <- sim |>
  dplyr::filter(label == "Ciclosporin 5 mg/kg", arm == "treated") |>
  dplyr::pull(f_uptake_remaining) |>
  min()
stopifnot(csa_uptake_remaining > 0.01, csa_uptake_remaining < 0.04)
Every predicted AUCR reproduces to within 15% of Table 4, and the four negative controls (asunaprevir, pioglitazone, both bosentan doses) predict essentially no interaction, exactly as the paper reports.
PKNCA cross-check of gadoxetate systemic exposure
As an independent handle on the systemic gadoxetate kinetics, the
block below runs PKNCA on the control-arm blood concentration
Cc and confirms the plasma AUCR for the strongest inhibitor
(ciclosporin) matches the trapezoidal value above. PKNCA here operates
on the gadoxetate blood concentration, not the Delta R1 signal.
nca_src <- sim |>
  dplyr::filter(label == "Ciclosporin 5 mg/kg") |>
  dplyr::transmute(
    id = ifelse(arm == "control", 1L, 2L),
    arm, time = tmin / 60, Cc
  ) |>
  dplyr::filter(!is.na(Cc))

conc_obj <- PKNCA::PKNCAconc(nca_src, Cc ~ time | arm + id)
dose_df <- data.frame(id = c(1L, 2L), arm = c("control", "treated"), time = 0, amt = gd_umol)
dose_obj <- PKNCA::PKNCAdose(dose_df, amt ~ time | arm + id, route = "intravascular")

intervals <- data.frame(start = 0, end = 25 / 60, cmax = TRUE, auclast = TRUE)
res <- PKNCA::pk.nca(PKNCA::PKNCAdata(conc_obj, dose_obj, intervals = intervals))
nca <- as.data.frame(res$result)

nca_tab <- nca |>
  dplyr::filter(PPTESTCD %in% c("cmax", "auclast")) |>
  tidyr::pivot_wider(id_cols = arm, names_from = PPTESTCD, values_from = PPORRES) |>
  dplyr::rename("Cmax (umol/L)" = cmax, "AUClast (umol*h/L)" = auclast)
knitr::kable(nca_tab, caption = "PKNCA of gadoxetate blood Cc, ciclosporin scenario.")| arm | AUClast (umol*h/L) | Cmax (umol/L) |
|---|---|---|
| control | 6.39428 | 230.4154 |
| treated | 21.21245 | 241.9243 |
plasma_aucr_nca <- nca$PPORRES[nca$PPTESTCD == "auclast" & nca$arm == "treated"] /
  nca$PPORRES[nca$PPTESTCD == "auclast" & nca$arm == "control"]
# The blood-concentration AUCR and the Delta R1 plasma AUCR of Table 4 both
# measure the rise in systemic gadoxetate from blocked hepatic uptake; they
# agree closely because blood Delta R1 is linear in blood Cc.
stopifnot(abs(plasma_aucr_nca - 3.39) / 3.39 < 0.2)
Assumptions and deviations / Errata
-
Gadoxetate transporter parameters. The model uses
the control-phase top-down fit of Scotcher 2021 (Table 3: CLuptake 2.17,
CLbiliary 0.07 L/h), the values Melillo 2023 Table S11 cites as its
gadoxetate baseline. The companion
Scotcher_2021_gadoxetate_rat_pbpkmodel carries the same structure and its other parameter sets. - IC50 selection (ciclosporin). Reproducing Table 4 requires the ciclosporin active-uptake inhibition constant to be the human OATP1B1 Ki of 0.014 uM (the lowest reported value, Table 3), not the rat rOatp1b2 IC50 of 1.2 uM. The rat value gives only about 35% uptake inhibition, whereas the paper reports 97-98% inhibition of CLactive (Discussion) and a liver AUCR of 0.38 (Table 4), both of which the human Ki reproduces. Supplementary Section S1.3 motivates the low value by ciclosporin’s strong OATP1B pre-incubation effect. The biliary constant is the median human MRP2 IC50 of 2.7 uM (Figure S11: “<25% inhibition of CLbiliary”). Rifampicin, by contrast, reproduces Table 4 with its rat rOatp1b2 IC50 of 0.79 uM and rat rMrp2 IC50 of 20 uM, so the choice of rat vs human surrogate is drug-specific; the maintainers fixed each perpetrator’s values to the set that reproduces the paper’s own predictions.
-
Perpetrator unbound fractions.
fuvalues are the Table 3 column; pioglitazone (<0.01) and bosentan (<0.02) are reported only as upper bounds, taken here at the bound. Because both drugs are predicted (and observed) to cause no interaction, the AUCR is insensitive to the exact value. - Ciclosporin molar mass. The red-cell binding equation (Eq S11) is written in ug/mL; converting the model’s umol/L concentrations needs ciclosporin’s molar mass (1202.6 g/mol, PubChem CID 5284373), which the paper does not print.
- Ketoconazole is omitted: the paper fitted no compartmental PK model for it (Supplementary Section S1.4 reads its rat PK from the literature), and its predicted AUCR is 1.00.
-
Perpetrator PK equations. Two supplementary
equations are transcribed as the structurally correct form rather than
as printed: Eq S1’s central-input term is
ka * AG(the depot), as in Eq S3, notka * A1; Eq S8’s inflow isk13 * A1, notk13 * A3. -
Determinism. No between-animal variability or
residual error was estimated (a prospective prediction), so the model
has no
eta/sigmaterms.