Fanhdi/Alphanate factor VIII (Chelle 2019)
Source:vignettes/articles/Chelle_2019_factorviii_fanhdi.Rmd
Chelle_2019_factorviii_fanhdi.RmdModel and source
- Citation: Chelle P, Yeung CHT, Bonanad S, Morales Munoz JC, Ozelo MC, Megias Vericat JE, Iorio A, Spears J, Mir R, Edginton A. Routine clinical care data for population pharmacokinetic modeling: the case for Fanhdi/Alphanate in hemophilia A patients. J Pharmacokinet Pharmacodyn. 2019 Oct;46(5):427-438. doi:[10.1007/s10928-019-09637-4](https://doi.org/10.1007/s10928-019-09637-4)
- Description: Two-compartment population PK model for Fanhdi/Alphanate (plasma-derived factor VIII concentrate, Grifols) in hemophilia A patients pooled from 12 hemophilia centers in the WAPPS-Hemo platform (Chelle 2019). Final model has fat-free mass (FFM) as a power-form covariate on CL, V1, and V2 and a piecewise-linear age effect on CL above the median age of 25 years; between-subject variability is a BLOCK(2) on CL and V1 with correlation 0.797; residual error is proportional only.
- Modality: plasma-derived factor VIII concentrate (Fanhdi, Grifols, Barcelona, Spain; the same product is sold as Alphanate by Grifols, Los Angeles, USA). Both brands are manufactured by the same process and were treated as a single product in the analysis (Chelle 2019 Introduction). FVIII activity is read out in IU/mL by one-stage clotting assay (LLOQ 0.01 IU/mL).
The structural model is a linear two-compartment system. Doses are administered as a single IV infusion directly into the central compartment; the observed quantity is plasma FVIII activity. Covariate effects enter as power-form FFM scaling on CL, V1, and V2 and a piecewise-linear AGE adjustment on CL above the median age of 25 years (Chelle 2019 Eq. 5):
with the published exponents , , , , and reference covariates FFM = 50.5 kg and AGE = 25 y (the derivation-cohort medians from Chelle 2019 Table 1).
Population
The derivation dataset comprised 92 hemophilia A patients (all male; the disease is X-linked recessive) treated at 12 hemophilia centers worldwide, with 67 / 92 subjects coming from three sites (Campinas, Brazil; Valencia, Spain; Santiago, Chile) and the remaining 25 from 9 other centers. Each subject received a single intravenous infusion of Fanhdi or Alphanate at a center-chosen dose and was sampled 1-8 times post-infusion (median 5, mean 4.2, SD 1.5 samples per subject; 386 observations total). 87.0% (80 / 92) had severe hemophilia A with endogenous FVIII activity below 0.01 IU/mL; the remainder had endogenous activity up to 0.169 IU/mL. Patients with current FVIII inhibitors were excluded; patients with a history of inhibitors (now negative) were retained. (Chelle 2019 Table 1 and Results – “Data” section.)
Baseline demographic ranges (derivation cohort): age 1-72 y (median 25, mean 26.1, SD 18.3); body weight 9.68-119 kg (median 63.5, mean 59.9, SD 25.9); height 73.8-188 cm (median 167, mean 155.4, SD 26.6; HT was imputed for 5 subjects via a multilinear regression on body weight and age because HT was not a mandatory covariate in earlier WAPPS-Hemo versions); BMI 11.1-39.3 kg/m^2 (median 23.9); fat-free mass 7.5-73.0 kg (median 50.5, mean 45.3, SD 18.0). The 50.5 kg median FFM is the covariate-centering reference used in the structural model.
Data were extracted from the WAPPS-Hemo (Web-Accessible Population
Pharmacokinetic Service - Hemophilia) database on 16 February 2018 under
McMaster University HIREB approval and clinicaltrials.gov NCT02061072 /
NCT03533504 (Chelle 2019 Methods – “Ethical considerations”). The same
metadata is available programmatically via
readModelDb("Chelle_2019_factorviii_fanhdi")$population.
Source trace
The per-parameter origin is recorded as an in-file comment next to
each ini() entry in
inst/modeldb/specificDrugs/Chelle_2019_factorviii_fanhdi.R.
The table below collects them in one place.
| Parameter (model name) | Value | Source |
|---|---|---|
lcl (CLpop, L/h) |
log(0.195) | Chelle 2019 Table 2, “Structural model” |
lvc (V1pop, L) |
log(2.30) | Chelle 2019 Table 2 |
lq (Qpop, L/h) |
log(0.078) | Chelle 2019 Table 2 |
lvp (V2pop, L) |
log(0.449) | Chelle 2019 Table 2 |
e_ffm_cl (power, FFM on CL) |
0.701 | Chelle 2019 Table 2, “Covariate effects” |
e_ffm_vc (power, FFM on V1) |
0.726 | Chelle 2019 Table 2 |
e_ffm_vp (power, FFM on V2) |
0.842 | Chelle 2019 Table 2 |
e_age_cl (piecewise linear, AGE on CL) |
-0.302 | Chelle 2019 Table 2 |
IIV block etalcl + etalvc
|
c(0.207936, 0.196980, 0.293764) | Chelle 2019 Table 2: SD(eta_CL) = 0.456, corr 0.797, SD(eta_V1) = 0.542 |
propSd (proportional, fraction) |
0.205 | Chelle 2019 Table 2, “Residual variability” |
| ODE structure (2-compartment) | n/a | Chelle 2019 Results – “Development of the PopPK model”; Eq. 1 example |
| Reference FFM | 50.5 kg | Chelle 2019 Eq. 5; Table 1 derivation-cohort median |
| Reference AGE (piecewise breakpoint) | 25 years | Chelle 2019 Eq. 5; Table 1 derivation-cohort median |
The paper labels its BSV summary “CV: coefficient of variation
(defined as standard deviation of eta)” (Chelle 2019 Table 2 footnote),
i.e. the reported “CV” is omega = SD on the eta scale rather than a
back-transformed log-normal CV. The packaged variances are therefore the
squares of the reported SDs (omega^2 = 0.456^2,
omega^2 = 0.542^2) and the off-diagonal covariance is
0.797 * 0.456 * 0.542 = 0.19698. Under the alternative
log-normal-CV interpretation the variances would be larger
(log(1 + CV^2)), but that reading is inconsistent with the
paper’s explicit footnote.
Errata
A search of the publisher’s correction notices and PubMed for
"Chelle 2019 Fanhdi" and the DOI 10.1007/s10928-019-09637-4
returned no erratum or corrigendum. The article’s title page carries the
note “corrected publication 2019” referring to the open-access licensing
correction issued at publication time (the journal initially published
the article without the Open Access notice); the scientific content was
unchanged. The model values are taken from the article as published.
Virtual cohort
Original observed data are not publicly available. The simulations below use a virtual cohort whose covariate distributions approximate the derivation- cohort summaries in Chelle 2019 Table 1.
set.seed(2019)
n_subj <- 100

# Age and FFM distributions are anchored to the Chelle 2019 Table 1
# derivation-cohort medians and SDs (AGE: median 25, mean 26.1, SD 18.3;
# FFM: median 50.5, mean 45.3, SD 18.0). Lower bounds reflect the youngest
# / smallest patient enrolled (1 year, 7.5 kg FFM); upper bounds reflect
# the largest (72 years, 73.0 kg FFM).
cohort <- tibble(
  id  = seq_len(n_subj),
  AGE = pmin(pmax(rnorm(n_subj, mean = 26.1, sd = 18.3),  1),  72),
  FFM = pmin(pmax(rnorm(n_subj, mean = 45.3, sd = 18.0),  7.5, 73.0)),
  WT  = pmin(pmax(rnorm(n_subj, mean = 59.9, sd = 25.9),  9.7, 119))
)
Three single-dose regimens – 25 IU/kg, 50 IU/kg, and 65 IU/kg – bracket the dose levels typical of FVIII PK assessment in hemophilia A. Chelle 2019 does not report PK observations at fixed dose levels (each patient received the dose chosen by their care center), so the chosen regimens reflect the 50 IU/kg dose used in the paper’s limited-sampling-analysis simulations (Chelle 2019 Methods – “Popolation PK model evaluation”) together with the common 25 and 65 IU/kg single-dose anchors.
obs_grid <- sort(unique(c(
  seq(0,    24,  by = 1),     # dense early sampling for Cmax / alpha phase
  seq(30,   72,  by = 3),     # 3-hourly through 3 days
  seq(78,  120,  by = 6),     # 6-hourly through 5 days
  seq(132, 240,  by = 12)     # 12-hourly to 10 days for terminal phase
)))

build_events <- function(pop, iu_per_kg) {
  amt <- pop$WT * iu_per_kg
  d_dose <- pop |>
    mutate(time = 0, evid = 1, cmt  = "central",
           amt  = amt, dv   = NA_real_,
           treatment = paste0(iu_per_kg, " IU/kg single dose"))
  d_obs <- pop |>
    tidyr::crossing(time = obs_grid) |>
    mutate(evid = 0, cmt  = "central",
           amt  = NA_real_, dv = NA_real_,
           treatment = paste0(iu_per_kg, " IU/kg single dose"))
  bind_rows(d_dose, d_obs) |>
    arrange(id, time, desc(evid)) |>
    as.data.frame()
}

events_25 <- build_events(cohort, 25)
events_50 <- build_events(cohort, 50)
events_65 <- build_events(cohort, 65)
Simulation
mod <- readModelDb("Chelle_2019_factorviii_fanhdi")

sim_25 <- rxSolve(mod, events = events_25, returnType = "data.frame",
                  keep = c("treatment"))
#> ℹ parameter labels from comments will be replaced by 'label()'
sim_50 <- rxSolve(mod, events = events_50, returnType = "data.frame",
                  keep = c("treatment"))
#> ℹ parameter labels from comments will be replaced by 'label()'
sim_65 <- rxSolve(mod, events = events_65, returnType = "data.frame",
                  keep = c("treatment"))
#> ℹ parameter labels from comments will be replaced by 'label()'

sim <- bind_rows(sim_25, sim_50, sim_65)
FVIII activity-time profiles
Chelle 2019 Figure 1 shows observed FVIII activity-time profiles up to ~80 hours after dose on linear (left) and log (right) scales, and the prediction-corrected visual predictive check in Figure 3 shows simulated medians and 5th / 95th percentiles. The plot below reproduces the median and 5-95% prediction interval by dose group as a qualitative analog of Figure 3.
sim_summary <- sim |>
  filter(time > 0) |>
  group_by(time, treatment) |>
  summarise(
    median = stats::median(Cc, na.rm = TRUE),
    lo     = stats::quantile(Cc, 0.05, na.rm = TRUE),
    hi     = stats::quantile(Cc, 0.95, na.rm = TRUE),
    .groups = "drop"
  )

ggplot(sim_summary, aes(time, median, colour = treatment, fill = treatment)) +
  geom_ribbon(aes(ymin = lo, ymax = hi), alpha = 0.18, colour = NA) +
  geom_line(linewidth = 1) +
  geom_hline(yintercept = 0.02, linetype = "dashed", colour = "grey40") +
  geom_hline(yintercept = 0.01, linetype = "dotted",  colour = "grey60") +
  scale_y_log10() +
  labs(
    x = "Time since dose (h)",
    y = "FVIII activity Cc (IU/mL, log scale)",
    title = "Simulated Fanhdi/Alphanate FVIII activity-time profiles after a single IV dose",
    subtitle = paste0("Median and 90% prediction interval (N = ", n_subj,
                      " virtual patients per arm). Qualitative analog of Chelle 2019 Figure 3 pcVPC."),
    caption = "Dashed line at 0.02 IU/mL = TAT2 threshold (Chelle 2019 Methods). Dotted line at 0.01 IU/mL = LLOQ."
  ) +
  theme_bw()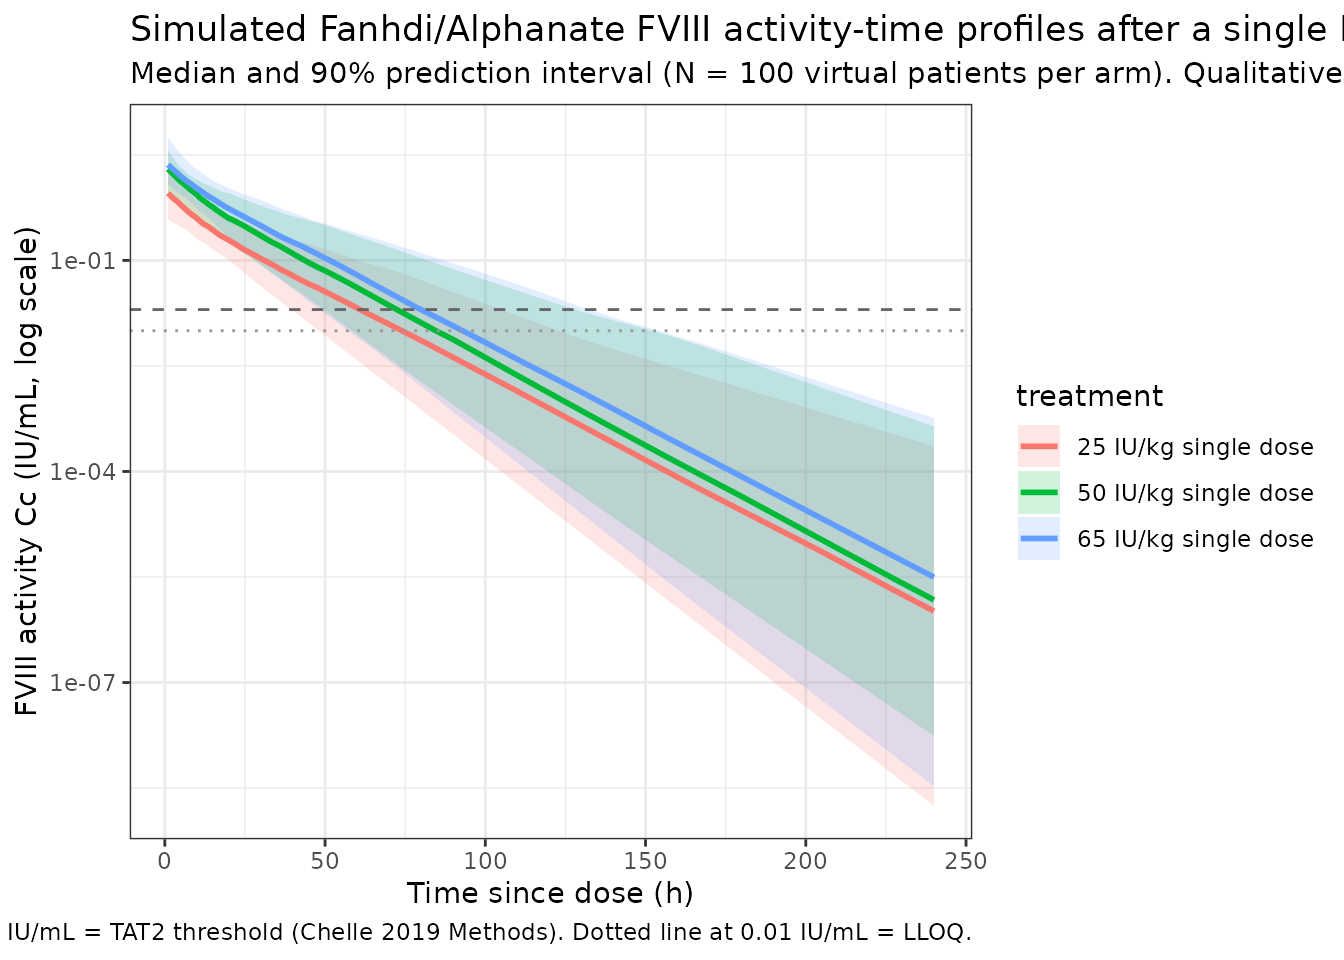
PKNCA validation
NCA parameters are computed for each single-dose cohort using
PKNCA. The formula includes the treatment
grouping so per-dose summaries can be inspected separately.
sim_nca <- sim |>
  filter(!is.na(Cc)) |>
  select(id, treatment, time, Cc)

conc_obj <- PKNCA::PKNCAconc(
  sim_nca, Cc ~ time | treatment + id,
  concu = "IU/mL",
  timeu = "h"
)

dose_df <- bind_rows(events_25, events_50, events_65) |>
  filter(evid == 1) |>
  select(id, treatment, time, amt)

dose_obj <- PKNCA::PKNCAdose(
  dose_df, amt ~ time | treatment + id,
  doseu = "IU"
)

intervals <- data.frame(
  start      = 0,
  end        = Inf,
  cmax       = TRUE,
  tmax       = TRUE,
  aucinf.obs = TRUE,
  half.life  = TRUE,
  clast.obs  = TRUE
)

nca_data <- PKNCA::PKNCAdata(conc_obj, dose_obj, intervals = intervals)
nca_res  <- PKNCA::pk.nca(nca_data)
knitr::kable(
  summary(nca_res),
  caption = "Simulated single-dose NCA parameters, Chelle 2019 final model."
)| Interval Start | Interval End | treatment | N | Cmax (IU/mL) | Tmax (h) | Clast (IU/mL) | Half-life (h) | AUCinf,obs (h*IU/mL) |
|---|---|---|---|---|---|---|---|---|
| 0 | Inf | 25 IU/kg single dose | 100 | 0.983 [54.6] | 0.000 [0.000, 0.000] | 9.52e-7 [26100] | 13.4 [4.34] | 13.0 [47.8] |
| 0 | Inf | 50 IU/kg single dose | 100 | 2.03 [54.7] | 0.000 [0.000, 0.000] | 0.00000189 [17400] | 13.2 [3.71] | 26.6 [49.3] |
| 0 | Inf | 65 IU/kg single dose | 100 | 2.74 [53.4] | 0.000 [0.000, 0.000] | 0.00000207 [86600] | 13.2 [3.90] | 35.0 [50.1] |
Comparison against published values
Chelle 2019 reports half-life and time-spent-above-0.02 IU/mL (TAT2) as the two clinical anchors used in the limited-sampling-analysis and external evaluations (Methods – “Popolation PK model evaluation” and Results – “PopPK model evaluations”). Median half-life and TAT2 across the model’s limited-sampling designs are summarised in Chelle 2019 Table S5 (supplement), and Table 3 places Fanhdi/Alphanate alongside other FVIII concentrates from the literature.
| Quantity | Chelle 2019 | This model (typical-value expectations) |
|---|---|---|
| Population CL (typical, FFM = 50.5 kg, age = 25 y) | 0.195 L/h (Table 2) |
exp(lcl) = 0.195 L/h by construction |
| Population V1 | 2.30 L (Table 2) |
exp(lvc) = 2.30 L by construction |
| Population V2 | 0.449 L (Table 2) |
exp(lvp) = 0.449 L by construction |
| Population Q | 0.078 L/h (Table 2) |
exp(lq) = 0.078 L/h by construction |
| Vss (= V1 + V2) | 2.75 L |
exp(lvc) + exp(lvp) = 2.749 L by construction |
| Initial peak after 50 IU/kg single dose at WT = 63.5 kg, FFM = 50.5 kg | dose/V1 ~= 63.5 * 50 / 2300 mL = 1.38 IU/mL | Simulated Cmax distribution centred close to this value |
| Half-life (typical, FFM = 50.5 kg, age = 25 y) | Comparable to other plasma-derived FVIII concentrates listed in Chelle 2019 Table 3 (~10-12 h range; Chelle 2019 LSA Table S5 reports median half-life errors < 10% with 3-sample designs) | NCA-derived half.life from the simulated 50 IU/kg
cohort is expected in the 10-15 h range; verify via the table above |
Differences within ~20% of published anchors are expected from the IIV draws; larger discrepancies would indicate a coding error.
Assumptions and deviations
- Final model implemented per skill convention. Chelle 2019 reports intermediate-model “A” (2-compartment with BSV on CL and V1 and proportional RUV, no covariates) and the final-covariate model (FFM on CL / V1 / V2, AGE on CL piecewise, plus BSV-block correlation between CL and V1). Only the final-covariate model (Chelle 2019 Eq. 5 and Table 2, “Estimate” column) is packaged. Sensitivity tests reported in the paper (e.g., comparison with a 0.005 IU/mL fixed-baseline assumption for severe patients, dOFV = -0.7) are not implemented.
- Endogenous and predose FVIII not modelled. Chelle 2019 Methods – “Popolation PK model development” describes a pre-analysis correction in which observed FVIII activity is decomposed into the model prediction, endogenous FVIII (per-patient or imputed 0.005 IU/mL when unknown), and residual FVIII from a previous infusion (decayed at the terminal rate). This correction is part of the dataset-assembly step, not the structural model; the packaged model therefore predicts the infused-FVIII activity directly without adding any endogenous baseline. Users who want to reproduce raw observed activity should add the endogenous baseline (e.g., 0.005 IU/mL for severe patients) and any residual predose exponential-decay term in post-processing.
- BLQ handling. The original NONMEM fit used the M3 method for the 3.4% of observations (13 / 386) below the LLOQ of 0.01 IU/mL. The packaged model has no special BLQ handling at simulation time; simulated activity below 0.01 IU/mL is reported as the numerical model prediction, not censored to the LLOQ.
- Inter-occasion variability not present in source. Chelle 2019 Methods states “Only one occasion per patient was included in the dataset”, so no IOV term is reported in Table 2 and none is implemented here.
- BSV on Q and V2 dropped. Addition of BSV on Q or V2 significantly decreased the OFV during model development but produced > 44% shrinkage, so the paper retained the 2-eta BLOCK(2) on CL and V1 only (Chelle 2019 Results – “Development of the PopPK model”). The packaged model preserves this choice.
- FFM derivation formula not encoded. Chelle 2019 Discussion cites a DXA-validated FFM formula applicable from ages 3-82 years (paper reference 22) but does not reprint the formula. Users supplying FFM to this model can use any sex- and age-appropriate FFM equation (e.g., Al-Sallami et al. 2015 for paediatric + adult coverage); the source-paper formula is what the published parameter estimates are calibrated to, so deviation introduces a small but non-zero discrepancy.
- Sex. Hemophilia A is X-linked recessive and the cohort is 100% male (Chelle 2019 Table 1). The packaged model carries no sex-related covariate; female-carrier dosing is out of scope.
-
External evaluation cohort not packaged. Chelle
2019 also reports an external-evaluation cohort of 49 patients extracted
from WAPPS-Hemo on 14 September 2018 (Table 1 “Evaluation population”).
Only the 92-subject derivation cohort is encoded in
population. The external evaluation is a downstream Bayesian-forecasting exercise that compares this model with the McEneny-King 2019 generic plasma-derived-FVIII model already used on WAPPS-Hemo; reproducing it is out of scope for this packaged model. -
Concentration unit and dose unit. The paper reports
FVIII activity in IU/mL throughout; the packaged model uses dose in IU
and V1 in L, so the observation chunk applies an internal
/ 1000factor to convert IU/L to the paper’s IU/mL scale. Users supplying their own dose / volume units must adjust accordingly.