Model and source
- Citation: Zhao S, He N, Zhang Y, Wang C, Zhai S, Zhang C. Population Pharmacokinetic Modeling and Dose Optimization of Vancomycin in Chinese Patients with Augmented Renal Clearance. Antibiotics (Basel). 2021;10(10):1238. doi:10.3390/antibiotics10101238
- Description: Two-compartment IV population PK model for vancomycin in Chinese adult inpatients with renal function ranging from impaired to augmented renal clearance (Zhao 2021). Clearance is a sigmoid (Hill) function of Cockcroft-Gault creatinine clearance that saturates at a maximum of 5.58 L/h (CL = 5.58 x CrCl^1.5 / (93.8^1.5 + CrCl^1.5)); the central volume is 8.02 L in non-ICU and 35.7 L in ICU patients. Exponential inter-individual variability on CL and Vc; proportional residual error.
- Article (open access): https://doi.org/10.3390/antibiotics10101238
Zhao and colleagues fitted a two-compartment population PK model to routine vancomycin therapeutic-drug-monitoring data from Chinese adult inpatients whose renal function ranged from impaired to augmented renal clearance (ARC, creatinine clearance >= 130 mL/min). The distinguishing feature is the clearance model: vancomycin clearance rises with Cockcroft-Gault creatinine clearance along a sigmoid (Hill) curve that saturates at 5.58 L/h, rather than the linear or power relationship used by most vancomycin models. The authors report that the saturable form fitted better (OFV 1843.2) than linear (1864.2), exponential (1929.3) or power (1856.9) alternatives. The central volume is more than four times larger in ICU than in non-ICU patients.
Population
The model was estimated from 424 serum vancomycin concentrations in 209 adult inpatients at Peking University Third Hospital (Beijing) treated with intermittent intravenous vancomycin between January 2010 and June 2018 (Table 1). Mean age was 66.0 years (SD 16.4), mean total body weight 63.4 kg (SD 12.9), and 60.3% were male. 82 patients (39.2%) were ICU inpatients; 18.7% had shock and 3.3% multiple organ failure. The per-patient mean Cockcroft-Gault creatinine clearance had a median of 86.7 mL/min (range 18.4-390.7), and 51 patients (24.4%) met the ARC definition. The median daily dose was 1875 mg (IQR 1461.9-2352.0). Half the patients (49.3%) contributed a single concentration, and 69.3% of samples were drawn 5-12 h after the start of infusion. Patients with CrCl < 15 mL/min, renal replacement therapy, acute kidney injury, or admission to Hematology or the Surgical ICU were excluded.
The same information is available programmatically via
readModelDb("Zhao_2021_vancomycin")()$population.
Source trace
| Element | Value | Source location |
|---|---|---|
| Structure | Two-compartment, IV infusion | Section 2.2 (AIC 2089.5 vs 2162.9 for one compartment); Equations 1-4 |
| CL |
5.58 * CG^1.5 / (93.8^1.5 + CG^1.5) * exp(eta1)
L/h |
Equation 1 |
lclmax |
log(5.58) L/h | Table 2, ‘CL max’ 5.58 (RSE 17%) |
lcrcl50 |
log(93.8) mL/min | Table 2, ‘CG CLmax50’ 93.8 (RSE 24%); unit per Section 2.2 prose |
lhill |
log(1.5) | Table 2, ‘s’ 1.5 (RSE 14%) |
| Vc | 8.02 L non-ICU, 35.7 L ICU, * exp(eta2)
|
Equation 2 |
lvc |
log(8.02) L | Table 2, ‘V c non-ICU’ 8.02 (RSE 12%) |
e_dis_critill_vc |
log(35.7 / 8.02) | Table 2, ‘V c ICU’ 35.7 (RSE 13%) |
lq |
log(2.66) L/h | Table 2, ‘Q’ 2.66 (RSE 12%); Equation 3 |
lvp |
log(36.8) L | Table 2, ‘V p’ 36.8 (RSE 15%); Equation 4 |
etalclmax |
0.0771 (variance) | Table 2, ‘IIV CL’ 0.0771 (RSE 16%) |
etalvc |
0.223 (variance) | Table 2, ‘IIV V c’ 0.223 (RSE 56%) |
propSd |
sqrt(0.0466) = 0.2159 | Table 2, ‘Additive residual error’ 0.0466 (RSE 14%); Equation 6 proportional form |
| CRCL | Cockcroft-Gault creatinine clearance, mL/min | Equation 1 legend; Table 1 footnote |
| DIS_CRITILL | ICU admission (1 = ICU) | Section 2.2; Equation 2 |
Covariate relationships
The clearance and central-volume equations are checked against the
numbers the paper states in prose. Section 2.2 says clearance is
half-maximal at a creatinine clearance of 93.8 mL/min; the Abstract
gives a clearance of 3.46 to 5.58 L/h in ARC patients; the Discussion
says ARC patients have 1.3 to 2.1 times the clearance of patients with
normal kidney function (which the model reproduces with normal function
taken as 90 mL/min, i.e. 3.46 / 2.70 = 1.28 and
5.58 / 2.70 = 2.07), and the central volume is 35.7 L in
ICU versus 8.02 L in non-ICU patients.
mod <- rxode2::rxode2(readModelDb("Zhao_2021_vancomycin"))
#> ℹ parameter labels from comments will be replaced by 'label()'
mod_typ <- rxode2::zeroRe(mod)

crcl_grid <- c(15, 30, 60, 90, 93.8, 130, 180, 390.7, 1e5)
cov_df <- expand.grid(CRCL = crcl_grid, DIS_CRITILL = c(0, 1)) |>
  mutate(id = seq_len(n()))
ev_cov <- cov_df |>
  mutate(time = 0, evid = 0, amt = 0, cmt = "central")
typ <- rxode2::rxSolve(mod_typ, events = ev_cov, keep = c("CRCL", "DIS_CRITILL")) |>
  as.data.frame()
#> ℹ omega/sigma items treated as zero: 'etalclmax', 'etalvc'
#> Warning: multi-subject simulation without without 'omega'

cl_at <- function(x) {
  v <- unique(typ$cl[typ$CRCL == x])
  if (length(v) != 1L) stop("no unique clearance at CRCL = ", x)
  v
}
vc_at <- function(icu) {
  v <- unique(round(typ$vc[typ$DIS_CRITILL == icu], 8))
  if (length(v) != 1L) stop("no unique Vc for DIS_CRITILL = ", icu)
  v
}

checks <- tibble::tribble(
  ~Quantity, ~Model, ~Paper,
  "CL at CrCl = 93.8 mL/min (half of 5.58 L/h)", cl_at(93.8), 5.58 / 2,
  "CL at CrCl = 130 mL/min (ARC threshold)", cl_at(130), 3.46,
  "CL as CrCl -> infinity", cl_at(1e5), 5.58,
  "CL(130) / CL(90)", cl_at(130) / cl_at(90), 1.3,
  "CLmax / CL(90)", 5.58 / cl_at(90), 2.1,
  "Vc non-ICU (L)", vc_at(0), 8.02,
  "Vc ICU (L)", vc_at(1), 35.7
) |>
  mutate(`Difference (%)` = 100 * (Model / Paper - 1))

checks |>
  mutate(across(c(Model, Paper, `Difference (%)`), \(x) signif(x, 4))) |>
knitr::kable()| Quantity | Model | Paper | Difference (%) |
|---|---|---|---|
| CL at CrCl = 93.8 mL/min (half of 5.58 L/h) | 2.790 | 2.79 | 0.000000 |
| CL at CrCl = 130 mL/min (ARC threshold) | 3.460 | 3.46 | -0.011330 |
| CL as CrCl -> infinity | 5.580 | 5.58 | -0.002873 |
| CL(130) / CL(90) | 1.280 | 1.30 | -1.563000 |
| CLmax / CL(90) | 2.064 | 2.10 | -1.714000 |
| Vc non-ICU (L) | 8.020 | 8.02 | 0.000000 |
| Vc ICU (L) | 35.700 | 35.70 | 0.000000 |
stopifnot(
  # Exact identities of the Hill form and the ICU switch.
  abs(cl_at(93.8) / (5.58 / 2) - 1) < 1e-6,
  abs(vc_at(0) / 8.02 - 1) < 1e-6,
  abs(vc_at(1) / 35.7 - 1) < 1e-6,
  abs(cl_at(1e5) / 5.58 - 1) < 1e-3,
  # Prose values, printed to 3 and 2 significant figures respectively.
  abs(cl_at(130) - 3.46) < 0.005,
  abs(cl_at(130) / cl_at(90) - 1.3) < 0.05,
  abs(5.58 / cl_at(90) - 2.1) < 0.05
)
The curve below is the typical clearance across the creatinine-clearance range of the study population (compare the scatter of individual clearances in the paper’s Supplementary Figure S3).
curve_df <- data.frame(CRCL = seq(15, 390, by = 5), DIS_CRITILL = 0) |>
  mutate(id = seq_len(n()), time = 0, evid = 0, amt = 0, cmt = "central")
curve <- rxode2::rxSolve(mod_typ, events = curve_df, keep = "CRCL") |>
  as.data.frame()
#> ℹ omega/sigma items treated as zero: 'etalclmax', 'etalvc'
#> Warning: multi-subject simulation without without 'omega'

ggplot(curve, aes(CRCL, cl)) +
  geom_line() +
  geom_hline(yintercept = 5.58, linetype = "dashed") +
  geom_vline(xintercept = 130, linetype = "dotted") +
  labs(
    x = "Cockcroft-Gault creatinine clearance (mL/min)",
    y = "Typical vancomycin clearance (L/h)"
  ) +
  theme_bw()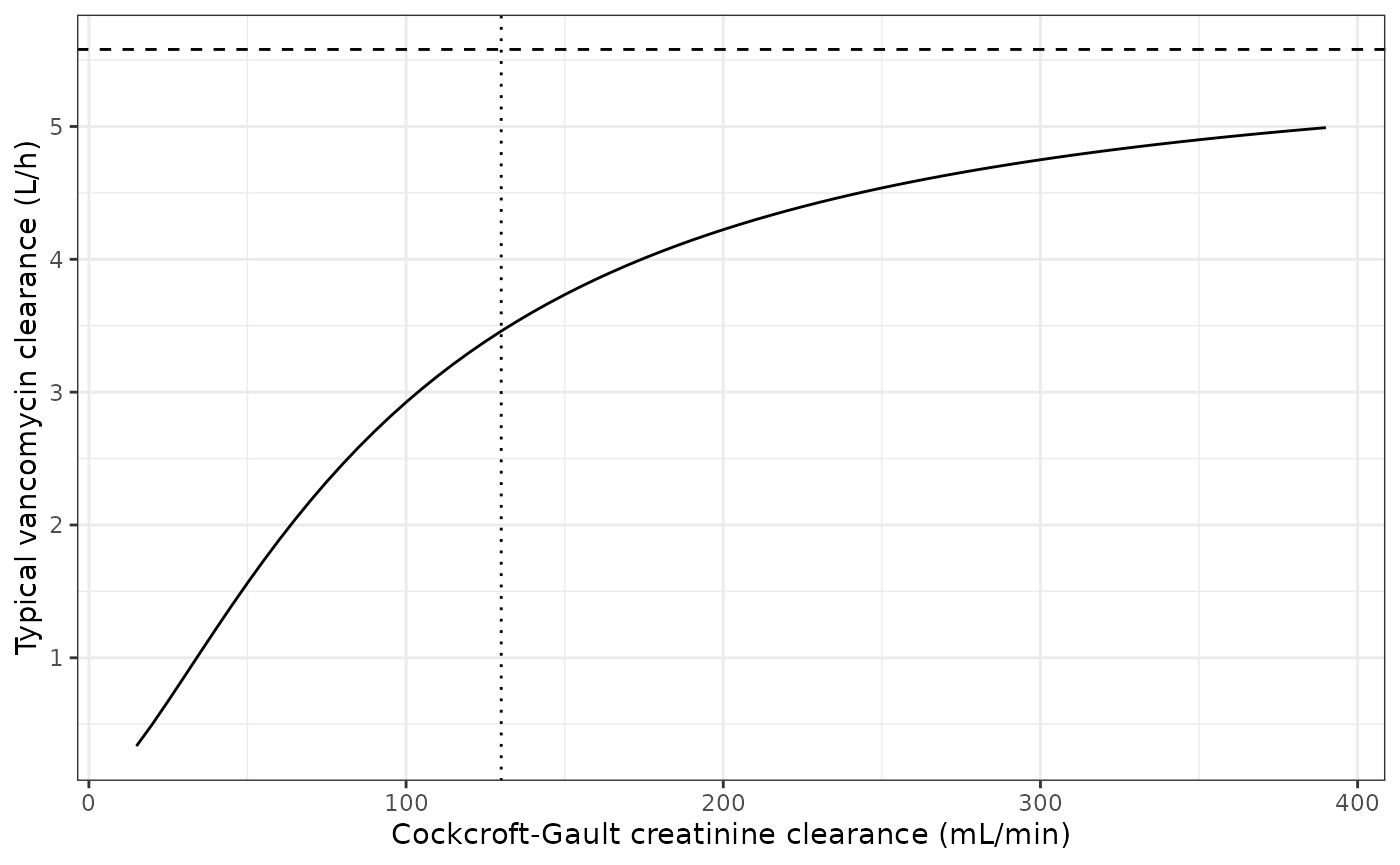
Typical vancomycin clearance versus Cockcroft-Gault creatinine clearance (compare Supplementary Figure S3 of Zhao 2021). Dashed line: the 5.58 L/h asymptote; dotted line: the 130 mL/min ARC threshold.
Typical-value concentration-time profiles
The paper does not report the infusion duration; a 1-h infusion is assumed throughout. The profiles below are for 1000 mg every 12 h at a creatinine clearance of 90 mL/min, for a non-ICU and an ICU patient. The larger ICU central volume lowers the peak and flattens the profile without changing the steady-state AUC, which depends on clearance alone.
obs_times <- sort(unique(c(seq(0, 1, by = 0.1), seq(1, 96, by = 0.5))))
ev_typ <- bind_rows(lapply(c(0, 1), function(icu) {
  rxode2::et(amt = 1000, rate = 1000, ii = 12, addl = 7, cmt = "central") |>
    rxode2::et(obs_times, cmt = "central") |>
    as.data.frame() |>
    mutate(id = icu + 1, CRCL = 90, DIS_CRITILL = icu)
}))
sim_typ <- rxode2::rxSolve(mod_typ, events = ev_typ, keep = "DIS_CRITILL") |>
  as.data.frame() |>
  mutate(group = ifelse(DIS_CRITILL == 1, "ICU", "non-ICU"))
#> ℹ omega/sigma items treated as zero: 'etalclmax', 'etalvc'
#> Warning: multi-subject simulation without without 'omega'

ggplot(sim_typ, aes(time, Cc, colour = group)) +
  geom_line() +
  geom_hline(yintercept = c(10, 20), linetype = "dotted") +
  labs(x = "Time (h)", y = "Vancomycin concentration (mg/L)", colour = NULL) +
  theme_bw()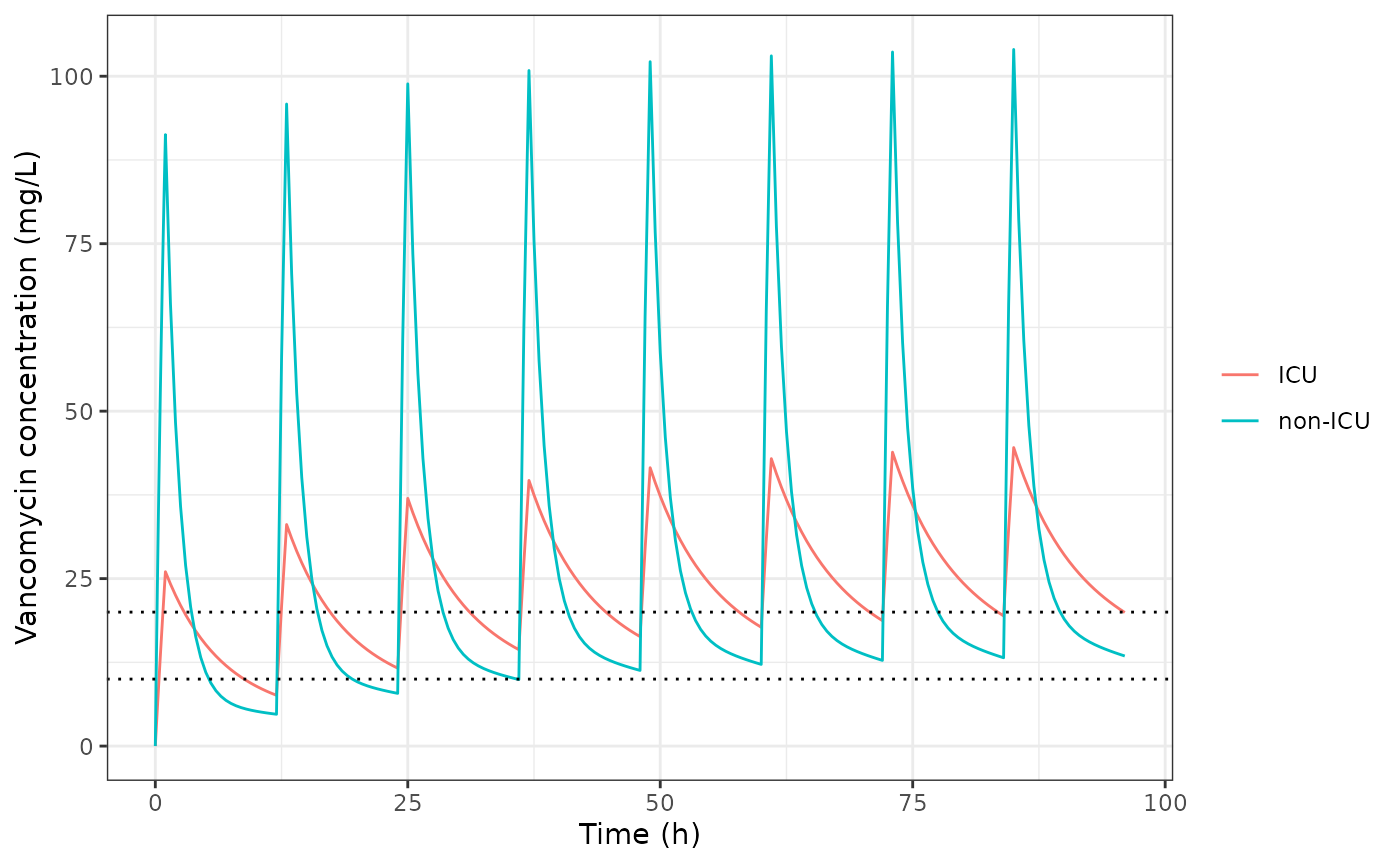
Typical-value vancomycin concentrations for 1000 mg every 12 h (1-h infusion) at a creatinine clearance of 90 mL/min, non-ICU versus ICU patients.
Virtual cohort and steady-state NCA
A virtual cohort of 200 non-ICU and 200 ICU patients is drawn with
creatinine clearance log-normal around the study median of 86.7 mL/min.
The log-scale SD of 0.585 reproduces the reported 24.4% of patients at
or above 130 mL/min
(log(130 / 86.7) / qnorm(1 - 0.244) = 0.585); draws outside
the observed 18.4-390.7 mL/min range are redrawn rather than clamped.
Each patient receives 1000 mg every 12 h as a 1-h infusion, simulated at
steady state.
set.seed(20211012)
rxode2::rxSetSeed(20211012)
n_per_arm <- 200

draw_crcl <- function(n) {
  out <- numeric(0)
  while (length(out) < n) {
    x <- exp(rnorm(n, log(86.7), 0.585))
    out <- c(out, x[x >= 18.4 & x <= 390.7])
  }
  out[seq_len(n)]
}

cohort <- data.frame(
  id = seq_len(2 * n_per_arm),
  DIS_CRITILL = rep(c(0, 1), each = n_per_arm),
  CRCL = draw_crcl(2 * n_per_arm)
) |>
  mutate(treatment = ifelse(DIS_CRITILL == 1, "ICU", "non-ICU"))

tau <- 12
ss_times <- sort(unique(c(seq(0, 1, by = 0.1), seq(1, tau, by = 0.25))))
ev_one <- rxode2::et(amt = 1000, rate = 1000, ii = tau, ss = 1, cmt = "central") |>
  rxode2::et(ss_times, cmt = "central") |>
  as.data.frame()
ev_cohort <- cohort |>
  tidyr::crossing(ev_one |> select(-any_of("id"))) |>
  arrange(id, time, desc(evid))

sim <- rxode2::rxSolve(
  mod,
  events = ev_cohort,
  keep = c("CRCL", "DIS_CRITILL", "treatment"),
  rtol = 1e-10, atol = 1e-12, ssRtol = 1e-10, ssAtol = 1e-12,
  maxsteps = 1e6
) |>
  as.data.frame()
stopifnot(!anyNA(sim$Cc), all(table(sim$id) == length(ss_times)))
sim |>
  group_by(treatment, time) |>
  summarise(
    p05 = quantile(Cc, 0.05), p50 = median(Cc), p95 = quantile(Cc, 0.95),
    .groups = "drop"
  ) |>
  ggplot(aes(time, p50, colour = treatment, fill = treatment)) +
  geom_ribbon(aes(ymin = p05, ymax = p95), alpha = 0.2, colour = NA) +
  geom_line() +
  labs(x = "Time after dose at steady state (h)", y = "Vancomycin concentration (mg/L)",
       colour = NULL, fill = NULL) +
  theme_bw()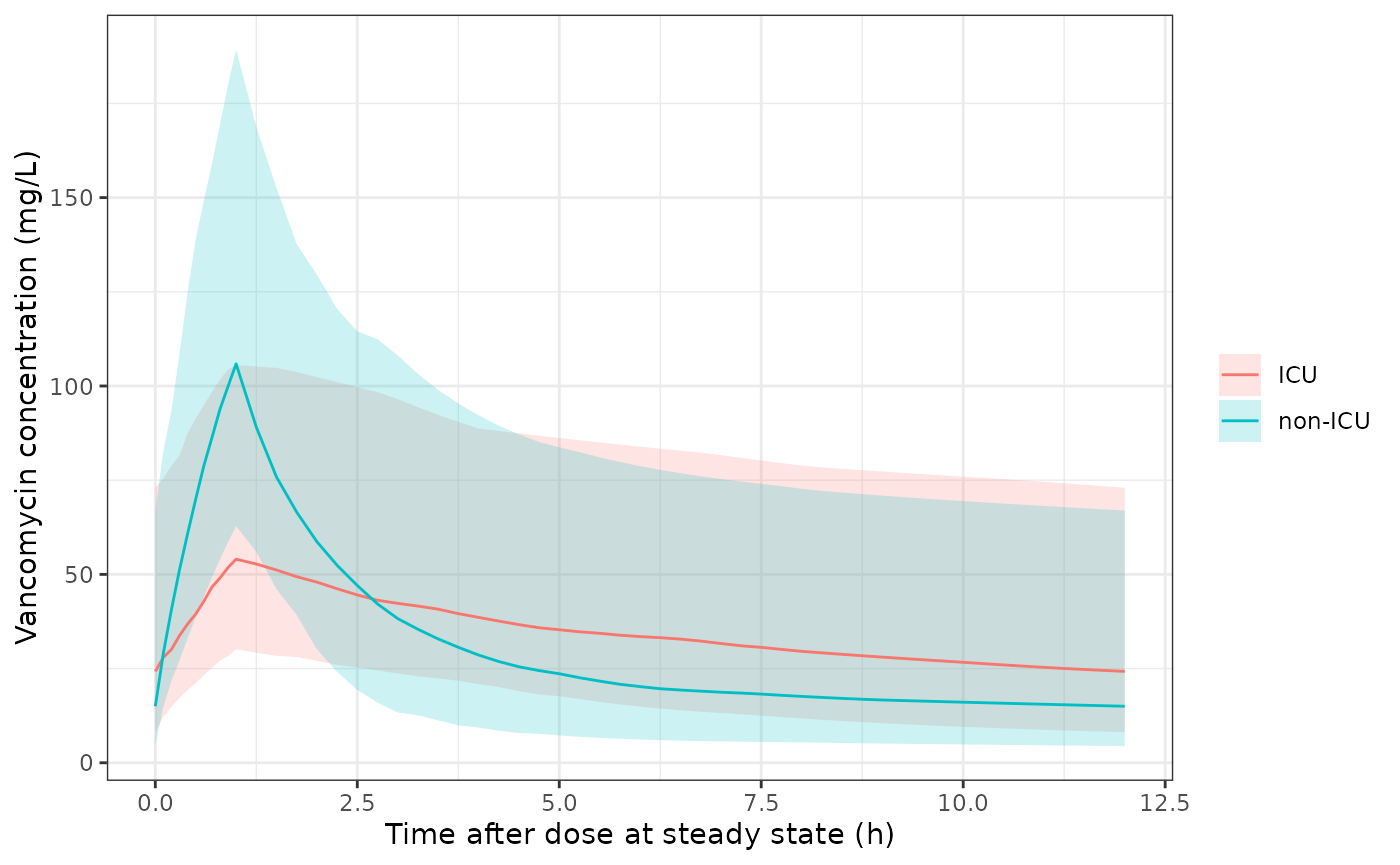
Steady-state concentrations over one 12-h dosing interval (1000 mg every 12 h, 1-h infusion): median and 5th-95th percentiles of the individual predictions (IPRED, no residual error) by ICU status.
Steady-state NCA over the dosing interval with PKNCA. Because the
model is linear, the steady-state AUC over one interval must equal
Dose / CL for each patient; that identity is the check on
the implementation.
conc_df <- sim |>
  filter(!is.na(Cc)) |>
  select(id, time, Cc, treatment)
dose_df <- cohort |>
  mutate(time = 0, amt = 1000) |>
  select(id, time, amt, treatment)

conc_obj <- PKNCA::PKNCAconc(conc_df, Cc ~ time | treatment + id)
dose_obj <- PKNCA::PKNCAdose(dose_df, amt ~ time | treatment + id)
intervals <- data.frame(
  start = 0, end = tau,
  cmax = TRUE, cmin = TRUE, auclast = TRUE, cav = TRUE
)
nca <- PKNCA::pk.nca(PKNCA::PKNCAdata(conc_obj, dose_obj, intervals = intervals))
nca_df <- as.data.frame(nca$result)

summary(nca)
#>  start end treatment   N    auclast        cmax        cmin         cav
#>      0  12       ICU 200 431 [53.7] 54.9 [40.5] 24.5 [78.1] 35.9 [53.7]
#>      0  12   non-ICU 200 415 [59.2]  109 [36.1]  16.3 [102] 34.6 [59.2]
#>
#> Caption: auclast, cmax, cmin, cav: geometric mean and geometric coefficient of variation; N: number of subjects
cl_ind <- sim |>
  group_by(id) |>
  summarise(cl = first(cl), .groups = "drop")
auc_chk <- nca_df |>
  filter(PPTESTCD == "auclast") |>
  select(id, treatment, auclast = PPORRES) |>
  left_join(cl_ind, by = "id") |>
  mutate(pct_diff = 100 * (auclast / (1000 / cl) - 1))
stopifnot(nrow(auc_chk) == 2 * n_per_arm, !anyNA(auc_chk$pct_diff))

auc_chk |>
  group_by(treatment) |>
  summarise(
    `Median AUCtau (mg*h/L)` = median(auclast),
    `Median Dose/CL (mg*h/L)` = median(1000 / cl),
    `Max abs difference (%)` = max(abs(pct_diff)),
    .groups = "drop"
  ) |>
knitr::kable(digits = 2)| treatment | Median AUCtau (mg*h/L) | Median Dose/CL (mg*h/L) | Max abs difference (%) |
|---|---|---|---|
| ICU | 409.08 | 409.07 | 0.01 |
| non-ICU | 383.26 | 383.15 | 0.06 |
# Both sides use the same simulated clearance, so the difference is only
# integration and trapezoid error; the bound sits well above that floor yet
# far below the tens-of-percent shift a wrong clearance or volume produces.
stopifnot(max(abs(auc_chk$pct_diff)) < 1)
The paper reports no NCA table of its own, so there is no published Cmax / AUC comparison to render here; the quantitative comparison against the paper is the dosing-table reproduction below.
Replicating Table 3 (AUC-targeted dosing)
Table 3 of the paper lists, for each creatinine-clearance band, the
regimen with the highest probability that the steady-state AUC24 falls
within 400-650 mg*h/L. At steady state
AUC24 = daily dose / CL for a linear model, so the
probability depends only on the clearance distribution: with
CL = CL_typ(CrCl) * exp(eta),
eta ~ N(0, omega^2), the probability for a patient is
pnorm(log(DD / 400 / CL_typ) / omega) - pnorm(log(DD / 650 / CL_typ) / omega).
Averaging that over creatinine clearance spread uniformly across each
band gives the probability of target attainment (PTA) deterministically,
with no Monte-Carlo noise. The paper’s own simulations used 10,000
patients per band; its last row (‘>= 180’) is compared with the
180-209 mL/min band, the first of the bands above 180 that the Methods
list.
omega_cl <- sqrt(mod$omega["etalclmax", "etalclmax"])
table3 <- data.frame(
  band = c("15-29", "30-44", "45-59", "60-89", "90-119", "120-149", "150-179", ">= 180"),
  lo = c(15, 30, 45, 60, 90, 120, 150, 180),
  hi = c(30, 45, 60, 90, 120, 150, 180, 210),
  regimen = c("250 mg Q24h", "500 mg Q24h", "750 mg Q24h", "1250 mg Q24h",
              "750 mg Q12h", "1750 mg Q24h", "1000 mg Q12h", "750 mg Q8h"),
  daily_dose = c(250, 500, 750, 1250, 1500, 1750, 2000, 2250),
  pta_paper = c(41.44, 53.69, 57.64, 57.32, 61.58, 62.33, 62.56, 61.69)
)

band_grid <- table3 |>
  group_by(band) |>
  reframe(CRCL = seq(first(lo), first(hi), length.out = 201)) |>
  mutate(id = seq_len(n()), time = 0, evid = 0, amt = 0, cmt = "central",
         DIS_CRITILL = 0)
band_cl <- rxode2::rxSolve(mod_typ, events = band_grid, keep = c("band", "CRCL")) |>
  as.data.frame()
#> ℹ omega/sigma items treated as zero: 'etalclmax', 'etalvc'
#> Warning: multi-subject simulation without without 'omega'
stopifnot(nrow(band_cl) == nrow(band_grid))

pta <- band_cl |>
  left_join(table3, by = "band") |>
  mutate(p = pnorm(log(daily_dose / 400 / cl) / omega_cl) -
               pnorm(log(daily_dose / 650 / cl) / omega_cl)) |>
  group_by(band) |>
  summarise(pta_model = 100 * mean(p), .groups = "drop")

table3_cmp <- table3 |>
  left_join(pta, by = "band") |>
  mutate(diff = pta_model - pta_paper)
stopifnot(nrow(table3_cmp) == 8, !anyNA(table3_cmp$pta_model))

table3_cmp |>
  select(band, regimen, pta_paper, pta_model, diff) |>
  dplyr::rename(
    "CrCl band (mL/min)" = band,
    "Regimen" = regimen,
    "PTA, paper (%)" = pta_paper,
    "PTA, model (%)" = pta_model,
    "Difference (points)" = diff
  ) |>
knitr::kable(digits = 2)| CrCl band (mL/min) | Regimen | PTA, paper (%) | PTA, model (%) | Difference (points) |
|---|---|---|---|---|
| 15-29 | 250 mg Q24h | 41.44 | 41.94 | 0.50 |
| 30-44 | 500 mg Q24h | 53.69 | 52.40 | -1.29 |
| 45-59 | 750 mg Q24h | 57.64 | 56.33 | -1.31 |
| 60-89 | 1250 mg Q24h | 57.32 | 57.68 | 0.36 |
| 90-119 | 750 mg Q12h | 61.58 | 60.63 | -0.95 |
| 120-149 | 1750 mg Q24h | 62.33 | 61.19 | -1.14 |
| 150-179 | 1000 mg Q12h | 62.56 | 61.62 | -0.94 |
| >= 180 | 750 mg Q8h | 61.69 | 60.83 | -0.86 |
# The computation is deterministic. The residual gap reflects the paper's
# Monte-Carlo noise (about +/- 1 point at N = 10,000) and its unstated
# within-band creatinine-clearance distribution. A mis-transcribed CLmax,
# CrCl50, Hill coefficient or omega moves several bands by 5-20 points.
stopifnot(max(abs(table3_cmp$diff)) < 3)
Assumptions and deviations
-
Residual error model. Table 2 labels the residual
row ‘Additive residual error’, but Methods Equation 6 is
Cobs = Cpred + Cpred * eps, described as a proportional error. The equation is used: the error model is proportional. -
Variance scale of Table 2’s random effects. Table 2
does not state whether the IIV and residual entries are variances or
standard deviations. They are taken as NONMEM variances because estimate
+/- 1.96 x RSE x estimate reproduces the printed bootstrap 95% CIs (IIV
CL: 0.053-0.101 vs 0.05-0.10; residual: 0.034-0.059 vs 0.032-0.060), and
because the variance reading of the CL IIV reproduces the paper’s Table
3 PTA values to within 2 percentage points (above).
propSdis thereforesqrt(0.0466) = 0.216. On the SD reading,propSdwould be 0.0466 andetalclmaxwould be0.0771^2. - Unit of CrCl50. Table 2 prints the unit of ‘CG CLmax50’ as L/h; the Section 2.2 text gives it as a creatinine clearance of 93.8 mL/min, which is the only unit consistent with Equation 1. mL/min is used.
- Creatinine clearance. The paper uses Cockcroft-Gault creatinine clearance but does not say which body weight entered the formula (only total body weight was recorded), nor whether the value was time-varying in the NONMEM dataset (Table 1 summarises each patient’s mean over the admission). The model accepts either.
- Infusion duration. Not reported. The simulations here assume a 1-h infusion; the steady-state AUC and the Table 3 comparison do not depend on it.
- The ‘>= 180 mL/min’ row of Table 3 is compared with the 180-209 mL/min band from the Methods list; the paper does not say which band or bands the row summarises.
- Virtual-cohort creatinine clearance is log-normal with a log-SD derived from the reported 24.4% of patients at or above 130 mL/min; the paper reports only the median and range.