Irinotecan on a multi-organ-on-a-chip (Shinha 2020)
Source:vignettes/articles/Shinha_2020_irinotecan_invitro.Rmd
Shinha_2020_irinotecan_invitro.RmdModel and source
- Citation: Shinha K, Nihei W, Ono T, Nakazato R, Kimura H. A pharmacokinetic-pharmacodynamic model based on multi-organ-on-a-chip for drug-drug interaction studies. Biomicrofluidics. 2020;14(4):044108. doi:10.1063/5.0011545. Model equations from Section II.D (Eqs. 1-8); chip parameters from Table I (estimation experiments) and Table II (DDI simulations); extraction-ratio estimates from Section III.B.
- Article: https://doi.org/10.1063/5.0011545 (open access, CC BY)
Shinha and colleagues built a microfluidic multi-organ-on-a-chip (MOoC) with a liver part (HepG2 cells) and a lung-cancer part (A549 cells) connected by a recirculating culture medium driven by a stirrer micropump. The prodrug irinotecan (CPT-11) is converted to its active metabolite SN-38 by carboxylesterase 2 (CES2) in the liver part. SN-38 then reaches the cancer cells and reduces their density. The authors wrote a small PK-PD model of the chip, estimated the liver-part extraction ratios of CPT-11 and SN-38 from two chip designs with different liver flow rates, and then used the model to predict drug-drug interactions (DDIs) with simvastatin (a CES2 inhibitor) and ritonavir (a CYP3A4 inhibitor).
mod <- readModelDb("Shinha_2020_irinotecan_invitro")
ui <- rxode2::rxode2(mod)
ui
#>  ── rxode2-based free-form 3-cmt ODE model ──────────────────────────────────────
#>  ── Initalization: ──
#> Fixed Effects ($theta):
#>                     lvc                lq_liver                      eh
#>                4.442769                3.275256                0.004000
#>                 eh_sn38                      fm e_conmed_simvastatin_eh
#>                0.084000                1.000000                0.500000
#>           viability_ref              e_auc_sn38
#>                0.512000               -0.086000
#>
#> States ($state or $stateDf):
#>   Compartment Number Compartment Name
#> 1                  1          central
#> 2                  2     central_sn38
#> 3                  3         auc_sn38
#>  ── Model (Normalized Syntax): ──
#> function() {
#>     compartmentData <- list(central = list(analyte = "irinotecan",
#>         units = "ng", specimen = "administration site", verified = TRUE),
#>         central_sn38 = list(analyte = "SN-38", units = "ng",
#>             specimen = "administration site", verified = TRUE),
#>         auc_sn38 = list(analyte = "SN-38", units = "h*ng/uL",
#>             specimen = "not applicable", verified = TRUE))
#>     covariateData <- list(CONMED_SIMVASTATIN = list(description = "Concomitant simvastatin (CES2 inhibitor) in the culture medium, 1 = present, 0 = absent.",
#>         units = "(binary)", type = "binary", reference_category = 0,
#>         notes = "Shinha 2020 Section II.F: simvastatin at 1 uM, a concentration reported to reduce CES2 expression to 50 percent (ref. 20, Fukami 2010). Section III.C and Table II: the CPT-11 extraction ratio was therefore set to 0.2 percent with simvastatin versus 0.4 percent without, i.e. eh is multiplied by (1 - 0.5). In this in-vitro model the column flags co-incubation in the chip medium rather than a patient co-medication; the quantity (presence of the co-administered drug) is the same.",
#>         source_name = "w/ SV"))
#>     covariatesDataExcluded <- list(CONMED_RTV = list(description = "Concomitant ritonavir (CYP3A4 inhibitor) in the culture medium, 1 = present, 0 = absent.",
#>         units = "(binary)", type = "binary", reference_category = 0,
#>         notes = "Ritonavir 10 uM was tested (Section II.F), but the model assigns it NO effect: Table II carries the same CPT-11 extraction ratio (0.004) with and without ritonavir because HepG2 cells express very little CYP3A4 and CPT-11 is metabolised only by CES2 in this chip (fm = 1). The measured cell density ratio with ritonavir (20.3 percent) was lower than without (29.5 percent, not significant); the authors attribute this to UGT1A1 inhibition of SN-38 glucuronidation, which the model does not include.",
#>         source_name = "w/ RTV"))
#>     description <- "In vitro (multi-organ-on-a-chip: HepG2 liver part + A549 lung-cancer part). Deterministic parent-metabolite PK-PD model for the prodrug irinotecan (CPT-11) and its active metabolite SN-38 in the recirculating culture medium of a microfluidic chip. Both species share one well-mixed medium volume (the microchannel volume, vc); CPT-11 is converted to SN-38 by the liver part at a first-order rate q_liver * eh / vc (flow rate times extraction ratio, Shinha 2020 Eq. 5) and SN-38 is eliminated by the same liver part at q_liver * eh_sn38 / vc. Cancer-cell density, as a percentage of the untreated control, is a log-linear function of the cumulative SN-38 AUC (Eq. 7). Concomitant simvastatin halves the CPT-11 extraction ratio (CES2 inhibition, Table II). The flow rate and volume default to the physiological-flow-ratio chip (with bypass channel); the chip without the bypass channel is simulated by overriding lq_liver and lvc (Table I). The culture medium is exchanged every 24 h, which must be encoded in the event table as replacement events (see the vignette)."
#>     paper_specific_compartments <- "auc_sn38"
#>     population <- list(species = "in vitro (HepG2 liver model + A549 lung cancer cells on a multi-organ-on-a-chip)",
#>         n_subjects = NA_integer_, n_studies = 1L, age_range = NA_character_,
#>         weight_range = NA_character_, sex_female_pct = NA_real_,
#>         race_ethnicity = NA_character_, disease_state = "Not applicable -- A549 human lung adenocarcinoma cells as the drug-target part, HepG2 hepatocellular carcinoma cells as the metabolising liver part.",
#>         dose_range = "CPT-11 15 uM (9.35 ng/uL) in the culture medium, replaced every 24 h for 72 h; simvastatin 1 uM or ritonavir 10 uM in the DDI experiments.",
#>         regions = "Japan (Tokai University)", notes = "Polydimethylsiloxane multi-organ-on-a-chip with a stirrer-based micropump at 2800 rpm (Sections II.A-B, III.A). HepG2 seeded at 1.7-2.0 x 10^5 cells/cm^2 in the liver chamber and, 48 h later, A549 at 1.7-2.0 x 10^4 cells/cm^2 in the lung-cancer chamber (Section II.C). Two chip designs: without the bypass channel (liver:lung-cancer flow ratio 1.0:1.0, Q = 89.60 uL/h, Vd = 70.19 uL) and with the bypass channel (physiological 1.0:3.3 ratio, Q = 26.45 uL/h, Vd = 85.01 uL) (Table I). Endpoint: A549 nuclear density (Hoechst 33342) after 72 h relative to CPT-11-free control chips; mean +/- SD of n = 3-6 chips per condition (Figs. 3-4). The PD relationship (Eq. 7) was built from published SN-38 cytotoxicity on A549 cells (ref. 17, Mijatovic 2006); its coefficients are inputs to this study, not estimated from the chip data.")
#>     reference <- "Shinha K, Nihei W, Ono T, Nakazato R, Kimura H. A pharmacokinetic-pharmacodynamic model based on multi-organ-on-a-chip for drug-drug interaction studies. Biomicrofluidics. 2020;14(4):044108. doi:10.1063/5.0011545. Model equations from Section II.D (Eqs. 1-8); chip parameters from Table I (estimation experiments) and Table II (DDI simulations); extraction-ratio estimates from Section III.B."
#>     units <- list(time = "h", dosing = "ng", concentration = "ng/uL")
#>     vignette <- "Shinha_2020_irinotecan_invitro"
#>     ini({
#>         lvc <- fix(4.44276889662927)
#>         label("Distribution volume = microchannel medium volume, chip with bypass channel (uL)")
#>         lq_liver <- fix(3.27525615830431)
#>         label("Medium flow rate through the liver part, chip with bypass channel (uL/h)")
#>         eh <- 0.004
#>         label("Liver-part extraction ratio of CPT-11 (irinotecan) (fraction)")
#>         eh_sn38 <- 0.084
#>         label("Liver-part extraction ratio of SN-38 (fraction)")
#>         fm <- fix(1)
#>         label("Fraction of CPT-11 metabolised to SN-38 by CES2 (fraction)")
#>         e_conmed_simvastatin_eh <- fix(0.5)
#>         label("Fractional reduction of the CPT-11 extraction ratio with concomitant simvastatin (fraction)")
#>         viability_ref <- fix(0.512)
#>         label("Cell density ratio at an SN-38 AUC of 1 h*ng/uL (fraction of control)")
#>         e_auc_sn38 <- fix(-0.086)
#>         label("Change in cell density ratio per unit natural-log SN-38 AUC (fraction of control)")
#>     })
#>     model({
#>         vc <- exp(lvc)
#>         q_liver <- exp(lq_liver)
#>         eh_i <- eh * (1 - e_conmed_simvastatin_eh * CONMED_SIMVASTATIN)
#>         kel <- q_liver * eh_i/vc
#>         kel_sn38 <- q_liver * eh_sn38/vc
#>         d/dt(central) <- -kel * central
#>         d/dt(central_sn38) <- fm * kel * central - kel_sn38 *
#>             central_sn38
#>         d/dt(auc_sn38) <- central_sn38/vc
#>         Cc <- central/vc
#>         Cc_sn38 <- central_sn38/vc
#>         viability <- 100 * (viability_ref + e_auc_sn38 * log(auc_sn38))
#>     })
#> }
Population
This is an in-vitro system, not a patient population
(readModelDb("Shinha_2020_irinotecan_invitro")()$population).
HepG2 cells were seeded in the liver chamber at 1.7-2.0 x 10^5
cells/cm^2. After 48 h, A549 cells were seeded in the lung-cancer
chamber at 1.7-2.0 x 10^4 cells/cm^2 and cultured for a further 24 h
(Section II.C). CPT-11 was then added at 15 uM (9.35 ng/uL), and the
medium was exchanged for fresh drug-containing medium every 24 h. After
72 h, A549 nuclear density (Hoechst 33342) was expressed relative to
CPT-11-free control chips. Each condition ran in 3-6 chips.
Two chip designs were used (Table I):
| Chip | Liver : lung-cancer flow ratio | Q (uL/h) | Vd (uL) | Observed cell density ratio |
|---|---|---|---|---|
| Without bypass channel | 1.0 : 1.0 | 89.60 | 70.19 | 0.256 |
| With bypass channel | 1.0 : 3.3 (physiological) | 26.45 | 85.01 | 0.332 |
The model file’s defaults are the with-bypass chip, which is the design used for the DDI predictions (Table II).
Source trace
| Model element | Value | Source location |
|---|---|---|
d/dt(central) = -kel * central |
– | Eq. 1 (Eq. 2 is its closed form) |
d/dt(central_sn38) = fm * kel * central - kel_sn38 * central_sn38 |
– | Eq. 3 (Eqs. 4 and 6 are its closed forms) |
kel = q_liver * eh / vc,
kel_sn38 = q_liver * eh_sn38 / vc
|
– | Eq. 5 |
d/dt(auc_sn38) = Cc_sn38 |
– | Eq. 8 (the integral of CM[t]) |
viability = 100 * (0.512 - 0.086 * log(auc_sn38)) |
– | Eq. 7; percent scale as in Figs. 3-4 |
lvc |
log(85.01 uL) | Table I (w/ bypass) and Table II |
lq_liver |
log(26.45 uL/h) | Table I (w/ bypass) and Table II |
eh |
0.004 | Section III.B; Table II Ep
|
eh_sn38 |
0.084 | Section III.B; Table II Em
|
fm |
1 (fixed) | Table I/II; Section III.B |
e_conmed_simvastatin_eh |
0.5 (fixed) | Table II: Ep 0.002 with simvastatin vs 0.004 without;
Section III.C |
viability_ref |
0.512 (fixed) | Eq. 7 intercept |
e_auc_sn38 |
-0.086 (fixed) | Eq. 7 slope |
Dose: X0 * Vd into central
|
9.35 ng/uL | Table I/II X0; CPT-11 15 uM (Section II.E) |
| Medium exchange every 24 h | – | Sections II.E and II.F |
Simulation set-up
The paper’s chip experiments exchanged the whole medium every 24 h.
In the model this is two replacement events
(evid = 5) at 24 h and 48 h: the CPT-11 amount is reset to
X0 * Vd and the SN-38 amount to zero. The cumulative SN-38
AUC keeps integrating across the exchanges, because the PD (Eq. 8) is
driven by the total SN-38 exposure over the 72-h experiment.
The two chip designs differ only in Q and
Vd. They are simulated by overriding the two fixed
parameters with rxode2::ini().
x0 <- 9.35 # ng/uL, Table I

chipEvents <- function(vd, conmedSimvastatin = 0, tEnd = 72, exchange = TRUE) {
  dose <- x0 * vd
  exchangeTimes <- if (exchange) seq(24, tEnd - 1, by = 24) else numeric(0)
  obsTimes <- sort(unique(c(seq(0, tEnd, by = 0.5), exchangeTimes - 1e-6)))
  nEx <- length(exchangeTimes)
  ev <- dplyr::bind_rows(
    data.frame(time = 0, evid = 1L, amt = dose, cmt = "central"),
    data.frame(time = exchangeTimes, evid = rep(5L, nEx), amt = rep(dose, nEx), cmt = rep("central", nEx)),
    data.frame(time = exchangeTimes, evid = rep(5L, nEx), amt = rep(0, nEx), cmt = rep("central_sn38", nEx)),
    data.frame(time = obsTimes, evid = 0L, amt = NA_real_, cmt = "central")
  )
  ev$id <- 1L
  ev$CONMED_SIMVASTATIN <- conmedSimvastatin
  ev[order(ev$time, -ev$evid), c("id", "time", "evid", "amt", "cmt", "CONMED_SIMVASTATIN")]
}

chipModel <- function(q, vd) {
  rxode2::ini(ui, lq_liver = fixed(log(q)), lvc = fixed(log(vd)))
}

chips <- data.frame(
  chip = c("Without bypass channel", "With bypass channel"),
  q = c(89.60, 26.45),
  vd = c(70.19, 85.01),
  obsRatio = c(0.256, 0.332),
  paperAuc = c(19.63, 8.15)
)

solveChip <- function(i, conmedSimvastatin = 0, exchange = TRUE, tEnd = 72) {
  s <- rxode2::rxSolve(
    chipModel(chips$q[i], chips$vd[i]),
    chipEvents(chips$vd[i], conmedSimvastatin, tEnd = tEnd, exchange = exchange),
    returnType = "data.frame"
  )
  # A single-subject solve returns no id column; PKNCA needs one.
  s$id <- 1L
  s$chip <- chips$chip[i]
  s
}

sims <- dplyr::bind_rows(lapply(seq_len(nrow(chips)), solveChip))
#> Warning: trying to fix 'lq_liver', but already fixed
#> ℹ change initial estimate of `lq_liver` to `4.49535531998088`
#> Warning: trying to fix 'lvc', but already fixed
#> ℹ change initial estimate of `lvc` to `4.25120585074233`
#> Warning: trying to fix 'lq_liver', but already fixed
#> ℹ change initial estimate of `lq_liver` to `3.27525615830431`
#> Warning: trying to fix 'lvc', but already fixed
#> ℹ change initial estimate of `lvc` to `4.44276889662927`
Medium concentration profiles
The model’s concentrations cannot be compared with measured medium concentrations, because the paper measured none. Its Conclusion names liquid chromatography-mass spectrometry of the medium as future work. The profiles below show what the fitted model implies. CPT-11 barely falls within each 24-h period (liver-part extraction of 0.4 percent per pass). SN-38 builds up until the medium exchange removes it.
sims |>
  dplyr::select(time, chip, `CPT-11` = Cc, `SN-38` = Cc_sn38) |>
  tidyr::pivot_longer(c(`CPT-11`, `SN-38`), names_to = "analyte", values_to = "conc") |>
  ggplot(aes(time, conc, colour = chip)) +
  geom_line() +
  facet_wrap(~analyte, scales = "free_y") +
  labs(x = "Time (h)", y = "Medium concentration (ng/uL)", colour = NULL) +
  theme_bw() +
  theme(legend.position = "bottom")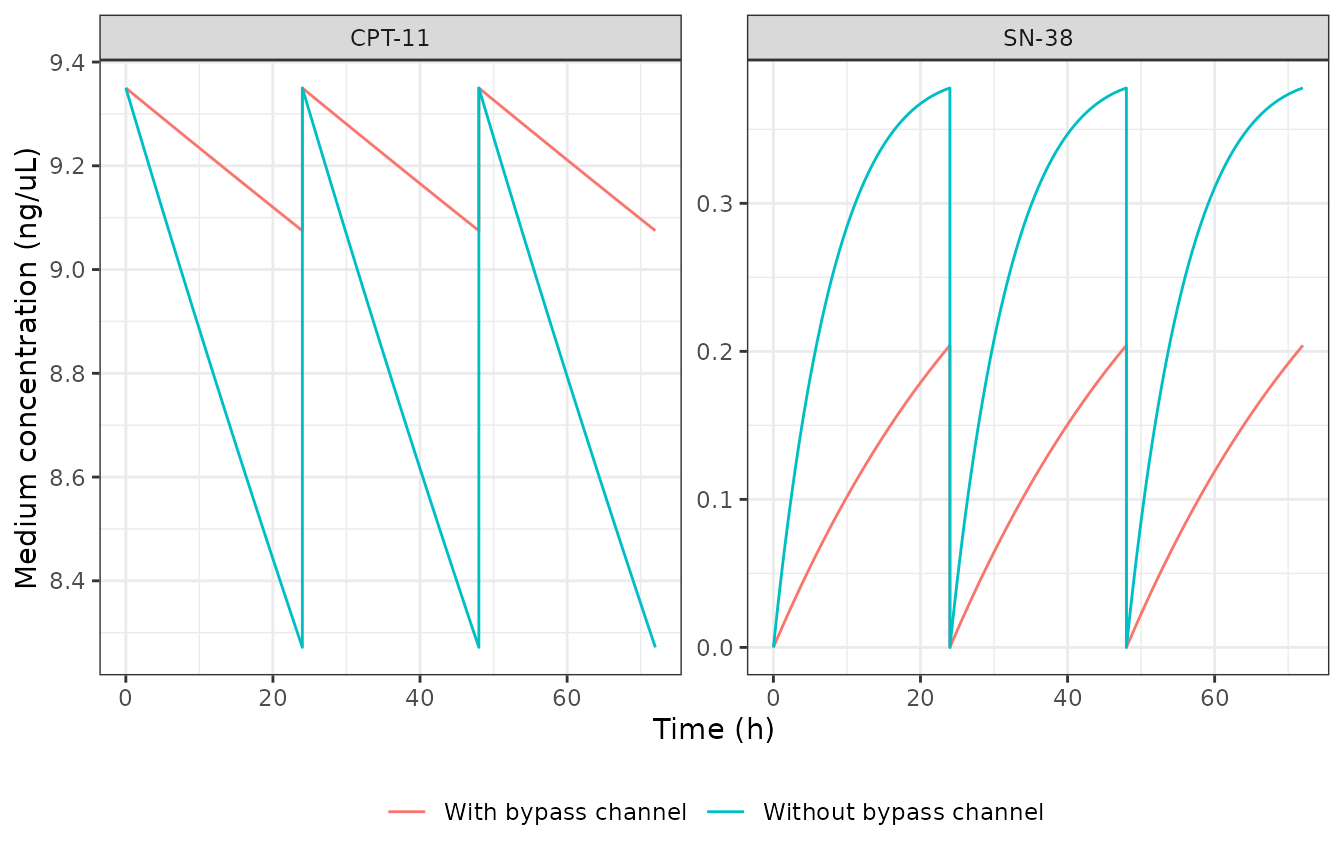
Model-implied CPT-11 and SN-38 concentrations in the chip medium over the 72-h experiment (medium exchanged at 24 and 48 h).
Replicating the extraction-ratio estimation (Section III.B, Fig. 3)
The authors inverted Eq. 7 on the two observed cell density ratios to get the SN-38 AUC in each chip, 19.63 hng/uL without and 8.15 hng/uL with the bypass channel (Section III.B, Fig. 3(c)). They then solved the PK model for the two extraction ratios. Running the packaged model forward with the rounded extraction ratios (0.4 and 8.4 percent) should return both AUCs and both cell density ratios.
endpoint <- sims |>
  dplyr::group_by(chip) |>
  dplyr::filter(time == max(time)) |>
  dplyr::ungroup() |>
  dplyr::left_join(chips, by = "chip") |>
  dplyr::mutate(
    pctAuc = 100 * (auc_sn38 - paperAuc) / paperAuc,
    diffRatio = viability / 100 - obsRatio
  )

endpoint |>
  dplyr::transmute(
    Chip = chip,
    `Published SN-38 AUC (h*ng/uL)` = paperAuc,
    `Simulated SN-38 AUC (h*ng/uL)` = signif(auc_sn38, 4),
    `Observed cell density ratio` = obsRatio,
    `Simulated cell density ratio` = round(viability / 100, 3)
  ) |>
knitr::kable(caption = "Replicates Table I and Section III.B of Shinha 2020: the 72-h SN-38 AUC and the A549 cell density ratio in each chip.")| Chip | Published SN-38 AUC (h*ng/uL) | Simulated SN-38 AUC (h*ng/uL) | Observed cell density ratio | Simulated cell density ratio |
|---|---|---|---|---|
| Without bypass channel | 19.63 | 19.600 | 0.256 | 0.256 |
| With bypass channel | 8.15 | 8.159 | 0.332 | 0.331 |
stopifnot(
  # Both published AUCs are reproduced to within the rounding of the two
  # extraction ratios (printed to one decimal place of a percent).
  all(abs(endpoint$pctAuc) < 1),
  # And the two observed cell density ratios to the third decimal.
  all(abs(endpoint$diffRatio) < 0.002)
)
Both chips agree to within 0.2 percent on AUC and 0.001 on the density ratio. This match depends on the daily medium exchange. The same model run for 72 h without exchanging the medium gives very different AUCs (next chunk), so the match is a real test of the event structure and not a coincidence.
noExchange <- dplyr::bind_rows(lapply(seq_len(nrow(chips)), solveChip, exchange = FALSE)) |>
  dplyr::group_by(chip) |>
  dplyr::filter(time == max(time)) |>
  dplyr::ungroup() |>
  dplyr::left_join(chips, by = "chip")
#> Warning: trying to fix 'lq_liver', but already fixed
#> ℹ change initial estimate of `lq_liver` to `4.49535531998088`
#> Warning: trying to fix 'lvc', but already fixed
#> ℹ change initial estimate of `lvc` to `4.25120585074233`
#> Warning: trying to fix 'lq_liver', but already fixed
#> ℹ change initial estimate of `lq_liver` to `3.27525615830431`
#> Warning: trying to fix 'lvc', but already fixed
#> ℹ change initial estimate of `lvc` to `4.44276889662927`
noExchange |>
  dplyr::transmute(
    Chip = chip,
    `Published SN-38 AUC` = paperAuc,
    `Simulated AUC, no medium exchange` = signif(auc_sn38, 4)
  ) |>
knitr::kable(caption = "Counterfactual: continuous 72-h exposure without the daily medium exchange.")| Chip | Published SN-38 AUC | Simulated AUC, no medium exchange |
|---|---|---|
| Without bypass channel | 19.63 | 23.81 |
| With bypass channel | 8.15 | 17.03 |
Closed-form check (Eq. 6)
Within one 24-h period the ODE solution must equal the paper’s closed form, Eq. 6. Both sides use the same parameters, so the difference is pure numerical error and a tight bound is correct.
eq6 <- function(t, q, vd, ep, em, fm = 1) {
  ep * fm * x0 / (ep - em) * (exp(-q * em / vd * t) - exp(-q * ep / vd * t))
}
cf <- sims |>
  dplyr::filter(time > 0, time < 24) |>
  dplyr::left_join(chips, by = "chip") |>
  dplyr::mutate(
    analytic = eq6(time, q, vd, 0.004, 0.084),
    relErr = abs(Cc_sn38 - analytic) / analytic
  )
max(cf$relErr)
#> [1] 8.059955e-08
stopifnot(max(cf$relErr) < 1e-4)
PKNCA check of the SN-38 AUC
The medium exchange returns the chip to its initial state every 24 h,
so the 72-h SN-38 AUC is three times the AUC over the first 24 h. PKNCA
computes that 24-h AUC independently from the simulated concentrations.
Three times its value should match both the model’s
auc_sn38 state and the published AUC.
day1 <- dplyr::bind_rows(lapply(seq_len(nrow(chips)), solveChip, exchange = FALSE, tEnd = 24)) |>
  dplyr::filter(!is.na(Cc_sn38)) |>
  dplyr::mutate(treatment = chip)
#> Warning: trying to fix 'lq_liver', but already fixed
#> ℹ change initial estimate of `lq_liver` to `4.49535531998088`
#> Warning: trying to fix 'lvc', but already fixed
#> ℹ change initial estimate of `lvc` to `4.25120585074233`
#> Warning: trying to fix 'lq_liver', but already fixed
#> ℹ change initial estimate of `lq_liver` to `3.27525615830431`
#> Warning: trying to fix 'lvc', but already fixed
#> ℹ change initial estimate of `lvc` to `4.44276889662927`

concObj <- PKNCA::PKNCAconc(day1, Cc_sn38 ~ time | treatment + id)
doseDf <- day1 |>
  dplyr::distinct(treatment, id) |>
  dplyr::left_join(chips, by = c(treatment = "chip")) |>
  dplyr::transmute(treatment, id, time = 0, amt = x0 * vd)
doseObj <- PKNCA::PKNCAdose(doseDf, amt ~ time | treatment + id)
intervals <- data.frame(start = 0, end = 24, auclast = TRUE, cmax = TRUE, tmax = TRUE)
ncaRes <- PKNCA::pk.nca(PKNCA::PKNCAdata(concObj, doseObj, intervals = intervals))

ncaWide <- as.data.frame(ncaRes$result) |>
  dplyr::select(treatment, PPTESTCD, PPORRES) |>
  tidyr::pivot_wider(names_from = PPTESTCD, values_from = PPORRES)

simulated <- ncaWide |>
  dplyr::transmute(treatment, auclast = 3 * auclast)
reference <- chips |>
  dplyr::transmute(treatment = chip, auclast = paperAuc)

nlmixr2lib::ncaComparisonTable(
  simulated = simulated,
  reference = reference,
  by = "treatment",
  units = c(auclast = "h*ng/uL"),
  tolerance_pct = 20
) |>
knitr::kable(caption = "SN-38 AUC over 0-72 h (three medium-exchange periods): PKNCA on the simulated profile vs the AUC published in Section III.B. * differs from reference by more than 20%.")| NCA parameter | treatment | Reference | Simulated | % diff |
|---|---|---|---|---|
| AUClast (h*ng/uL) | Without bypass channel | 19.6 | 19.6 | -0.2% |
| AUClast (h*ng/uL) | With bypass channel | 8.15 | 8.16 | +0.1% |
pkncaVsState <- simulated |>
  dplyr::left_join(endpoint |> dplyr::select(treatment = chip, auc_sn38), by = "treatment")
stopifnot(all(abs(pkncaVsState$auclast - pkncaVsState$auc_sn38) / pkncaVsState$auc_sn38 < 0.005))
The 0.5 percent tolerance on the PKNCA-vs-state comparison allows for linear-trapezoidal error on the 0.5-h grid. Everything else is exact.
Drug-drug interactions (Section III.C, Fig. 4)
Table II keeps the with-bypass chip and changes only the CPT-11
extraction ratio. Simvastatin halves it (0.002), because 1 uM
simvastatin is reported to halve CES2 expression. Ritonavir leaves it
unchanged (0.004), because HepG2 cells express very little CYP3A4 and
CPT-11 is metabolised only by CES2 (fm = 1). Ritonavir
therefore has no covariate in the model
(covariatesDataExcluded).
ddiSims <- dplyr::bind_rows(
  solveChip(2, conmedSimvastatin = 0) |> dplyr::mutate(condition = "No inhibitor"),
  solveChip(2, conmedSimvastatin = 0) |> dplyr::mutate(condition = "Ritonavir"),
  solveChip(2, conmedSimvastatin = 1) |> dplyr::mutate(condition = "Simvastatin")
) |>
  dplyr::filter(time == 72)
#> Warning: trying to fix 'lq_liver', but already fixed
#> ℹ change initial estimate of `lq_liver` to `3.27525615830431`
#> Warning: trying to fix 'lvc', but already fixed
#> ℹ change initial estimate of `lvc` to `4.44276889662927`
#> Warning: trying to fix 'lq_liver', but already fixed
#> ℹ change initial estimate of `lq_liver` to `3.27525615830431`
#> Warning: trying to fix 'lvc', but already fixed
#> ℹ change initial estimate of `lvc` to `4.44276889662927`
#> Warning: trying to fix 'lq_liver', but already fixed
#> ℹ change initial estimate of `lq_liver` to `3.27525615830431`
#> Warning: trying to fix 'lvc', but already fixed
#> ℹ change initial estimate of `lvc` to `4.44276889662927`

ddi <- ddiSims |>
  dplyr::transmute(
    condition,
    auc = auc_sn38,
    simulated = viability,
    fig4a = c(34.5, 34.5, 40.7),
    text = c(35.5, 35.5, 25.6),
    observed = c(29.5, 20.3, 38.8)
  )
ddi |>
  dplyr::transmute(
    Condition = condition,
    `SN-38 AUC (h*ng/uL)` = signif(auc, 3),
    `Simulated cell density ratio (%)` = round(simulated, 1),
    `Fig. 4(a) predicted (%, digitised)` = fig4a,
    `Text predicted (%)` = text,
    `Observed on chip (%)` = observed
  ) |>
knitr::kable(caption = "Replicates Fig. 4(a) of Shinha 2020: predicted A549 cell density ratio after 72 h with and without metabolic inhibitors. Observed values are the chip means in Fig. 4(b) and Section III.C.")| Condition | SN-38 AUC (h*ng/uL) | Simulated cell density ratio (%) | Fig. 4(a) predicted (%, digitised) | Text predicted (%) | Observed on chip (%) |
|---|---|---|---|---|---|
| No inhibitor | 8.16 | 33.1 | 34.5 | 35.5 | 29.5 |
| Ritonavir | 8.16 | 33.1 | 34.5 | 35.5 | 20.3 |
| Simvastatin | 4.10 | 39.1 | 40.7 | 25.6 | 38.8 |
stopifnot(
  # Simvastatin reduces SN-38 exposure and so raises the surviving fraction by
  # about 6 points; Fig. 4(a) shows about 6.2 points.
  abs((ddi$simulated[3] - ddi$simulated[1]) - (40.7 - 34.5)) < 1.5,
  # The ritonavir arm is identical to the no-inhibitor arm by construction.
  isTRUE(all.equal(ddi$simulated[2], ddi$simulated[1]))
)
ggplot(ddi, aes(condition, simulated)) +
  geom_col(fill = "grey70") +
  geom_point(aes(y = fig4a), size = 3) +
  geom_point(aes(y = observed), shape = 17, size = 3, colour = "firebrick") +
  labs(x = NULL, y = "Cell density ratio (% of control)") +
  theme_bw()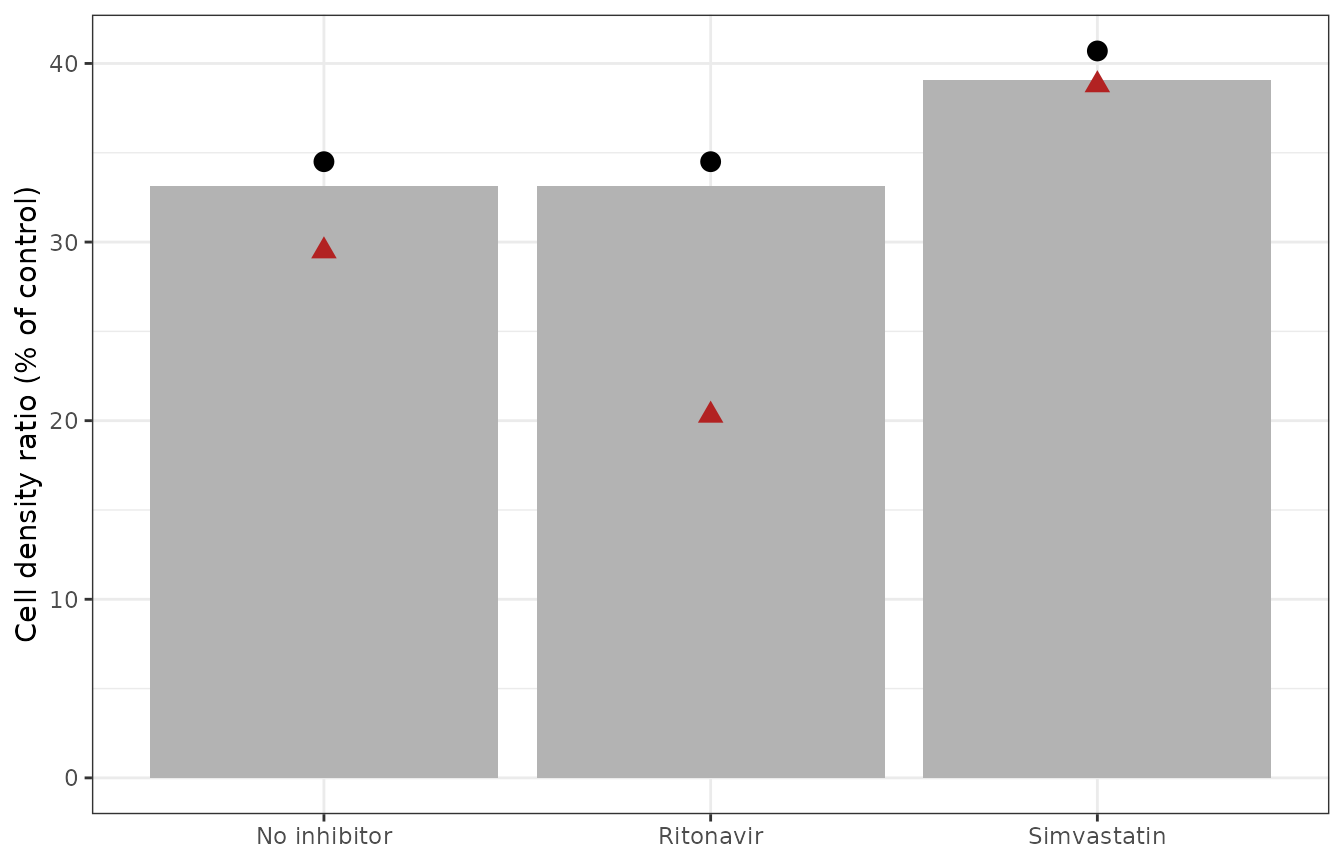
Replicates Fig. 4(a) of Shinha 2020 (bars: packaged model; points: values digitised from Fig. 4(a); triangles: chip observations from Fig. 4(b)).
The simulated no-inhibitor and simvastatin bars (33.1 and 39.1 percent) sit about 1.5 points below the bars in Fig. 4(a) (about 34.5 and 40.7 percent). The gap between the two arms (6.0 vs about 6.2 points) is reproduced. The no-inhibitor condition uses exactly the Table I “with bypass” parameters, and the model reproduces that chip’s fitted density ratio of 0.332 above. The uniform offset is therefore in the published figure, not in the transcription (see Assumptions and deviations).
Assumptions and deviations
-
Medium exchange encoded as replacement events. The
paper describes the daily exchange only in prose (Sections II.E and
II.F). The maintainers encoded it as a reset of the CPT-11 amount to
X0 * Vdand of the SN-38 amount to zero. The cumulative AUC state continues through each exchange. This reading is confirmed by the numbers: it reproduces both published AUCs to within 0.2 percent, while continuous exposure misses them by more than 20 percent (see above). Users simulating other schedules must include equivalent replacement events. -
Chip design as fixed parameters, not a covariate.
QandVdare design constants that differ between the two chips. The model defaults to the physiological-flow-ratio chip (with bypass channel). The other chip is simulated by overridinglq_liverandlvc, as shown above. -
Extraction ratios carried without uncertainty. The
paper reports
EpandEmas point values (0.4 and 8.4 percent). They were back-solved from two chip-level means, so no standard error or between-chip variability exists. The model is deterministic: it has no IIV and no residual error. -
PD output in percent. Eq. 7 gives the cell density
ratio as a fraction. The model reports
viabilityas 100 times that fraction, matching the percent axis of Figs. 3 and 4. The log-linear relationship is an empirical fit to the SN-38 exposures of the 72-h experiment (about 3-20 h*ng/uL). It is not bounded to 0-100 percent and diverges asauc_sn38approaches 0, so it should not be read at early times or very low exposures. - PD coefficients from the literature. Eq. 7 was built by the authors from published SN-38 cytotoxicity on A549 cells (ref. 17, Mijatovic et al., Mol Cancer Ther 2006). The coefficients are printed in the paper and carried here as fixed values. The underlying cytotoxicity data were not re-fitted.
-
Eq. 8 integral limits. The paper prints the
integral in Eq. 8 with limits from
tto0. This is read as the integral from 0 tot, the cumulative AUC that Eq. 7 requires. -
CPT-11 concentration. Table I gives
X0= 9.35 ng/uL for the stated 15 uM. That corresponds to the molar mass of irinotecan hydrochloride (623.1 g/mol) rather than the free base (586.7 g/mol). The table value is used as printed. - Inconsistent DDI predictions in the text. Section III.C states the predicted cell density ratios as 35.5, 35.5 and 25.6 percent (no inhibitor, ritonavir, simvastatin). The simvastatin value of 25.6 percent contradicts the paper’s own Fig. 4(a) (about 40.7 percent) and its narrative (“Drug efficacy declined with the concomitant administration of SV”). It equals the observed density ratio of the chip without bypass channel (Table I, 0.256), so it is probably a transcription slip. The no-inhibitor value (35.5 percent in the text, about 34.5 percent in the figure) cannot be reproduced from Table II either: those inputs are the Table I “with bypass” parameters, and the model returns 33.1 percent for them, matching the fitted 0.332. The packaged model follows Table II and Eqs. 1-8; no parameter was adjusted to reach the figure.
- Ritonavir’s observed effect is outside the model. On the chip, ritonavir lowered the cell density ratio to 20.3 percent (not significant vs 29.5 percent). The authors attribute this to UGT1A1 inhibition of SN-38 glucuronidation. The model does not include that pathway: the SN-38 extraction ratio is unchanged in Table II.