Clonidine on ECMO (Kleiber 2017)
Source:vignettes/articles/Kleiber_2017_clonidine.Rmd
Kleiber_2017_clonidine.RmdModel and source
- Citation: Kleiber N, Mathot RAA, Ahsman MJ, Wildschut ED, Tibboel D, de Wildt SN. Population pharmacokinetics of intravenous clonidine for sedation during paediatric extracorporeal membrane oxygenation and continuous venovenous hemofiltration. Br J Clin Pharmacol. 2017;83(6):1227-1239. doi:10.1111/bcp.13235.
- Description: One-compartment population PK model for intravenous clonidine in critically ill neonates and children on venovenous or venoarterial extracorporeal membrane oxygenation (ECMO) with concomitant continuous venovenous hemofiltration (CVVH). Central compartment only with IV bolus and IV infusion dosing (no absorption). Clearance carries the standard allometric fixed exponent 0.75 on body weight (reference 70 kg), a Hill-type maturation function of postnatal age (steep exponent 3.02 and T50 = 1.13 weeks – ~70% of mature clearance by 10 days of PNA), and a multiplicative diuretic-use effect (CL x 0.659 when any diuretic is active). Volume of distribution carries the standard fixed allometric exponent 1 on body weight and a sigmoidal Emax effect of time-on-ECMO (Emax = +55%, T50 = 51.7 h, Hill exponent 18.5 – effectively a step increase reached by 72 h on ECMO). Residual error is proportional only.
- Article: https://doi.org/10.1111/bcp.13235
Kleiber et al. describe a one-compartment population PK model for intravenous clonidine in critically ill neonates and children on venovenous or venoarterial extracorporeal membrane oxygenation (ECMO) with concomitant continuous venovenous hemofiltration (CVVH). Clearance is scaled allometrically by body weight (fixed exponent 0.75, reference 70 kg), matures with postnatal age via a steep Hill function (Hill = 3.02, T50 = 1.13 weeks so ~70% of adult clearance is reached by 10 days of postnatal age), and drops multiplicatively when any diuretic is coadministered (CL x 0.659). Volume of distribution is scaled linearly by body weight (fixed exponent 1) and rises by up to 55% during ECMO via a sharp sigmoidal Emax function of time-on-ECMO (Hill = 18.5, T50 = 51.7 h – effectively a step increase reached by 72 h on ECMO). Residual variability is proportional only.
Population
The pooled dataset consisted of 22 patients treated at the Erasmus MC-Sophia Pediatric Intensive Care Unit (Rotterdam) between May 2007 and July 2009. Median age at ECMO start was 1 month postnatal (IQR 6.4); median gestational age at birth 38.9 weeks (IQR 5.6); median postmenstrual age 42.8 weeks (IQR 17.6); median weight 4 kg (IQR 3.1). Sex was balanced (11 male / 11 female). ECMO modality was 68.2% VV and 31.8% VA; 90.9% of patients received concomitant CVVH at median flow 300 mL/min. Primary diagnoses were pulmonary (31.8%), meconium aspiration syndrome (22.7%), cardiac (18.2%), congenital diaphragmatic hernia (13.6%), sepsis (9.1%), and persistent pulmonary hypertension (4.5%). Diuretic exposure was common: 72.7% of patients received any diuretic, most frequently furosemide intermittent (63.6%) or spironolactone (31.8%). Concomitant sedatives were midazolam and morphine (all patients).
The same information is available programmatically via
readModelDb("Kleiber_2017_clonidine")()$population.
Source trace
Every ini() line in the model file carries an in-file
source-location comment. The table below reproduces them in one
place.
| Equation / parameter | Value | Source |
|---|---|---|
One-compartment IV bolus + infusion, d/dt(central)
|
n/a | paper Results, Structural model paragraph 1 |
| Allometric scaling, WT reference 70 kg (fixed exponents 0.75 / 1) | n/a | paper Methods, Eqs 4-5 |
| CL Hill maturation on PNA (weeks) | Hill = 3.02, T50 = 1.13 weeks | paper Methods Eq 8; Table 3 final model |
Diuretic effect on CL (multiplicative
Theta2^DIURETIC) |
Theta2 = 0.659 | paper Methods Eq 6; Table 3 / Table 4 final model |
| ECMO effect on V (sigmoidal Emax on t_ECMO) | Emax = 0.55, T50 = 51.7 h, Hill = 18.5 | paper Methods Eq 9; Table 3 final model |
lcl (CL_pop at 70 kg, full PNA maturation, no
diuretic) |
29.9 L/h | Table 3 final model |
lvc (V_pop at 70 kg, pre-ECMO baseline) |
454 L | Table 3 final model |
| IIV on CL (%CV -> log-scale variance) | 40% -> 0.148420 | Table 3 final model |
| IIV on V (%CV -> log-scale variance) | 44% -> 0.176974 | Table 3 final model |
propSd (proportional residual error, fraction) |
0.208 | Table 3 final model |
Virtual cohort
Original observed data are not publicly available. The three virtual patients below reproduce the illustrative dosing scenarios described in the paper’s Discussion (dosing simulations):
- 3-day-old neonate (3 kg) – PNA = 0.1 months (~3 days), on ECMO for 24 h at simulation start, no diuretic.
- 1-month-old infant (4 kg) – PNA = 1 month (cohort median), on ECMO for 24 h at simulation start, no diuretic. This is the cohort-median patient.
- 6-year-old child (20 kg) – PNA = 72 months (oldest patient in the Kleiber 2017 cohort), on ECMO for 24 h at simulation start, no diuretic. The paper’s Discussion actually simulates a 12-year-old (35 kg) but that is outside the studied age range; we use 6 years to stay within the reported cohort.
Each simulated patient receives 3 IV boluses of 5 ug/kg at t = 0, 20, and 40 min after ECMO reaches 24 h, then a continuous infusion tuned to the paper’s proposed rate (0.12, 2, and 1 ug/kg/h respectively). Simulation runs for 72 h after the first bolus.
set.seed(20260620)

# Per-patient scenario table -- one row per simulated patient. Each row will
# fan out into dose + infusion + observation events below.
patients <- tibble(
  cohort         = c("3d, 3 kg", "1 mo, 4 kg", "6 yr, 20 kg"),
  id             = 1:3,
  WT             = c(3, 4, 20),
  PNA            = c(3 / 30.4375, 1, 72),  # months (canonical PNA units)
  CONMED_DIURETIC = 0,
  # Simulation starts 24 h AFTER ECMO cannulation, so at simulation time t=0
  # the patient's ECMO clock is already at 24 h; keep pushing the clock
  # forward per observation-time row below.
  ecmo_offset_h  = 24,
  bolus_ug_kg    = 5,
  inf_ug_kg_h    = c(0.12, 2, 1)
)

# Build per-subject event tables. Each subject gets:
#   - 3 IV boluses at t = 0, 20 min, 40 min (evid = 1, cmt = "central")
#   - Continuous infusion starting at t = 0 for 72 h (evid = 1, rate > 0)
#   - Dense observation grid over 0-72 h (evid = 0, cmt = "central")
make_events <- function(row) {
  bolus_amt <- row$bolus_ug_kg * row$WT
  inf_rate  <- row$inf_ug_kg_h * row$WT   # ug/h; total infusion duration 72 h

  # Bolus doses
  bolus_ev <- tibble(
    id = row$id, time = c(0, 20 / 60, 40 / 60),
    amt = bolus_amt, rate = 0, evid = 1L, cmt = "central"
  )

  # Continuous infusion: encoded as a single event with rate > 0 and amt
  # equal to total mass delivered over the 72 h window. rxode2 stops the
  # infusion when amt / rate hours have elapsed.
  inf_ev <- tibble(
    id = row$id, time = 0,
    amt = inf_rate * 72, rate = inf_rate, evid = 1L, cmt = "central"
  )

  # Dense observation grid
  obs_ev <- tibble(
    id = row$id,
    time = c(seq(0, 4, by = 0.1), seq(4.5, 72, by = 0.5)),
    amt = NA_real_, rate = 0, evid = 0L, cmt = "central"
  )

  bind_rows(bolus_ev, inf_ev, obs_ev) |>
    mutate(
      WT              = row$WT,
      PNA             = row$PNA,
      CONMED_DIURETIC = row$CONMED_DIURETIC,
      # T_ECMO grows at 1 hour per hour of wall-clock time; the simulation
      # starts 24 h into the ECMO run.
      T_ECMO          = row$ecmo_offset_h + time,
      cohort          = row$cohort
    ) |>
    arrange(time, desc(evid))
}

events <- patients |>
  rowwise() |>
  group_split() |>
  lapply(make_events) |>
  bind_rows()

stopifnot(!anyDuplicated(unique(events[, c("id", "time", "evid")])))
Simulation
mod <- readModelDb("Kleiber_2017_clonidine")

# Simulate the dosing scenarios with typical (zero random effects) values so the
# curves reproduce the paper's illustrative simulations.
mod_typical <- rxode2::zeroRe(mod)
#> ℹ parameter labels from comments will be replaced by 'label()'
sim <- rxode2::rxSolve(
  mod_typical, events = events,
  keep = c("cohort", "WT", "PNA", "T_ECMO", "CONMED_DIURETIC")
) |> as.data.frame()
#> ℹ omega/sigma items treated as zero: 'etalcl', 'etalvc'
#> Warning: multi-subject simulation without without 'omega'

# Only keep observation rows (dose rows carry NA for Cc).
sim_obs <- sim |> filter(!is.na(Cc))
ggplot(sim_obs, aes(time, Cc, colour = cohort)) +
  geom_line() +
  geom_hline(yintercept = 2, linetype = "dashed", colour = "grey40") +
  scale_x_continuous(breaks = seq(0, 72, 12)) +
  labs(x = "Time since first bolus (h)", y = "Clonidine Cc (ng/mL)",
       colour = "Scenario",
       caption = "Bolus 5 ug/kg x 3 (0, 20, 40 min) + continuous infusion (0.12 / 2 / 1 ug/kg/h). ECMO clock starts at 24 h at t=0.")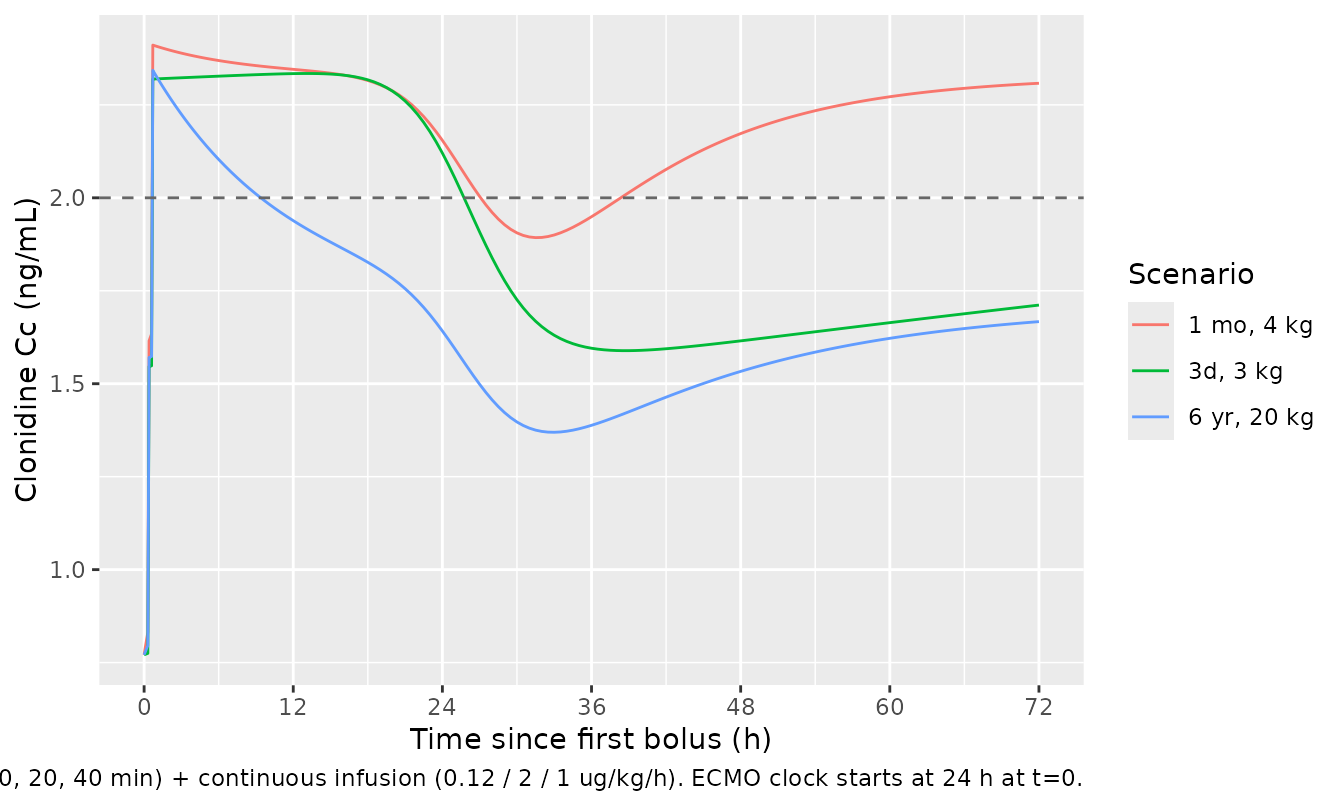
Simulated typical clonidine plasma concentration-time profiles for the three paper-described dosing scenarios. The dashed line marks the 2 ng/mL therapeutic target used by Kleiber et al.
Replicate Figure 6 – clearance maturation with PNA
Figure 6 of Kleiber 2017 shows body-weight-normalised clearance vs postnatal age in the ECMO cohort and in two non-ECMO paediatric studies. The panel below reproduces the ECMO curve from the packaged model.
pna_days <- seq(3, 500, by = 1)
pna_weeks <- pna_days / 7
theta1 <- 3.02
t50_pna <- 1.13
mat_cl <- pna_weeks^theta1 / (t50_pna^theta1 + pna_weeks^theta1)

# Mature (adult) BW-normalised clearance on ECMO = 29.9 / 70 L/h/kg^0.75 for the
# 70 kg allometric reference; we take CL_per_kg = CL / WT with allometric
# CL(WT) = 29.9 * (WT/70)^0.75. At WT = 4 kg, mature CL_per_kg = 29.9 *
# (4/70)^0.75 / 4 = 0.867 L/h/kg. We report L/h/70kg (the paper's Y axis) so
# CL_per_70kg = 29.9 * mat_cl.
maturation_df <- tibble(pna_days = pna_days,
                        cl_L_h_70kg = 29.9 * mat_cl)

ggplot(maturation_df, aes(pna_days, cl_L_h_70kg)) +
  geom_line() +
  geom_hline(yintercept = 29.9 * 0.70, linetype = "dashed", colour = "grey60") +
  geom_vline(xintercept = 10,          linetype = "dashed", colour = "grey60") +
  scale_x_log10() +
  labs(x = "Postnatal age (days, log scale)",
       y = "CL standardized to 70 kg (L/h)",
       caption = "Dashed lines: 70% of adult clearance at 10 days PNA (paper Discussion, Results paragraph 3).")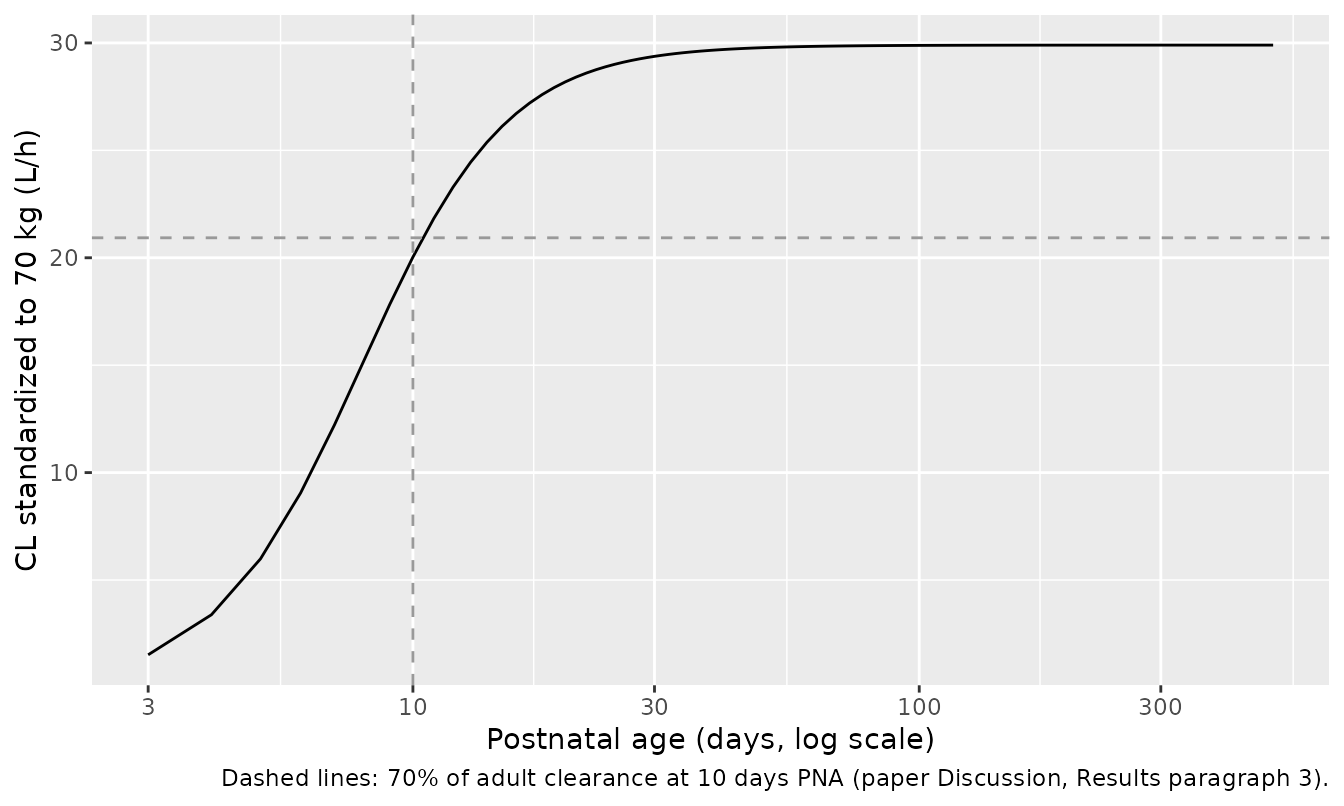
Replicates the ECMO panel of Figure 6 of Kleiber 2017: body-weight-normalised clearance vs postnatal age in a typical 4 kg patient with no diuretic, at full ECMO saturation. The paper reports 70% of adult clearance at 10 days PNA (dashed grid line).
Sanity check against the paper text (Discussion): “at days 6, 8 and 10, respectively 30%, 50% and 70% of the adult clearance rate was reached.”
check_days <- c(6, 8, 10)
tibble(pna_days = check_days,
       pct_mature_paper = c(0.30, 0.50, 0.70),
       pct_mature_model = round(
         (check_days / 7)^theta1 / (t50_pna^theta1 + (check_days / 7)^theta1),
         3)) |>
knitr::kable(caption = "PNA maturation vs paper narrative")| pna_days | pct_mature_paper | pct_mature_model |
|---|---|---|
| 6 | 0.3 | 0.303 |
| 8 | 0.5 | 0.509 |
| 10 | 0.7 | 0.670 |
Replicate Figure 4 – volume of distribution vs time on ECMO
tec <- seq(0, 200, by = 1)
emax_v <- 0.55; t50_ec_v <- 51.7; hill_tec_v <- 18.5
v_mult <- 1 + emax_v * tec^hill_tec_v / (t50_ec_v^hill_tec_v + tec^hill_tec_v)
v_df <- tibble(t_ecmo_h = tec, v_L_70kg = 454 * v_mult)

ggplot(v_df, aes(t_ecmo_h, v_L_70kg)) +
  geom_line() +
  geom_vline(xintercept = 72, linetype = "dashed", colour = "grey60") +
  labs(x = "Time on ECMO (h)",
       y = "V standardized to 70 kg (L)",
       caption = "Dashed line: maximal VD reached 72 h on ECMO (paper Discussion).")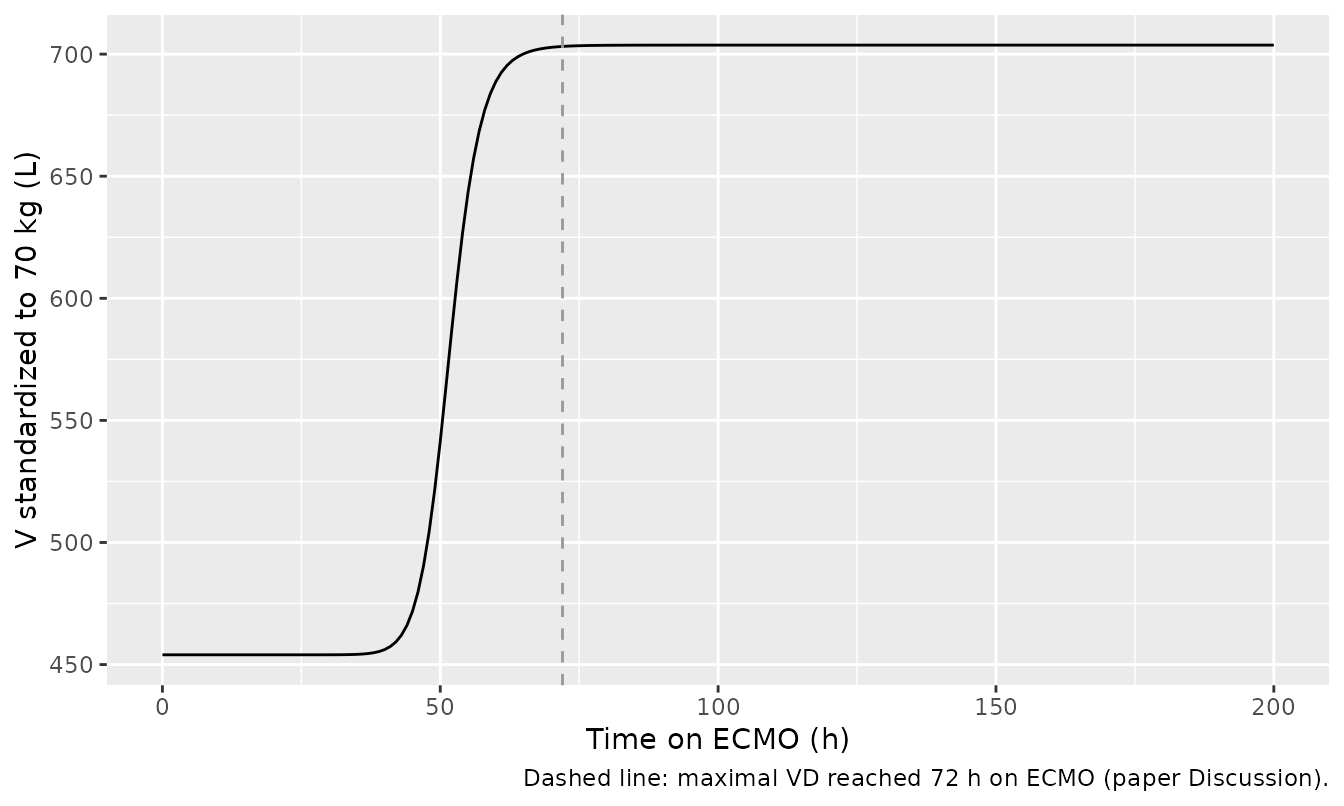
Replicates Figure 4 of Kleiber 2017: body-weight-normalised volume of distribution vs time on ECMO. The paper reports maximal VD reached 72 h after cannulation (dashed vertical).
PKNCA validation
The Kleiber 2017 paper reports point estimates of the population PK parameters (CL_pop = 29.9 L/h/70kg, V_pop = 454 L/70kg with a saturated on-ECMO multiplier of 1.55) rather than NCA metrics. As a mass-balance check we simulate a single 5 ug/kg IV bolus in a “reference-adult on ECMO” scenario (WT = 70 kg, PNA very large so maturation is complete, no diuretic, T_ECMO = 200 h so V is fully saturated) and confirm that PKNCA-derived CL_apparent and V_apparent recover the model’s population values.
nca_scenarios <- tibble::tribble(
  ~treatment,               ~WT, ~PNA,   ~CONMED_DIURETIC, ~T_ECMO,
  "on-ECMO, no diuretic",   70L, 240,    0L,               200,
  "off-ECMO baseline",      70L, 240,    0L,               0,
  "on-ECMO + diuretic",     70L, 240,    1L,               200
) |> mutate(id = row_number())

make_bolus_events <- function(row) {
  dose_ug <- 5 * row$WT
  bolus <- tibble(id = row$id, time = 0, amt = dose_ug, evid = 1L, cmt = "central")
  obs   <- tibble(id = row$id,
                  time = c(seq(0.1, 4, by = 0.1), seq(4.5, 168, by = 0.5)),
                  amt = NA_real_, evid = 0L, cmt = "central")
  bind_rows(bolus, obs) |>
    mutate(WT = row$WT, PNA = row$PNA,
           CONMED_DIURETIC = row$CONMED_DIURETIC,
           T_ECMO = row$T_ECMO,
           treatment = row$treatment)
}

nca_events <- nca_scenarios |>
  rowwise() |> group_split() |> lapply(make_bolus_events) |> bind_rows()

stopifnot(!anyDuplicated(unique(nca_events[, c("id", "time", "evid")])))
nca_sim <- rxode2::rxSolve(
  mod_typical, events = nca_events,
  keep = c("treatment", "WT", "T_ECMO", "CONMED_DIURETIC")
) |> as.data.frame()
#> ℹ omega/sigma items treated as zero: 'etalcl', 'etalvc'
#> Warning: multi-subject simulation without without 'omega'
# PKNCA input filter must be `!is.na(Cc)` only; adding `time > 0` or `Cc > 0`
# would drop the time-zero row and trigger the AUC-start warning.
sim_nca <- nca_sim |>
  filter(!is.na(Cc)) |>
  select(id, time, Cc, treatment)

# Guarantee a time=0 row per (id, treatment). For IV bolus a Cc=0 pre-dose is
# the correct extrapolation reference before the first-record instantaneous
# rise; PKNCA's lambda.z back-extrapolation for Cmax after this row is not
# affected because Cmax is observed at t = 0.1 h.
sim_nca <- bind_rows(
  sim_nca,
  sim_nca |> distinct(id, treatment) |> mutate(time = 0, Cc = 0)
) |>
  distinct(id, treatment, time, .keep_all = TRUE) |>
  arrange(id, treatment, time)

conc_obj <- PKNCA::PKNCAconc(
  sim_nca, Cc ~ time | treatment + id,
  concu = "ng/mL", timeu = "h"
)

dose_df <- nca_events |>
  filter(evid == 1L) |>
  select(id, time, amt, treatment)

dose_obj <- PKNCA::PKNCAdose(
  dose_df, amt ~ time | treatment + id,
  doseu = "ug"
)

intervals <- data.frame(
  start       = 0,
  end         = Inf,
  cmax        = TRUE,
  aucinf.obs  = TRUE,
  half.life   = TRUE
)

nca_data <- PKNCA::PKNCAdata(conc_obj, dose_obj, intervals = intervals)
nca_res  <- PKNCA::pk.nca(nca_data)
Comparison against paper-derived expected values
For a 70 kg adult on ECMO at full saturation with no diuretic and full PNA maturation, the model predicts:
- Baseline V = 454 L, ECMO-saturated V = 454 x 1.55 = 703.7 L.
- Baseline CL = 29.9 L/h (unchanged by ECMO; ECMO acts on V only in this model).
- Bolus dose = 5 ug/kg x 70 kg = 350 ug.
- Expected Cmax = dose / V (on-ECMO) = 350 / 703.7 = 0.497 ng/mL.
- Expected AUC0-inf = dose / CL = 350 / 29.9 = 11.71 ng*h/mL.
- Expected half-life = 0.693 x V / CL = 0.693 x 703.7 / 29.9 = 16.31 h.
For the off-ECMO baseline: Cmax = 350 / 454 = 0.771 ng/mL; AUC = 11.71; half-life = 0.693 x 454 / 29.9 = 10.52 h.
For on-ECMO + diuretic: CL x 0.659 = 19.7 L/h; AUC = 350 / 19.7 = 17.77; half-life = 0.693 x 703.7 / 19.7 = 24.76 h.
published <- tibble::tribble(
  ~treatment,               ~cmax,   ~aucinf.obs, ~half.life,
  "on-ECMO, no diuretic",   0.497,   11.71,       16.31,
  "off-ECMO baseline",      0.771,   11.71,       10.52,
  "on-ECMO + diuretic",     0.497,   17.77,       24.76
)

cmp <- nlmixr2lib::ncaComparisonTable(
  simulated     = nca_res,
  reference     = published,
  by            = "treatment",
  units         = c(cmax = "ng/mL", aucinf.obs = "ng*h/mL", half.life = "h"),
  tolerance_pct = 20
)

knitr::kable(
  cmp,
  caption = "Simulated vs paper-derived expected NCA metrics for a 5 ug/kg IV bolus in a 70 kg reference-adult scenario. * marks rows differing by >20%."
)| NCA parameter | treatment | Reference | Simulated | % diff |
|---|---|---|---|---|
| Cmax (ng/mL) | on-ECMO, no diuretic | 0.497 | 0.495 | -0.3% |
| Cmax (ng/mL) | off-ECMO baseline | 0.771 | 0.766 | -0.7% |
| Cmax (ng/mL) | on-ECMO + diuretic | 0.497 | 0.496 | -0.2% |
| AUC0-∞ (obs) (ng*h/mL) | on-ECMO, no diuretic | 11.7 | 11.7 | -0.2% |
| AUC0-∞ (obs) (ng*h/mL) | off-ECMO baseline | 11.7 | 11.7 | -0.4% |
| AUC0-∞ (obs) (ng*h/mL) | on-ECMO + diuretic | 17.8 | 17.7 | -0.2% |
| t½ (h) | on-ECMO, no diuretic | 16.3 | 16.3 | +0.0% |
| t½ (h) | off-ECMO baseline | 10.5 | 10.5 | +0.0% |
| t½ (h) | on-ECMO + diuretic | 24.8 | 24.8 | -0.0% |
Any starred rows would flag a discrepancy between the packaged model and the mass-balance derivation of CL / V; treat them as a check on the extraction, not as a signal to tune parameters.
Assumptions and deviations
-
Diuretic pool composition. The paper’s
DIURETICcolumn pools four classes (furosemide intermittent, furosemide infusion, spironolactone, bumetanide). This vignette maps the paper’sDIURETICvariable to the canonicalCONMED_DIURETICperinst/references/covariate-columns.md; the class composition is documented in the model file’scovariateData[[CONMED_DIURETIC]]$notes. -
T_ECMO after decannulation. Kleiber et al. state
that time-dependent changes in CL or V after ECMO decannulation were not
detected, but they do not explicitly specify whether the
t_ECcovariate resets at decannulation. This extraction assumesT_ECMOcontinues to increase after decannulation; because the sigmoidal Emax function on V saturates by ~72 h on ECMO, the post-decannulation value sits in the saturated region and the multiplier is held at its maximum (i.e. the model does not reverse the ECMO effect on V, matching the paper’s finding). -
PNA unit conversion. The canonical PNA covariate is
in months (Zhao 2018 precedent); Kleiber 2017 reports PNA in weeks. The
model file converts PNA (months) to
pna_weeks = PNA * 4.345insidemodel()so the paper’s reportedT50_PNA = 1.13 weeksandHill = 3.02remain in paper-natural units. - 12-year-old dosing scenario. The paper’s Discussion includes a 12-year- old / 35 kg dosing simulation, but the oldest patient in the actual cohort was 6 years. This vignette uses a 6-year-old / 20 kg patient instead to keep the illustrative simulations within the studied age range. The original 12-year-old scenario is a paper-level extrapolation (paper Discussion caveat: “these parameters cannot be applied to older children”).
- Bootstrap uncertainty not carried through. Table 3 reports bootstrap medians and 2.5-97.5 percentiles for each estimate. This extraction preserves the point estimates; downstream uncertainty propagation would need the bootstrap sample which is not distributed with the paper.
- IIV encoded as diagonal. Table 3 reports only marginal IIV variances (40% CV on CL, 44% CV on V); no CL-V correlation is reported. This extraction encodes the etas as independent; a future revision could introduce a correlated block if a follow-up publication supplies the cross-correlation.
- BLQ handling. 4.2% of observed clonidine samples were below LOQ in the Kleiber 2017 dataset and were ignored during the NONMEM fit. This does not affect the extracted point estimates but users simulating from the model should be aware of the LOQ threshold (paper LC-MS/MS validated range 0.100-20.0 ug/L).