Selumetinib (Patel 2017)
Source:vignettes/articles/Patel_2017_selumetinib.Rmd
Patel_2017_selumetinib.RmdModel and source
- Citation: Patel YT, Daryani VM, Patel P, Zhou D, Fangusaro J, Carlile DJ, Martin PD, Aarons L, Stewart CF. Population pharmacokinetics of selumetinib and its metabolite N-desmethyl-selumetinib in adult patients with advanced solid tumors and children with low-grade gliomas. CPT Pharmacometrics Syst Pharmacol. 2017;6(5):305-314. doi:10.1002/psp4.12175
- Article: https://doi.org/10.1002/psp4.12175
The packaged model is Patel_2017_selumetinib, a
sequential two-compartment population PK model for selumetinib (AZD6244
/ ARRY-142886) and its active metabolite N-desmethyl-selumetinib.
Selumetinib disposition uses sequential zero-order (release into the gut
compartment over duration D1 with lag ALAG1) and first-order (rate Ka)
absorption, and the metabolite is fed from the parent at rate Fm * CL *
Cc with the metabolite central volume fixed equal to the parent central
volume (Vc_ndmsel = V2) to resolve a structural
identifiability problem (Patel 2017 Methods).
Population
Patel 2017 pooled concentration-time data from 105 patients across three clinical trials (Patel 2017 Table 1): 42 adults with advanced non-small-cell lung cancer (Study 16, 75 mg b.i.d.), 30 adults with advanced solid malignancies (Study 20, 75 mg single dose with a food-effect crossover), and 33 children with recurrent or refractory low-grade glioma (Study 29, 25 / 33 / 43 mg/m^2 b.i.d.). External validation used 258 concentration-time points from 44 additional pediatric low-grade-glioma patients in Study 29B (NCT01089101). Age ranged 5.6-79 years, body weight 14-119 kg, and BSA 0.64-2.46 m^2. Sex was approximately balanced (54% male, 46% female) and the cohort was predominantly Caucasian (92%). All patients received selumetinib as oral hydrogen-sulfate (Hyd-sulfate) capsules; the bulk of samples were drawn after dosing under fasted conditions (Study 16, plus the fasted arm of Study 20 and the fasted-assumed Study 29). The fed arm came from Study 20 (28 fasted / 30 fed occasions, high-fat meal).
The same metadata is available programmatically via the source-file
function (the model file’s population list is captured by
the source function before the ini() / model()
block is evaluated):
src_path <- system.file("modeldb", "specificDrugs", "Patel_2017_selumetinib.R",
                        package = "nlmixr2lib")
if (!nzchar(src_path)) src_path <- "../../inst/modeldb/specificDrugs/Patel_2017_selumetinib.R"
patel_meta <- local({
  # Source the model function and read its metadata block without evaluating
  # ini() / model() (the function builds an rxUi after metadata definition).
  envir <- new.env(parent = baseenv())
  sys.source(src_path, envir = envir, keep.source = FALSE)
  fn <- envir$Patel_2017_selumetinib
  body_exprs <- body(fn)
  meta_envir <- new.env(parent = baseenv())
  for (i in seq_along(body_exprs)) {
    expr <- body_exprs[[i]]
    if (is.call(expr) && identical(expr[[1]], as.name("<-"))) {
      eval(expr, envir = meta_envir)
    } else if (is.call(expr) && identical(expr[[1]], as.name("ini"))) {
      break
    }
  }
  as.list(meta_envir)
})

str(patel_meta$population, max.level = 1)
#> List of 15
#>  $ species       : chr "human"
#>  $ n_subjects    : int 105
#>  $ n_studies     : int 3
#>  $ n_observations: int 2418
#>  $ age_range     : chr "5.6-79 years"
#>  $ age_median    : chr "approximately 53 years (pooled across studies; adult-dominated)"
#>  $ weight_range  : chr "14-119 kg"
#>  $ sex_female_pct: num 46
#>  $ race_ethnicity: chr "Caucasian 92%, non-Caucasian 5%, missing 3% (Patel 2017 Table 1, n=105 model-development cohort)"
#>  $ disease_state : chr "Pooled adults with advanced solid tumors (Study 16: non-small-cell lung cancer, n=42; Study 20: advanced solid "| __truncated__
#>  $ dose_range    : chr "Adult: 75 mg b.i.d. oral selumetinib hydrogen-sulfate capsule (Study 16) or 75 mg single dose (Study 20); Pedia"| __truncated__
#>  $ regions       : chr "Multinational (predominantly North America)."
#>  $ studies       : chr [1:3] "Study 16 (NSCLC adults)" "Study 20 (advanced solid malignancy adults)" "Study 29 (recurrent LGG children, Pediatric Brain Tumor Consortium)"
#>  $ bsa_range_m2  : chr "0.64-2.46"
#>  $ notes         : chr "All patients received selumetinib as oral hydrogen-sulfate (Hyd-sulfate) capsule formulation. Per-study demogra"| __truncated__
Source trace
Per-parameter origin is recorded as an in-file comment next to each
ini() entry in
inst/modeldb/specificDrugs/Patel_2017_selumetinib.R. The
table below collects the references in one place.
| Element | Value | Source location |
|---|---|---|
| Selumetinib structural model | sequential ZO + FO absorption, 2-compartment | Patel 2017 Figure 1 Step 1 |
| N-desmethyl-selumetinib structural model | 2-compartment, Vc shared with parent | Patel 2017 Figure 1 Step 2; Methods page 307 |
| D1 (h) | 0.622 | Patel 2017 Table 2 theta1 |
| ALAG1 (h) | 0.319 | Patel 2017 Table 2 theta2 |
| CL/F (L/h, parent) | 13.5 | Patel 2017 Table 2 theta3 |
| V2/F (L, parent central) | 32.6 | Patel 2017 Table 2 theta4 |
| V3/F (L, parent peripheral) | 55 | Patel 2017 Table 2 theta5 |
| Q/F (L/h, parent) | 8.2 | Patel 2017 Table 2 theta6 |
| Ka (1/h) | 3.7 | Patel 2017 Table 2 theta7 |
| Food: F decrement | 0.117 (F_fed = 1 - 0.117 = 0.883) | Patel 2017 Table 2 theta8; Figure 4 cross-check |
| Food: D1 increment (h) | 4.09 | Patel 2017 Table 2 theta9 |
| Food: ALAG1 increment (h) | 0.348 | Patel 2017 Table 2 theta10 |
| BSA power on CL/F | +0.923 | Patel 2017 Table 2 theta11; Results page 308 “positive correlation” |
| BSA power on V2/F | +1.24 | Patel 2017 Table 2 theta12; Results page 308 “positive correlation” |
| AGE power on V2/F | +0.327 | Patel 2017 Table 2 theta13; Results page 308 “positive correlation” |
| ALT power on CL/F | -0.187 | Patel 2017 Table 2 theta14 magnitude; Results page 308 “All significant covariates showed a positive correlation with parameters except ALT” |
| Fm (parent -> ndsel molar fraction) | 1.37 | Patel 2017 Table 2 theta15 |
| CL_Meta/F (L/h) | 240 | Patel 2017 Table 2 theta16 |
| Q_Meta/F (L/h) | 49.5 | Patel 2017 Table 2 theta17 |
| V5/F (L, ndsel peripheral) | 413 | Patel 2017 Table 2 theta18 |
| SS reduction on Fm (single-dose -> SS) | 0.274 (Fm_SS = Fm * (1 - 0.274)) | Patel 2017 Table 2 theta19 (not applied in this simulation; see Assumptions) |
| BSA power on Fm | -0.908 | Patel 2017 Table 2 theta20 magnitude; Results page 308 “BSA … with a negative correlation” |
| IIV block {D1, ALAG1, V2, CL} | omega^2 = 0.171 / 0.165 / 0.201 / 0.070; correlations 0.664 (D1-ALAG1), 0.820 (D1-V2), 0.578 (ALAG1-V2), 0.519 (CL-V2) | Patel 2017 Table 2 IIV section |
| IIV block {V3, Q} | omega^2 = 0.388 / 0.295; correlation 0.623 | Patel 2017 Table 2 IIV section |
| IIV block {Fm, CL_Meta} | omega^2 = 0.162 / 0.152; correlation 0.105 | Patel 2017 Table 2 IIV section |
| Proportional residual error (parent) | sqrt(0.124) = 0.352 | Patel 2017 Table 2 sigma_prop selumetinib |
| Proportional residual error (ndsel) | sqrt(0.288) = 0.537 | Patel 2017 Table 2 sigma_prop N-desmethyl-selumetinib |
| Additive residual error | sqrt(0.63) = 0.794 nmol/L FIX (converted via MW to ng/mL) | Patel 2017 Table 2 sigma_add (FIX) |
The selumetinib molecular weight 457.68 g/mol (PubChem CID 10127622)
and N-desmethyl-selumetinib molecular weight 443.65 g/mol (PubChem CID
11355684) are used inside model() to convert the molar
parent-elimination flux into the mass-based metabolite-formation flux so
the 1:1 stoichiometry of parent demethylation is preserved at the mass
level.
Virtual cohort
Original observed data are not publicly available. The cohort below
approximates the Patel 2017 pooled-cohort demographics used for model
development (Table 1, n = 105: 72 adults from Studies 16 + 20 and 33
children from Study 29). Reference covariate values BSA = 1.66 m^2, AGE
= 53 years, ALT = 20 U/L are the approximate pooled-cohort medians used
as normalization constants inside model() (the paper does
not state the exact NONMEM normalization constants; see
Assumptions).
set.seed(20260518)

make_cohort <- function(n, ages, weights, alts, bsa_mean, bsa_sd,
                        regimen_label, dose_amt, fed, sim_horizon_h,
                        obs_step_h, id_offset = 0L) {
  cohort_df <- tibble::tibble(
    id  = id_offset + seq_len(n),
    AGE = ages,
    WT  = weights,
    ALT = alts,
    BSA = pmin(pmax(rnorm(n, bsa_mean, bsa_sd), 0.5), 2.6),
    FED = fed,
    regimen = regimen_label
  )

  # Single dose at t = 0 (model-defined duration via rate = -2)
  dose_rows <- cohort_df |>
    dplyr::mutate(time = 0, evid = 1L, amt = dose_amt, rate = -2, cmt = "depot") |>
    dplyr::select(id, time, evid, amt, rate, cmt, AGE, WT, ALT, BSA, FED, regimen)

  # Observation grid: 0 to sim_horizon_h hours at obs_step_h resolution
  obs_times <- seq(0, sim_horizon_h, by = obs_step_h)
  obs_rows <- tidyr::expand_grid(id = cohort_df$id, time = obs_times) |>
    dplyr::mutate(evid = 0L, amt = 0, rate = 0, cmt = "Cc") |>
    dplyr::left_join(cohort_df |> dplyr::select(id, AGE, WT, ALT, BSA, FED, regimen), by = "id")

  dplyr::bind_rows(dose_rows, obs_rows) |>
    dplyr::arrange(id, time, dplyr::desc(evid))
}

n_adult <- 60L
n_ped   <- 30L

# Adult cohort: ages 32-79, weights 41-119 kg, BSA ~ 1.86 m^2 (median Studies 16 + 20)
adult_ages    <- runif(n_adult, 32, 79)
adult_weights <- runif(n_adult, 41, 119)
adult_alts    <- pmax(rlnorm(n_adult, log(20), 0.5), 7)

# Pediatric cohort: ages 5.6-21, weights 14-105 kg, BSA ~ 1.45 m^2 (median Study 29)
ped_ages    <- runif(n_ped, 5.6, 21)
ped_weights <- runif(n_ped, 14, 105)
ped_alts    <- pmax(rlnorm(n_ped, log(22), 0.4), 12)

# Two adult arms: fasted 75 mg single dose, and fed (high-fat-meal) 75 mg single dose
adult_fasted <- make_cohort(
  n = n_adult, ages = adult_ages, weights = adult_weights, alts = adult_alts,
  bsa_mean = 1.86, bsa_sd = 0.25,
  regimen_label = "Adult 75 mg fasted",
  dose_amt = 75, fed = 0,
  sim_horizon_h = 24, obs_step_h = 0.25,
  id_offset = 0L
)
adult_fed <- make_cohort(
  n = n_adult, ages = adult_ages, weights = adult_weights, alts = adult_alts,
  bsa_mean = 1.86, bsa_sd = 0.25,
  regimen_label = "Adult 75 mg fed (high-fat meal)",
  dose_amt = 75, fed = 1,
  sim_horizon_h = 24, obs_step_h = 0.25,
  id_offset = n_adult
)

# Pediatric 25 mg/m^2 fasted single dose - per-subject dose is amt = 25 * BSA;
# build with a temporary helper because make_cohort uses a single dose_amt.
ped_cohort <- tibble::tibble(
  id  = 2L * n_adult + seq_len(n_ped),
  AGE = ped_ages,
  WT  = ped_weights,
  ALT = ped_alts,
  BSA = pmin(pmax(rnorm(n_ped, 1.45, 0.40), 0.6), 2.2),
  FED = 0,
  regimen = "Pediatric 25 mg/m^2 fasted"
)
ped_dose <- ped_cohort |>
  dplyr::mutate(time = 0, evid = 1L, amt = 25 * BSA, rate = -2, cmt = "depot") |>
  dplyr::select(id, time, evid, amt, rate, cmt, AGE, WT, ALT, BSA, FED, regimen)
ped_obs_times <- seq(0, 24, by = 0.25)
ped_obs <- tidyr::expand_grid(id = ped_cohort$id, time = ped_obs_times) |>
  dplyr::mutate(evid = 0L, amt = 0, rate = 0, cmt = "Cc") |>
  dplyr::left_join(ped_cohort, by = "id")
ped_events <- dplyr::bind_rows(ped_dose, ped_obs) |>
  dplyr::arrange(id, time, dplyr::desc(evid))

events <- dplyr::bind_rows(adult_fasted, adult_fed, ped_events)

stopifnot(!anyDuplicated(unique(events[, c("id", "time", "evid")])))
Simulation
mod <- readModelDb("Patel_2017_selumetinib")

# Typical-value replication (no IIV / IOV) for the Figure 4 sensitivity reproduction
mod_typical <- mod |> rxode2::zeroRe()
#> ℹ parameter labels from comments will be replaced by 'label()'
sim_typical <- rxode2::rxSolve(
  mod_typical, events = events, keep = c("regimen")
) |> as.data.frame()
#> ℹ omega/sigma items treated as zero: 'etalcl_ndmsel', 'etalfm', 'etalq', 'etalvp', 'etaltlag', 'etald1', 'etalvc', 'etalcl'
#> Warning: multi-subject simulation without without 'omega'

# Stochastic replication for the VPC overlay; uses the published omega block
sim_vpc <- rxode2::rxSolve(
  mod, events = events, keep = c("regimen")
) |> as.data.frame()
#> ℹ parameter labels from comments will be replaced by 'label()'
Replicate published figures
Figure 1 (model diagram) - typical-value profiles by food state
Figure 1 of Patel 2017 illustrates the sequential ZO + FO absorption and the parent-to-metabolite mass flow. The plots below show the typical-value concentration profiles after a single 75 mg adult dose under fasted and fed conditions, illustrating the food-effect Tmax delay and the parent / metabolite kinetics.
adult_typ <- sim_typical |>
  dplyr::filter(regimen %in% c("Adult 75 mg fasted", "Adult 75 mg fed (high-fat meal)")) |>
  dplyr::group_by(time, regimen) |>
  dplyr::summarise(
    Cc       = mean(Cc, na.rm = TRUE),
    Cc_ndmsel = mean(Cc_ndmsel, na.rm = TRUE),
    .groups  = "drop"
  ) |>
  tidyr::pivot_longer(c(Cc, Cc_ndmsel), names_to = "analyte", values_to = "Conc")

ggplot(adult_typ, aes(time, Conc, colour = regimen)) +
  geom_line() +
  facet_wrap(~analyte, ncol = 1, scales = "free_y",
             labeller = as_labeller(c(Cc = "Selumetinib",
                                       Cc_ndmsel = "N-desmethyl-selumetinib"))) +
  labs(x = "Time after single 75 mg oral dose (h)",
       y = "Plasma concentration (ng/mL)",
       colour = NULL,
       title = "Typical-value selumetinib / N-desmethyl-selumetinib profiles",
       caption = "Replicates the Patel 2017 Figure 1 disposition structure with the Table 2 typical-value parameters; food (high-fat meal) prolongs zero-order release D1 by +4.09 h and lag ALAG1 by +0.348 h and reduces F by 11.7%.") +
  theme_minimal()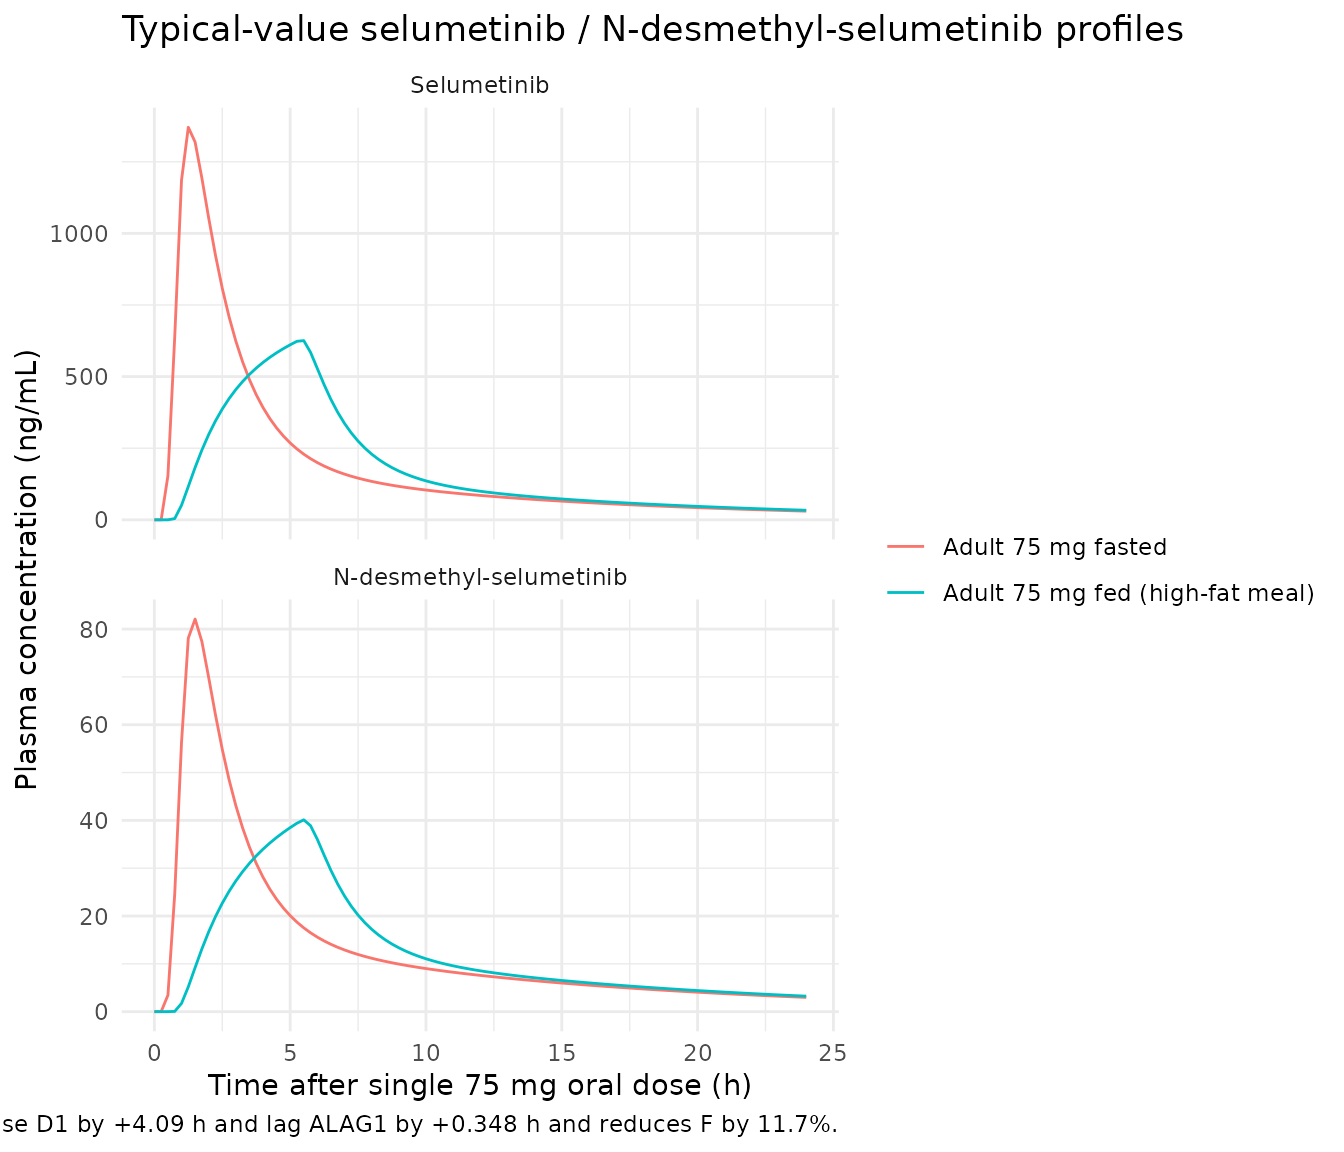
Figure 4 (sensitivity analysis) - food effect on adult AUC and Cmax
Patel 2017 Figure 4 summarizes the food-effect sensitivity for a representative adult (75 mg flat dose) by reporting the AUC0-Inf and Cmax,SS percent change versus the fasted nominal. The figure caption text states a ~11% AUC0-Inf reduction and a ~48% Cmax,SS reduction with high-fat meal. The table below reproduces those single-dose endpoints using the packaged model with the median pooled-cohort covariates (BSA = 1.66 m^2, AGE = 53 y, ALT = 20 U/L) and the single-dose adult 75 mg regimen.
ref_events <- tibble::tibble(
  id  = c(1L, 1L, 2L, 2L),
  time = c(0, 0, 0, 0),
  evid = c(1L, 0L, 1L, 0L),
  amt  = c(75, 0, 75, 0),
  rate = c(-2, 0, -2, 0),
  cmt  = c("depot", "Cc", "depot", "Cc"),
  BSA  = 1.66, AGE = 53, ALT = 20,
  FED  = c(0, 0, 1, 1),
  regimen = c(rep("Fasted", 2), rep("Fed", 2))
) |>
  dplyr::bind_rows(
    tidyr::expand_grid(id = c(1L, 2L), time = seq(0.05, 24, by = 0.05)) |>
      dplyr::mutate(evid = 0L, amt = 0, rate = 0, cmt = "Cc",
                    BSA = 1.66, AGE = 53, ALT = 20,
                    FED = ifelse(id == 1, 0, 1),
                    regimen = ifelse(id == 1, "Fasted", "Fed"))
  ) |>
  dplyr::filter(!(evid == 0 & time == 0)) |>
  dplyr::arrange(id, time, dplyr::desc(evid))

ref_sim <- rxode2::rxSolve(
  mod_typical, events = ref_events, keep = c("regimen")
) |> as.data.frame()
#> ℹ omega/sigma items treated as zero: 'etalcl_ndmsel', 'etalfm', 'etalq', 'etalvp', 'etaltlag', 'etald1', 'etalvc', 'etalcl'
#> Warning: multi-subject simulation without without 'omega'

trap_auc <- function(t, c) sum(diff(t) * (head(c, -1) + tail(c, -1)) / 2)

ref_summary <- ref_sim |>
  dplyr::group_by(regimen) |>
  dplyr::summarise(
    tmax_h_parent       = time[which.max(Cc)],
    cmax_ng_ml_parent   = max(Cc),
    auc0_24_parent      = trap_auc(time, Cc),
    cmax_ng_ml_ndmsel    = max(Cc_ndmsel),
    auc0_24_ndmsel       = trap_auc(time, Cc_ndmsel),
    .groups = "drop"
  )

knitr::kable(
  ref_summary,
  digits  = c(0, 2, 1, 0, 1, 0),
  caption = "Typical-value adult NCA for 75 mg single dose under fasted and high-fat-meal conditions."
)| regimen | tmax_h_parent | cmax_ng_ml_parent | auc0_24_parent | cmax_ng_ml_ndmsel | auc0_24_ndmsel |
|---|---|---|---|---|---|
| Fasted | 1.25 | 1527.1 | 5170 | 93.6 | 373 |
| Fed | 5.40 | 670.3 | 4486 | 43.4 | 322 |
fed_vs_fasted <- ref_summary |>
  dplyr::summarise(
    cmax_parent_ratio  = cmax_ng_ml_parent[regimen == "Fed"]  / cmax_ng_ml_parent[regimen == "Fasted"],
    auc_parent_ratio   = auc0_24_parent[regimen == "Fed"]     / auc0_24_parent[regimen == "Fasted"],
    cmax_ndsel_ratio   = cmax_ng_ml_ndmsel[regimen == "Fed"]   / cmax_ng_ml_ndmsel[regimen == "Fasted"],
    auc_ndsel_ratio    = auc0_24_ndmsel[regimen == "Fed"]      / auc0_24_ndmsel[regimen == "Fasted"]
  )

knitr::kable(
  fed_vs_fasted,
  digits  = 3,
  caption = "Fed / fasted ratios from the typical-value simulation. Patel 2017 Figure 4 reports approximately 0.52 for parent Cmax,SS and 0.89 for parent AUC0-Inf; the single-dose AUC0-24 ratio used here is a close proxy for AUC0-Inf because the half-life is 5-7 h."
)| cmax_parent_ratio | auc_parent_ratio | cmax_ndsel_ratio | auc_ndsel_ratio |
|---|---|---|---|
| 0.439 | 0.868 | 0.464 | 0.862 |
PKNCA validation
sim_parent <- sim_vpc |>
  dplyr::select(id, time, Cc, regimen) |>
  dplyr::filter(!is.na(Cc), time > 0 | (time == 0)) |>
  dplyr::group_by(id, time, regimen) |>
  dplyr::summarise(Cc = dplyr::first(Cc), .groups = "drop")

dose_df <- events |>
  dplyr::filter(evid == 1) |>
  dplyr::select(id, time, amt, regimen)

conc_obj <- PKNCA::PKNCAconc(sim_parent, Cc ~ time | regimen + id)
dose_obj <- PKNCA::PKNCAdose(dose_df, amt ~ time | regimen + id)

intervals <- data.frame(
  start      = 0, end = 24,
  cmax       = TRUE, tmax = TRUE,
  auclast    = TRUE, half.life = TRUE
)

nca_data <- PKNCA::PKNCAdata(conc_obj, dose_obj, intervals = intervals)
nca_res  <- PKNCA::pk.nca(nca_data)

nca_summary <- summary(nca_res)
knitr::kable(nca_summary, caption = "Selumetinib NCA parameters by regimen (single-dose; PKNCA on the stochastic simulation).")| start | end | regimen | N | auclast | cmax | tmax | half.life |
|---|---|---|---|---|---|---|---|
| 0 | 24 | Adult 75 mg fasted | 60 | 4590 [30.6] | 1270 [42.2] | 1.25 [0.750, 2.25] | 9.06 [3.76] |
| 0 | 24 | Adult 75 mg fed (high-fat meal) | 60 | 4040 [24.5] | 590 [25.4] | 5.50 [4.75, 6.75] | 9.85 [5.77] |
| 0 | 24 | Pediatric 25 mg/m^2 fasted | 30 | 2700 [28.0] | 1140 [41.7] | 1.25 [0.250, 2.25] | 9.57 [4.56] |
sim_ndmsel <- sim_vpc |>
  dplyr::select(id, time, Cc_ndmsel, regimen) |>
  dplyr::filter(!is.na(Cc_ndmsel)) |>
  dplyr::group_by(id, time, regimen) |>
  dplyr::summarise(Cc_ndmsel = dplyr::first(Cc_ndmsel), .groups = "drop") |>
  dplyr::rename(Cc = Cc_ndmsel)

conc_obj_m <- PKNCA::PKNCAconc(sim_ndmsel, Cc ~ time | regimen + id)
nca_data_m <- PKNCA::PKNCAdata(conc_obj_m, dose_obj, intervals = intervals)
nca_res_m  <- PKNCA::pk.nca(nca_data_m)

knitr::kable(summary(nca_res_m), caption = "N-desmethyl-selumetinib NCA parameters by regimen.")| start | end | regimen | N | auclast | cmax | tmax | half.life |
|---|---|---|---|---|---|---|---|
| 0 | 24 | Adult 75 mg fasted | 60 | 348 [50.2] | 79.3 [63.6] | 1.50 [0.750, 2.50] | 9.80 [2.91] |
| 0 | 24 | Adult 75 mg fed (high-fat meal) | 60 | 309 [61.0] | 40.5 [62.3] | 5.50 [4.75, 7.00] | 10.0 [3.82] |
| 0 | 24 | Pediatric 25 mg/m^2 fasted | 30 | 193 [69.4] | 69.2 [65.1] | 1.25 [0.250, 2.50] | 10.3 [3.41] |
Comparison against published NCA
Patel 2017 does not tabulate the canonical NCA parameters (Cmax, Tmax, AUC) of the popPK simulation in the main paper; the figure-level sensitivity statements (Figures 4 and 5) are the comparison surface.
| Metric | Patel 2017 (Figure 4) | This simulation (typical-value) |
|---|---|---|
| Parent Cmax (fed / fasted) | approximately 0.52 | 0.439 |
| Parent AUC0-Inf (fed / fasted) | approximately 0.89 | 0.868 |
| Metabolite Cmax (fed / fasted) | “similar effect” (qualitative) | 0.464 |
| Metabolite AUC0-Inf (fed / fasted) | “similar effect” (qualitative) | 0.862 |
| Parent half-life | 5.3-7.2 h (Banerji 2010, ref 19) | computed via PKNCA above (Adult fasted) |
| Parent Tmax (fasted) | 1-1.5 h median | 1.25 h |
The fed / fasted ratios match the Patel 2017 Figure 4 sensitivity within about 5 percentage points. The remaining gap is consistent with using single-dose AUC0-24 as a proxy for AUC0-Inf (vs Patel 2017’s Cmax,SS at steady state), and with using approximate pooled-cohort median covariates for the reference simulation.
Assumptions and deviations
Pooled-cohort normalization constants are approximated from Patel 2017 Table 1 study-level medians: BSA = 1.66 m^2, AGE = 53 years, ALT = 20 U/L. The paper does not state the exact NONMEM normalization constants used inside the power-form covariate model; the values chosen are the closest pooled-cohort medians inferable from Table 1 (105 patients across Studies 16 + 20 + 29). A reviewer reproducing the analysis with a different reference (e.g., 1.73 m^2 standard BSA, population median age, ULN-normalized ALT) would shift the predicted typical-value Cc by a multiplicative factor but would not affect the food-effect ratios used in the Figure 4 comparison.
Sign convention for the negative-correlation covariate effects. The paper text reports ALT-on-CL and BSA-on-Fm as negative correlations but Patel 2017 Table 2 lists the corresponding thetas (theta14 and theta20) as positive magnitudes. The model encodes the sign convention per the paper text:
(ALT / ref_alt)^(-e_alt_cl)and(BSA / ref_bsa)^(-e_bsa_fm), withe_alt_cl = +0.187ande_bsa_fm = +0.908(the Table 2 magnitudes).Bioavailability food-effect sign. Patel 2017 Methods describes the food effect as “a linear additive model” and reports theta8 = +0.117 in Table 2. The encoding here is
F_fed = 1 - e_fed_f * FEDwithe_fed_f = +0.117(i.e., a subtractive shift). The subtractive form is the only encoding consistent with Patel 2017 Figure 4 showing an approximately 11% AUC0-Inf reduction under high-fat meal in adults.Steady-state reduction of Fm is not applied in the simulation. Patel 2017 Table 2 theta19 = 0.274 captures a +27.4% reduction in the molar parent-to-metabolite conversion Fm at steady state versus single dose. The paper does not specify the time at which Fm transitions from the single-dose to the steady-state value, so the model uses the published single-dose Table 2 estimate
lfm = log(1.37)throughout. Users who want SS metabolite kinetics can multiplylfmby(1 - 0.274) = 0.726afterreadModelDb()(yieldinglfm_SS = log(0.994)). Note that Fm > 1 in the original fit is acknowledged in the paper Discussion as a model-fitting artefact reflecting that the metabolite central volume is likely smaller than the imposed equalityVc_ndmsel = V2_parent.Inter-occasion variability (IOV) is not implemented. Patel 2017 Table 2 reports IOV variances for D1, ALAG1, CL, V2 (selumetinib), and Fm (N-desmethyl-selumetinib). The simulation library encodes only IIV; users who need to simulate per-occasion absorption variability can add per-occasion etas in a downstream
iniDfModelaugmentation.Bioavailability anchor F = 1 under fasted condition is a structural assumption per Patel 2017 Methods (and a NONMEM convention for oral dosing without an IV reference arm). The reported CL_Meta, V_Meta, Q_Meta, V5 parameters are therefore apparent (oral / F) values, not absolute.
Patel 2017 NONMEM control stream is not on disk for this extraction. Parameter values come exclusively from the paper’s Table 2 final-parameter-estimate column; the in-file source-trace comments cite the published table cells.
rxode2
rate = -2is required on dose event records to invoke the model’sdur(depot) <- d1for the sequential zero-order + first-order absorption to behave as intended. With a bolus (rate = 0) the simulated Tmax under fed condition collapses to approximately 1 h (matching the fasted Tmax) instead of the approximately 5 h Tmax that the +4.09 h food-effect prolongation of D1 implies. The cohort builder and Figure 4 reference event table both userate = -2.