Polymyxin B-based combination therapy against carbapenem-resistant Klebsiella pneumoniae (Mahadevan 2026)
Source:vignettes/articles/Mahadevan_2026_polymyxinB_combination_CRKP.Rmd
Mahadevan_2026_polymyxinB_combination_CRKP.RmdModel and source
- Article: https://doi.org/10.1128/aac.00782-25
- Citation: Mahadevan R, Garcia E, Sharma R, Qiu H, Elsheikh A, Parambi R, Abboud CS, Pasteran F, Ramirez MS, Kaye KS, Bonomo RA, Rao GG. A mechanism-based pharmacokinetic/pharmacodynamic analysis of polymyxin B-based combination therapy against carbapenem-resistant Klebsiella pneumoniae isolates with diverse phenotypic and genotypic resistance mechanisms. Antimicrob Agents Chemother 2026;70(2):e00782-25. PMCID: PMC12888851.
This is not a population PK model. It is a
mechanism-based PK/PD model (MBM) of bacterial killing, fit with S-ADAPT
1.57 (SADAPT-TRAN, importance sampling, pmethod = 4) to
total viable counts from 24 h static-concentration time-kill (SCTK)
assays. Six carbapenem-resistant K. pneumoniae (CRKP) clinical
isolates were exposed to polymyxin B (PMB), meropenem (MEM) and
fosfomycin (FOF) as monotherapies, as PMB-based double combinations, and
as the PMB + MEM + FOF triple combination.
The authors fit the same structural model separately to each isolate, with isolate-specific parameter values and an isolate-specific choice of which subpopulation phenotypes and which synergy terms were supported. The paper is therefore contributed to nlmixr2lib as six model files, one per isolate:
mahadevan_models <- c(
  "Mahadevan_2026_polymyxinB_meropenem_fosfomycin_BRKP61",
  "Mahadevan_2026_polymyxinB_meropenem_fosfomycin_BRKP76",
  "Mahadevan_2026_polymyxinB_meropenem_fosfomycin_KP00161",
  "Mahadevan_2026_polymyxinB_meropenem_fosfomycin_KP00521",
  "Mahadevan_2026_polymyxinB_meropenem_fosfomycin_BRKP67",
  "Mahadevan_2026_polymyxinB_meropenem_fosfomycin_BRKP28"
)
isolate_label <- c(
  Mahadevan_2026_polymyxinB_meropenem_fosfomycin_BRKP61  = "BRKP61",
  Mahadevan_2026_polymyxinB_meropenem_fosfomycin_BRKP76  = "BRKP76",
  Mahadevan_2026_polymyxinB_meropenem_fosfomycin_KP00161 = "KP0016-1",
  Mahadevan_2026_polymyxinB_meropenem_fosfomycin_KP00521 = "KP0052-1",
  Mahadevan_2026_polymyxinB_meropenem_fosfomycin_BRKP67  = "BRKP67",
  Mahadevan_2026_polymyxinB_meropenem_fosfomycin_BRKP28  = "BRKP28"
)
uis <- lapply(mahadevan_models, function(n) rxode2::rxode(readModelDb(n)))
names(uis) <- mahadevan_models
uis[[1]]$state
#> [1] "bact_intermediate_resistant_resistant1"
#> [2] "bact_intermediate_resistant_resistant2"
#> [3] "bact_resistant_intermediate_intermediate1"
#> [4] "bact_resistant_intermediate_intermediate2"
#> [5] "cpmb"
#> [6] "cmem"
#> [7] "cfof"
The three antibiotic exposures cpmb, cmem
and cfof are state variables that the user doses. In the
SCTK assays they were constant, so each model defaults to
d/dt(cpmb) = 0 and so on; a user simulating a clinical
regimen attaches elimination terms or drives the states from an external
population PK model.
Because there is no absorption-distribution-elimination profile to integrate, PKNCA / NCA is not an appropriate validation. The checks below are the mechanistic equivalents: an antibiotic-free carrying-capacity hold, a parameter read-back audit against Table 2, closed-form checks of the mechanistic-synergy function, reproduction of the published bactericidal-activity counts, and replication of Figure 3.
Population (biological context)
Four isolates (BRKP28, BRKP61, BRKP67, BRKP76) came from individual patients at Instituto Dante Pazzanese de Cardiologia (Sao Paulo, Brazil); two (KP0016-1, KP0052-1) came from Siriraj Hospital (Bangkok, Thailand). All SCTK experiments used cation-adjusted Mueller-Hinton broth (25.0 mg/L Ca2+, 12.5 mg/L Mg2+) supplemented with 25 mg/L glucose-6-phosphate, at a starting inoculum of about 10^6 CFU/mL, with viable counts at 0, 1, 2, 4, 6, 8 and 24 h and an LLOQ of 2 log10 CFU/mL.
Susceptibility and resistance-gene profiles (Table 1 of the source; full gene characterisation in Table S2):
| Isolate | Carbapenemase | mgrB | ompK35 | ompK36 | ompK37 | PMB MIC (mg/L) | MEM MIC (mg/L) | FOF MIC (mg/L) |
|---|---|---|---|---|---|---|---|---|
| BRKP28 | blaKPC-2 | NF | NF | NF | Present | >128 (R) | 256 (R) | 128 (R) |
| BRKP61 | blaKPC-2 | F | NF | NF | Present | <0.5 (I) | 128 (R) | 256 (R) |
| BRKP67 | blaKPC-2 | NF | NF | NF | Present | 8 (R) | 64 (R) | 32 (R) |
| BRKP76 | blaKPC-2 | F | NF | NF | NF | <0.5 (I) | 64 (R) | 32 (R) |
| KP0016-1 | none | F | NF | NF | NF | <0.5 (I) | 64 (R) | 64 (R) |
| KP0052-1 | blaNDM-4 | F | Present | Present | Present | <0.5 (I) | 64 (R) | 64 (R) |
NF = non-functional, F = functional. PMB and MEM MICs use CLSI breakpoints for K. pneumoniae; FOF MICs use the EUCAST intravenous-fosfomycin breakpoint for E. coli because CLSI publishes none for K. pneumoniae.
The same metadata are available programmatically:
pop <- uis[["Mahadevan_2026_polymyxinB_meropenem_fosfomycin_BRKP28"]]$population
str(pop[c("species", "organism", "resistance_genes", "starting_inoculum")])
#> List of 4
#>  $ species          : chr "in vitro (Klebsiella pneumoniae BRKP28, carbapenem-resistant clinical isolate)"
#>  $ organism         : chr "Klebsiella pneumoniae BRKP28, obtained from an individual patient at Instituto Dante Pazzanese de Cardiologia, "| __truncated__
#>  $ resistance_genes : chr "blaKPC-2; non-functional mgrB (premature stop codon); non-functional ompK35 (terminated at 144 amino acids) and"| __truncated__
#>  $ starting_inoculum: chr "~10^6 CFU/mL; the model estimated 10^6.32 CFU/mL for this isolate"
Source trace
Every ini() entry in the six files under
inst/modeldb/specificDrugs/Mahadevan_2026_polymyxinB_meropenem_fosfomycin_*.R
carries an in-file comment naming its Table 2 row. The structural model
comes from Materials and Methods, “Mechanism based PK/PD model
development”.
| Equation / quantity | Source location |
|---|---|
CFUtot = sum of the four bacterial states |
Equation 1 |
State-1 ODE:
2 * PLAT * k21 * state2 - k12 * state1 - kill * state1; IC
= CFU0 * MF
|
Equation 2 |
State-2 ODE:
-k21 * state2 + k12 * state1 - kill * state2; IC = 0 |
Equation 3 |
Plateau factor PLAT = 1 - CFUtot / (CFUMAX + CFUtot);
replication factor REP = 2 * PLAT
|
Equation 3, in-line definition |
k21 fixed to 50 per h; k12 estimated per
subpopulation as the inverse of the mean generation time |
Methods, after equation 3 |
Hill killing Kill = KMAX * C^h / (KC50^h + C^h)
|
Equation 4 |
Mechanistic synergy
1 - IMAX * CPMB^h / (CPMB^h + IC50^h)
|
Equation 5 |
| Synergy multiplies the meropenem KC50 inside the Hill denominator | Equation 6 |
| Synergy multiplies the fosfomycin KC50 inside the Hill denominator | Equation 7 |
| All parameter point estimates and %CVs, per isolate | Table 2 |
| Additive residual error on log10 CFU/mL; BLQ by Beal M3 | Methods, end of the model-development section; Table 2 “Variability model” |
| Isolate resistance genes and MICs | Table 1; Table S2 |
| Model-predicted triple-combination profiles | Figure 3 |
Units and dimensional analysis
| Symbol | Meaning | Units |
|---|---|---|
bact_*1, bact_*2
|
Bulitta life-cycle bacterial states (1 = vegetative, 2 = replicating) | CFU/mL |
cpmb, cmem, cfof
|
polymyxin B / meropenem / fosfomycin bath concentrations | mg/L |
lk21, k12_*, kmax_*,
kill_*
|
rate constants (lk21 on the natural-log scale) |
1/h |
kc50_*, ic50_*
|
half-effect concentrations | mg/L |
mgt_* |
mean generation times | min |
log10cfu0, log10cfumax,
log10mf_*
|
base-10 logs of CFU/mL or of a fraction | log10 units |
hill_*, plat, syn_mem,
syn_fof, imax_*
|
dimensionless | – |
Every growth and kill term is (1/h) x (CFU/mL) = (CFU/mL)/h, matching
d/dt(bact_*). The 60 in k12 = 60 / mgt carries
units of min/h and converts the tabulated mean generation time (min)
into a rate (1/h). Inside the Hill denominators the synergy factor is
dimensionless, so kc50 * syn remains in mg/L and matches
C^h term by term.
Parameter read-back audit against Table 2
This is an enumerating audit: every parameter of every one of the six files is read back out of the built model and compared against an independent transcription of Table 2. A typo in any cell of any file fails the render.
One reference value is not taken from Table 2: kmax_pmb
for BRKP61 is 13.42, the precision the Results text gives, where Table 2
rounds the same estimate to 13.4 (see the Errata). Every other cell
below is Table 2 verbatim.
table2 <- list(
  BRKP61 = c(log10cfu0 = 6.11, log10cfumax = 9.33, lk21 = log(50),
             mgt_irr = 83.3, mgt_rii = 13.5, log10mf_rii = -5.10,
             kmax_pmb = 13.42, kc50_pmb_i = 0.82, kc50_pmb_r = 41.03, hill_pmb = 0.64,
             kmax_mem = 2.13, kc50_mem_i = 24.7, kc50_mem_r = 61.4, hill_mem = 1.85,
             kmax_fof = 3.74, kc50_fof_i = 42.5, kc50_fof_r = 44.71, hill_fof = 0.61,
             imax_mem_pmb = 0.84, ic50_mem_pmb = 0.51, hill_syn_mem = 0.88,
             imax_fof_pmb = 0.99, ic50_fof_pmb = 0.64, hill_syn_fof = 0.72,
             addSd = 0.39),
  BRKP76 = c(log10cfu0 = 6.18, log10cfumax = 9.05, lk21 = log(50),
             mgt_iii = 72.1, mgt_rrr = 30.92, log10mf_rrr = -5.48,
             kmax_pmb = 11.2, kc50_pmb_i = 2.20, kc50_pmb_r = 79.2, hill_pmb = 1.01,
             kmax_mem = 5.41, kc50_mem_i = 18.9, kc50_mem_r = 328, hill_mem = 1.26,
             kmax_fof = 3.03, kc50_fof_i = 21.1, kc50_fof_r = 647.5, hill_fof = 0.64,
             imax_mem_pmb = 0.83, ic50_mem_pmb = 0.49, hill_syn_mem = 0.54,
             imax_fof_pmb = 0.81, ic50_fof_pmb = 0.58, hill_syn_fof = 0.52,
             addSd = 0.54),
  `KP0016-1` = c(log10cfu0 = 6.0, log10cfumax = 8.43, lk21 = log(50),
             mgt_iii = 98.3, mgt_rrr = 69.26, log10mf_rrr = -4.29,
             kmax_pmb = 10.9, kc50_pmb_i = 6.56, kc50_pmb_r = 61.16, hill_pmb = 1.09,
             kmax_mem = 1.56, kc50_mem_i = 112, kc50_mem_r = 424, hill_mem = 1.99,
             kmax_fof = 0.64, kc50_fof_i = 20.2, kc50_fof_r = 448, hill_fof = 0.79,
             imax_mem_pmb = 0.88, ic50_mem_pmb = 0.50, hill_syn_mem = 0.63,
             imax_fof_pmb = 0.89, ic50_fof_pmb = 0.59, hill_syn_fof = 0.56,
             addSd = 0.45),
  `KP0052-1` = c(log10cfu0 = 5.86, log10cfumax = 9.10, lk21 = log(50),
             mgt_iii = 43.3, mgt_rrr = 32.5, log10mf_rrr = -5.15,
             kmax_pmb = 6.61, kc50_pmb_i = 2.68, kc50_pmb_r = 38.34, hill_pmb = 0.79,
             kmax_mem = 3.05, kc50_mem_i = 44.2, kc50_mem_r = 284, hill_mem = 0.84,
             kmax_fof = 4.01, kc50_fof_i = 26.1, kc50_fof_r = 761.7, hill_fof = 0.77,
             addSd = 0.77),
  BRKP67 = c(log10cfu0 = 5.93, log10cfumax = 9.44, lk21 = log(50),
             mgt_iii = 32.3, mgt_rrr = 31.9, log10mf_rrr = -4.80,
             kmax_pmb = 9.08, kc50_pmb_i = 2.77, kc50_pmb_r = 96.78, hill_pmb = 0.82,
             kmax_mem = 4.16, kc50_mem_i = 8.91, kc50_mem_r = 227, hill_mem = 1.17,
             kmax_fof = 3.45, kc50_fof_i = 20.4, kc50_fof_r = 1000, hill_fof = 0.36,
             addSd = 0.52),
  BRKP28 = c(log10cfu0 = 6.32, log10cfumax = 9.35, lk21 = log(50),
             mgt_rri = 44.25, mgt_rrr = 19.1, log10mf_rrr = -6.55,
             kmax_pmb = 3.61, kc50_pmb_r = 38.82, hill_pmb = 1.44,
             kmax_mem = 3.70, kc50_mem_r = 228, hill_mem = 1.43,
             kmax_fof = 3.42, kc50_fof_i = 22.0, kc50_fof_r = 1342, hill_fof = 0.35,
             addSd = 0.25)
)

audit <- lapply(mahadevan_models, function(m) {
  lab <- unname(isolate_label[m])
  th <- uis[[m]]$theta
  ref <- table2[[lab]]
  stopifnot(setequal(names(th), names(ref)))
  data.frame(
    isolate      = lab,
    n_parameters = length(th),
    max_abs_diff = max(abs(unname(th[names(ref)]) - unname(ref)))
  )
}) |> do.call(rbind, args = _)

# Exact match required: these are transcribed constants, not fitted values.
stopifnot(all(audit$max_abs_diff == 0))
knitr::kable(
  audit |> dplyr::rename("Isolate" = isolate,
                         "Parameters" = n_parameters,
                         "Max |file - Table 2|" = max_abs_diff),
  caption = "Every parameter of every file matches the independent transcription exactly (Table 2 throughout, except KmaxPMB for BRKP61, which uses the Results-text precision)."
)| Isolate | Parameters | Max |file - Table 2| |
|---|---|---|
| BRKP61 | 25 | 0 |
| BRKP76 | 25 | 0 |
| KP0016-1 | 25 | 0 |
| KP0052-1 | 19 | 0 |
| BRKP67 | 19 | 0 |
| BRKP28 | 17 | 0 |
Note the differing parameter counts: BRKP61, BRKP76 and KP0016-1
carry the six mechanistic-synergy parameters, KP0052-1 and BRKP67 do
not, and BRKP28 in addition drops kc50_pmb_i and
kc50_mem_i because both of its subpopulations are polymyxin
B- and meropenem-resistant. Those are the “-” cells of Table 2.
Published summary claims, read back out of the built models
theta_of <- function(lab, p) {
  m <- names(isolate_label)[isolate_label == lab]
  th <- uis[[m]]$theta
  if (p %in% names(th)) unname(th[[p]]) else NA_real_
}
labs <- unname(isolate_label[mahadevan_models])

kmax_pmb <- vapply(labs, theta_of, numeric(1), p = "kmax_pmb")
imax_mem <- vapply(labs, theta_of, numeric(1), p = "imax_mem_pmb")
imax_fof <- vapply(labs, theta_of, numeric(1), p = "imax_fof_pmb")
ic50_mem <- vapply(labs, theta_of, numeric(1), p = "ic50_mem_pmb")
ic50_fof <- vapply(labs, theta_of, numeric(1), p = "ic50_fof_pmb")

claims <- tibble::tribble(
  ~Claim,                                                                  ~Source,       ~Published,       ~Model,
  "Lowest KmaxPMB is BRKP28",                                              "Abstract",    "3.61 1/h",       sprintf("%.2f 1/h (%s)", min(kmax_pmb), labs[which.min(kmax_pmb)]),
  "KmaxPMB of the other five isolates",                                    "Results",     "6.61-13.42 1/h", sprintf("%.2f-%.2f 1/h", min(kmax_pmb[labs != "BRKP28"]), max(kmax_pmb[labs != "BRKP28"])),
  "Lowest KmaxMEM is KP0016-1",                                            "Results",     "1.56 1/h",       sprintf("%.2f 1/h (%s)", min(vapply(labs, theta_of, numeric(1), p = "kmax_mem")), labs[which.min(vapply(labs, theta_of, numeric(1), p = "kmax_mem"))]),
  "Lowest KmaxFOF is KP0016-1",                                            "Results",     "0.64 1/h",       sprintf("%.2f 1/h (%s)", min(vapply(labs, theta_of, numeric(1), p = "kmax_fof")), labs[which.min(vapply(labs, theta_of, numeric(1), p = "kmax_fof"))]),
  "Mechanistic synergy with meropenem (Imax)",                             "Abstract",    "83%-88%",        sprintf("%.0f%%-%.0f%%", 100 * min(imax_mem, na.rm = TRUE), 100 * max(imax_mem, na.rm = TRUE)),
  "Mechanistic synergy with fosfomycin (Imax)",                            "Results",     "0.81, 0.89, 0.99", paste(sprintf("%.2f", sort(imax_fof[!is.na(imax_fof)])), collapse = ", "),
  "PMB concentration giving 50% of maximum synergy",                       "Abstract",    "0.49-0.64 mg/L", sprintf("%.2f-%.2f mg/L", min(c(ic50_mem, ic50_fof), na.rm = TRUE), max(c(ic50_mem, ic50_fof), na.rm = TRUE)),
  "Number of isolates carrying mechanistic synergy",                       "Abstract",    "3",              as.character(sum(!is.na(imax_mem)))
)

# Hard gates on the numeric claims.
stopifnot(
  labs[which.min(kmax_pmb)] == "BRKP28",
  abs(min(kmax_pmb) - 3.61) < 1e-9,
  abs(min(kmax_pmb[labs != "BRKP28"]) - 6.61) < 1e-9,
  abs(max(kmax_pmb[labs != "BRKP28"]) - 13.42) < 1e-9,
  abs(min(imax_mem, na.rm = TRUE) - 0.83) < 1e-9,
  abs(max(imax_mem, na.rm = TRUE) - 0.88) < 1e-9,
  abs(min(c(ic50_mem, ic50_fof), na.rm = TRUE) - 0.49) < 1e-9,
  abs(max(c(ic50_mem, ic50_fof), na.rm = TRUE) - 0.64) < 1e-9,
  sum(!is.na(imax_mem)) == 3L
)
knitr::kable(claims, caption = "Summary claims from the Abstract and Results, recomputed from the six built model files.")| Claim | Source | Published | Model |
|---|---|---|---|
| Lowest KmaxPMB is BRKP28 | Abstract | 3.61 1/h | 3.61 1/h (BRKP28) |
| KmaxPMB of the other five isolates | Results | 6.61-13.42 1/h | 6.61-13.42 1/h |
| Lowest KmaxMEM is KP0016-1 | Results | 1.56 1/h | 1.56 1/h (KP0016-1) |
| Lowest KmaxFOF is KP0016-1 | Results | 0.64 1/h | 0.64 1/h (KP0016-1) |
| Mechanistic synergy with meropenem (Imax) | Abstract | 83%-88% | 83%-88% |
| Mechanistic synergy with fosfomycin (Imax) | Results | 0.81, 0.89, 0.99 | 0.81, 0.89, 0.99 |
| PMB concentration giving 50% of maximum synergy | Abstract | 0.49-0.64 mg/L | 0.49-0.64 mg/L |
| Number of isolates carrying mechanistic synergy | Abstract | 3 | 3 |
Carrying-capacity (growth-control) check
With no antibiotic, the population must start at
10^log10cfu0 and grow to 10^log10cfumax. For
the plateau factor PLAT = 1 - CFUtot / (CFUMAX + CFUtot)
the replication factor REP = 2 * PLAT equals 1 exactly at
CFUtot = CFUMAX, so replication then just replaces the
parent cell and the population settles at CFUMAX (not at
half of it). The two slow-growing isolates (BRKP76, KP0016-1) have not
quite arrived by the 24 h experimental horizon, so the plateau is read
at 96 h.
solve_sctk <- function(ui, pmb = 0, mem = 0, fof = 0, tmax = 24, by = 0.25) {
  ev <- rxode2::et(amt = pmb, cmt = "cpmb", time = 0) |>
    rxode2::et(amt = mem, cmt = "cmem", time = 0) |>
    rxode2::et(amt = fof, cmt = "cfof", time = 0) |>
    rxode2::et(seq(0, tmax, by = by))
  rxode2::rxSolve(ui, ev, method = "lsoda", atol = 1e-10, rtol = 1e-10,
                  maxsteps = 1e6, returnType = "data.frame")
}

gc <- lapply(mahadevan_models, function(m) {
  s <- solve_sctk(uis[[m]], tmax = 96, by = 0.5)
  th <- uis[[m]]$theta
  data.frame(
    isolate       = unname(isolate_label[m]),
    inoculum_sim  = s$log_cfu[1],
    inoculum_tab  = unname(th[["log10cfu0"]]),
    plateau_sim   = max(s$log_cfu),
    plateau_tab   = unname(th[["log10cfumax"]])
  )
}) |> do.call(rbind, args = _)

stopifnot(
  max(abs(gc$inoculum_sim - gc$inoculum_tab)) < 1e-6,
  max(abs(gc$plateau_sim  - gc$plateau_tab))  < 1e-3,
  # The plateau is an upper bound, never overshot.
  all(gc$plateau_sim <= gc$plateau_tab + 1e-9)
)
knitr::kable(
  gc |> mutate(across(where(is.numeric), \(x) round(x, 4))) |>
    dplyr::rename("Isolate" = isolate,
                  "Inoculum simulated" = inoculum_sim,
                  "Inoculum Table 2" = inoculum_tab,
                  "Plateau simulated (96 h)" = plateau_sim,
                  "Plateau Table 2" = plateau_tab),
  caption = "Antibiotic-free growth reproduces log10 CFU0 at time zero and log10 CFUmax at the plateau, for all six isolates."
)| Isolate | Inoculum simulated | Inoculum Table 2 | Plateau simulated (96 h) | Plateau Table 2 |
|---|---|---|---|---|
| BRKP61 | 6.11 | 6.11 | 9.33 | 9.33 |
| BRKP76 | 6.18 | 6.18 | 9.05 | 9.05 |
| KP0016-1 | 6.00 | 6.00 | 8.43 | 8.43 |
| KP0052-1 | 5.86 | 5.86 | 9.10 | 9.10 |
| BRKP67 | 5.93 | 5.93 | 9.44 | 9.44 |
| BRKP28 | 6.32 | 6.32 | 9.35 | 9.35 |
gc_curves <- lapply(mahadevan_models, function(m) {
  s <- solve_sctk(uis[[m]], tmax = 24, by = 0.25)
  data.frame(isolate = unname(isolate_label[m]), time = s$time, log10cfu = s$log_cfu)
}) |> do.call(rbind, args = _)

ggplot(gc_curves, aes(time, log10cfu, colour = isolate)) +
  geom_line(linewidth = 0.8) +
  scale_x_continuous(breaks = seq(0, 24, by = 4)) +
  labs(x = "Time (h)", y = expression(log[10] ~ CFU / mL), colour = NULL,
       title = "Antibiotic-free growth control, all six isolates",
       caption = "Reproduces the black growth-control curves of Figure 3.") +
  theme(legend.position = "bottom")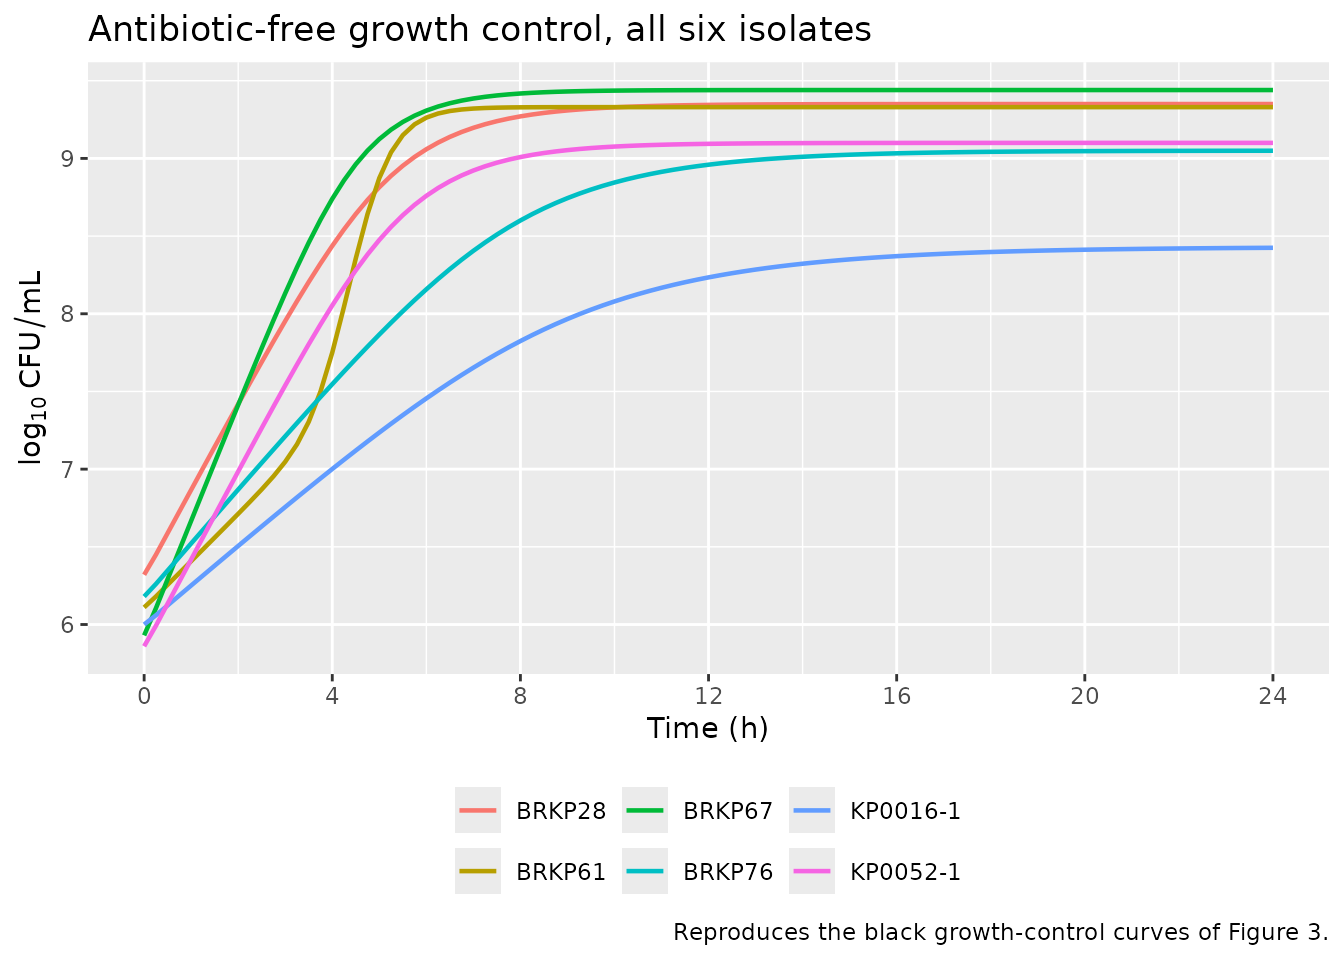
Mechanistic-synergy function (closed-form checks)
Equation 5 defines
Mechanistic_synergy = 1 - IMAX * CPMB^h / (CPMB^h + IC50^h),
which multiplies the meropenem and fosfomycin KC50 inside the Hill
denominator (equations 6 and 7). Two properties follow analytically and
are checked exactly:
- at
CPMB = IC50the function equals1 - IMAX / 2, i.e. half of the maximum synergy is achieved – this is the Abstract’s claim that “0.49-0.64 mg/L was sufficient to achieve 50% of the maximum synergy”; - as
CPMBgrows without bound the function tends to1 - IMAX, so the effective KC50 falls by a factor of1 / (1 - IMAX).
syn <- function(cpmb, imax, ic50, h) 1 - imax * cpmb^h / (cpmb^h + ic50^h)

syn_models <- mahadevan_models[!is.na(imax_mem)]
syn_tab <- lapply(syn_models, function(m) {
  th <- uis[[m]]$theta
  rbind(
    data.frame(isolate = unname(isolate_label[m]), companion = "meropenem",
               imax = unname(th[["imax_mem_pmb"]]), ic50 = unname(th[["ic50_mem_pmb"]]),
               hill = unname(th[["hill_syn_mem"]])),
    data.frame(isolate = unname(isolate_label[m]), companion = "fosfomycin",
               imax = unname(th[["imax_fof_pmb"]]), ic50 = unname(th[["ic50_fof_pmb"]]),
               hill = unname(th[["hill_syn_fof"]]))
  )
}) |> do.call(rbind, args = _) |>
  mutate(
    syn_at_ic50    = syn(ic50, imax, ic50, hill),
    half_max_check = 1 - imax / 2,
    fold_decrease  = 1 / (1 - imax)
  )

stopifnot(
  max(abs(syn_tab$syn_at_ic50 - syn_tab$half_max_check)) < 1e-12,
  # Saturating polymyxin B leaves exactly the (1 - Imax) fraction of the KC50.
  # The Hill coefficients here are all below 1, so the approach to the limit is
  # slow in CPMB; 1e40 mg/L drives the residual below 1e-9 for every row.
  max(abs(syn(1e40, syn_tab$imax, syn_tab$ic50, syn_tab$hill) -
            (1 - syn_tab$imax))) < 1e-9,
  # Monotone decreasing in CPMB, and bounded by the two analytic endpoints.
  all(syn_tab$syn_at_ic50 < 1), all(syn_tab$syn_at_ic50 > 1 - syn_tab$imax)
)
knitr::kable(
  syn_tab |> mutate(across(where(is.numeric), \(x) round(x, 4))) |>
    select(isolate, companion, imax, ic50, hill, syn_at_ic50, fold_decrease) |>
    dplyr::rename("Isolate" = isolate, "Companion drug" = companion,
                  "Imax" = imax, "IC50 (mg/L)" = ic50, "Hill" = hill,
                  "Synergy factor at IC50" = syn_at_ic50,
                  "Max fold decrease in KC50" = fold_decrease),
  caption = "Mechanistic-synergy parameters (Table 2) and the exact analytic consequences of equation 5."
)| Isolate | Companion drug | Imax | IC50 (mg/L) | Hill | Synergy factor at IC50 | Max fold decrease in KC50 |
|---|---|---|---|---|---|---|
| BRKP61 | meropenem | 0.84 | 0.51 | 0.88 | 0.580 | 6.2500 |
| BRKP61 | fosfomycin | 0.99 | 0.64 | 0.72 | 0.505 | 100.0000 |
| BRKP76 | meropenem | 0.83 | 0.49 | 0.54 | 0.585 | 5.8824 |
| BRKP76 | fosfomycin | 0.81 | 0.58 | 0.52 | 0.595 | 5.2632 |
| KP0016-1 | meropenem | 0.88 | 0.50 | 0.63 | 0.560 | 8.3333 |
| KP0016-1 | fosfomycin | 0.89 | 0.59 | 0.56 | 0.555 | 9.0909 |
syn_curve <- syn_tab |>
  tidyr::crossing(cpmb = c(0, exp(seq(log(1e-3), log(64), length.out = 120)))) |>
  mutate(synergy_factor = syn(cpmb, imax, ic50, hill))

ggplot(syn_curve, aes(cpmb, synergy_factor, colour = isolate, linetype = companion)) +
  geom_line(linewidth = 0.8) +
  scale_x_log10() +
  labs(x = "Polymyxin B (mg/L, log scale)",
       y = "Multiplier applied to the companion-drug KC50",
       colour = NULL, linetype = NULL,
       title = "Mechanistic synergy of polymyxin B (equation 5)",
       caption = "Sub-mg/L polymyxin B already delivers half of the maximum KC50 reduction.") +
  theme(legend.position = "bottom")
#> Warning in scale_x_log10(): log-10 transformation introduced infinite values.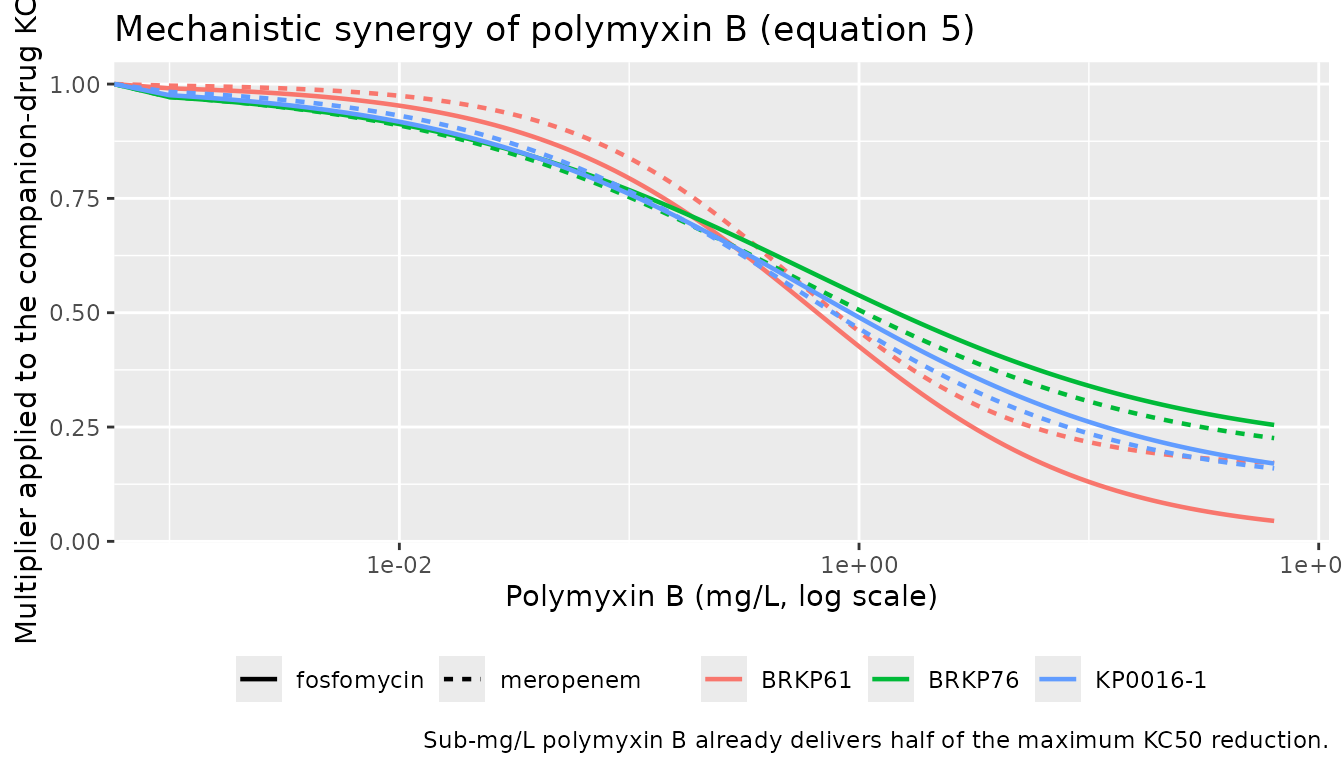
Bactericidal activity of the triple combination (Figure 1A)
The paper defines bactericidal activity as a reduction of at least 3 log10 CFU/mL at 24 h relative to the initial inoculum, and reports for the triple combination that “Increasing polymyxin B concentration from 2 to 4 mg/L enhanced bactericidal activity … the triple combination (PMB-MEM-FOF: 67% to 83%)”. With six isolates, 67% is 4/6 and 83% is 5/6. The triple-combination companion concentrations are given in the Results as MEM 40 mg/L + FOF 75 mg/L.
delta24 <- function(m, pmb, mem, fof) {
  s <- solve_sctk(uis[[m]], pmb = pmb, mem = mem, fof = fof, tmax = 24, by = 0.25)
  s$log_cfu[nrow(s)] - unname(uis[[m]]$theta[["log10cfu0"]])
}

triple <- tidyr::crossing(model = mahadevan_models, pmb = c(2, 4)) |>
  rowwise() |>
  mutate(isolate = unname(isolate_label[model]),
         change_24h = delta24(model, pmb, 40, 75),
         bactericidal = change_24h <= -3) |>
  ungroup()

counts <- triple |> group_by(pmb) |> summarise(n_bactericidal = sum(bactericidal),
                                               .groups = "drop")

fails <- function(p) sort(triple$isolate[triple$pmb == p & !triple$bactericidal])

# Hard gate: reproduce the published 67% (4/6) and 83% (5/6) counts exactly, and
# name which isolates fall short at each polymyxin B level.
stopifnot(
  identical(counts$n_bactericidal[counts$pmb == 2], 4L),
  identical(counts$n_bactericidal[counts$pmb == 4], 5L),
  # Raising polymyxin B from 2 to 4 mg/L rescues KP0016-1 and only KP0016-1 --
  # the Results single this isolate out as the one needing the higher exposure.
  identical(fails(2), c("BRKP28", "KP0016-1")),
  identical(fails(4), "BRKP28"),
  # BRKP28 is the only isolate whose population still grows over 24 h.
  identical(sort(unique(triple$isolate[triple$change_24h > 0])), "BRKP28")
)

knitr::kable(
  triple |>
    select(isolate, pmb, change_24h, bactericidal) |>
    mutate(change_24h = round(change_24h, 2)) |>
    tidyr::pivot_wider(names_from = pmb,
                       values_from = c(change_24h, bactericidal)) |>
    dplyr::rename("Isolate" = isolate,
                  "24 h change, PMB 2 mg/L" = change_24h_2,
                  "24 h change, PMB 4 mg/L" = change_24h_4,
                  "Bactericidal at PMB 2" = bactericidal_2,
                  "Bactericidal at PMB 4" = bactericidal_4),
  caption = "Triple combination (MEM 40 mg/L + FOF 75 mg/L): 24 h change in log10 CFU/mL. 4/6 isolates are bactericidal at PMB 2 mg/L and 5/6 at PMB 4 mg/L, matching the 67% and 83% reported in Figure 1A."
)| Isolate | 24 h change, PMB 2 mg/L | 24 h change, PMB 4 mg/L | Bactericidal at PMB 2 | Bactericidal at PMB 4 |
|---|---|---|---|---|
| BRKP28 | 2.63 | 2.60 | FALSE | FALSE |
| BRKP61 | -12.11 | -12.11 | TRUE | TRUE |
| BRKP67 | -5.50 | -8.19 | TRUE | TRUE |
| BRKP76 | -8.08 | -12.12 | TRUE | TRUE |
| KP0016-1 | -1.40 | -4.95 | FALSE | TRUE |
| KP0052-1 | -4.44 | -8.24 | TRUE | TRUE |
The two isolates that fall short at polymyxin B 2 mg/L are KP0016-1 and BRKP28, and raising polymyxin B to 4 mg/L rescues KP0016-1 alone. That is precisely the pair of statements the Results make: the non-carbapenemase producer KP0016-1 “resulted in only a 51.7% reduction in AUC_CFU. Increasing the median exposure to 49.0 mg-h/L enhanced the reduction to 67.7%”, while BRKP28 “exhibited only a modest reduction in bacterial load … The triple-drug regimen also failed to produce a meaningful reduction.” BRKP28 – resistant to all three drugs, with the lowest polymyxin B killing rate constant of the six – is the only isolate whose population still grows over 24 h.
Replicate Figure 3 (triple combination across six isolates)
Figure 3 shows model predictions for the triple combination at polymyxin B 0.5, 2 and 4 mg/L against all six isolates, for four companion regimens plus the growth control.
arms <- tibble::tribble(
  ~arm,                          ~mem, ~fof,
  "Growth control",                 0,    0,
  "MEM 40 + FOF 75",               40,   75,
  "MEM 80 + FOF 75",               80,   75,
  "MEM 40 + FOF 300",              40,  300,
  "MEM 80 + FOF 300",              80,  300
)

fig3 <- tidyr::crossing(model = mahadevan_models, pmb = c(0.5, 2, 4), arms) |>
  # The growth control carries no drug at all, so its curve is identical in all
  # three polymyxin B panels; it is kept in each so every panel has its own
  # no-treatment reference, exactly as Figure 3 draws it.
  rowwise() |>
  mutate(sim = list({
    s <- solve_sctk(uis[[model]], pmb = if (arm == "Growth control") 0 else pmb,
                    mem = mem, fof = fof, tmax = 24, by = 0.25)
    data.frame(time = s$time, log10cfu = s$log_cfu)
  })) |>
  ungroup() |>
  tidyr::unnest(sim) |>
  mutate(
    isolate = factor(unname(isolate_label[model]),
                     levels = c("BRKP61", "BRKP76", "KP0016-1",
                                "KP0052-1", "BRKP67", "BRKP28")),
    panel   = factor(sprintf("PMB %g mg/L", pmb),
                     levels = sprintf("PMB %g mg/L", c(0.5, 2, 4))),
    arm     = factor(arm, levels = arms$arm),
    # Figure 3 is drawn on a 0-10 log10 CFU/mL axis with the LLOQ at 2.
    plotted = pmax(log10cfu, 0)
  )

ggplot(fig3, aes(time, plotted, colour = arm)) +
  geom_hline(yintercept = 2, linetype = "dotted", colour = "grey40") +
  geom_line(linewidth = 0.7) +
  facet_grid(isolate ~ panel) +
  scale_x_continuous(breaks = seq(0, 24, by = 8)) +
  coord_cartesian(ylim = c(0, 10)) +
  labs(x = "Time (h)", y = expression(log[10] ~ CFU / mL), colour = NULL,
       title = "Replicates Figure 3 of Mahadevan 2026",
       caption = "Dotted line = LLOQ (2 log10 CFU/mL). Curves are floored at 0 for display only.") +
  theme(legend.position = "bottom")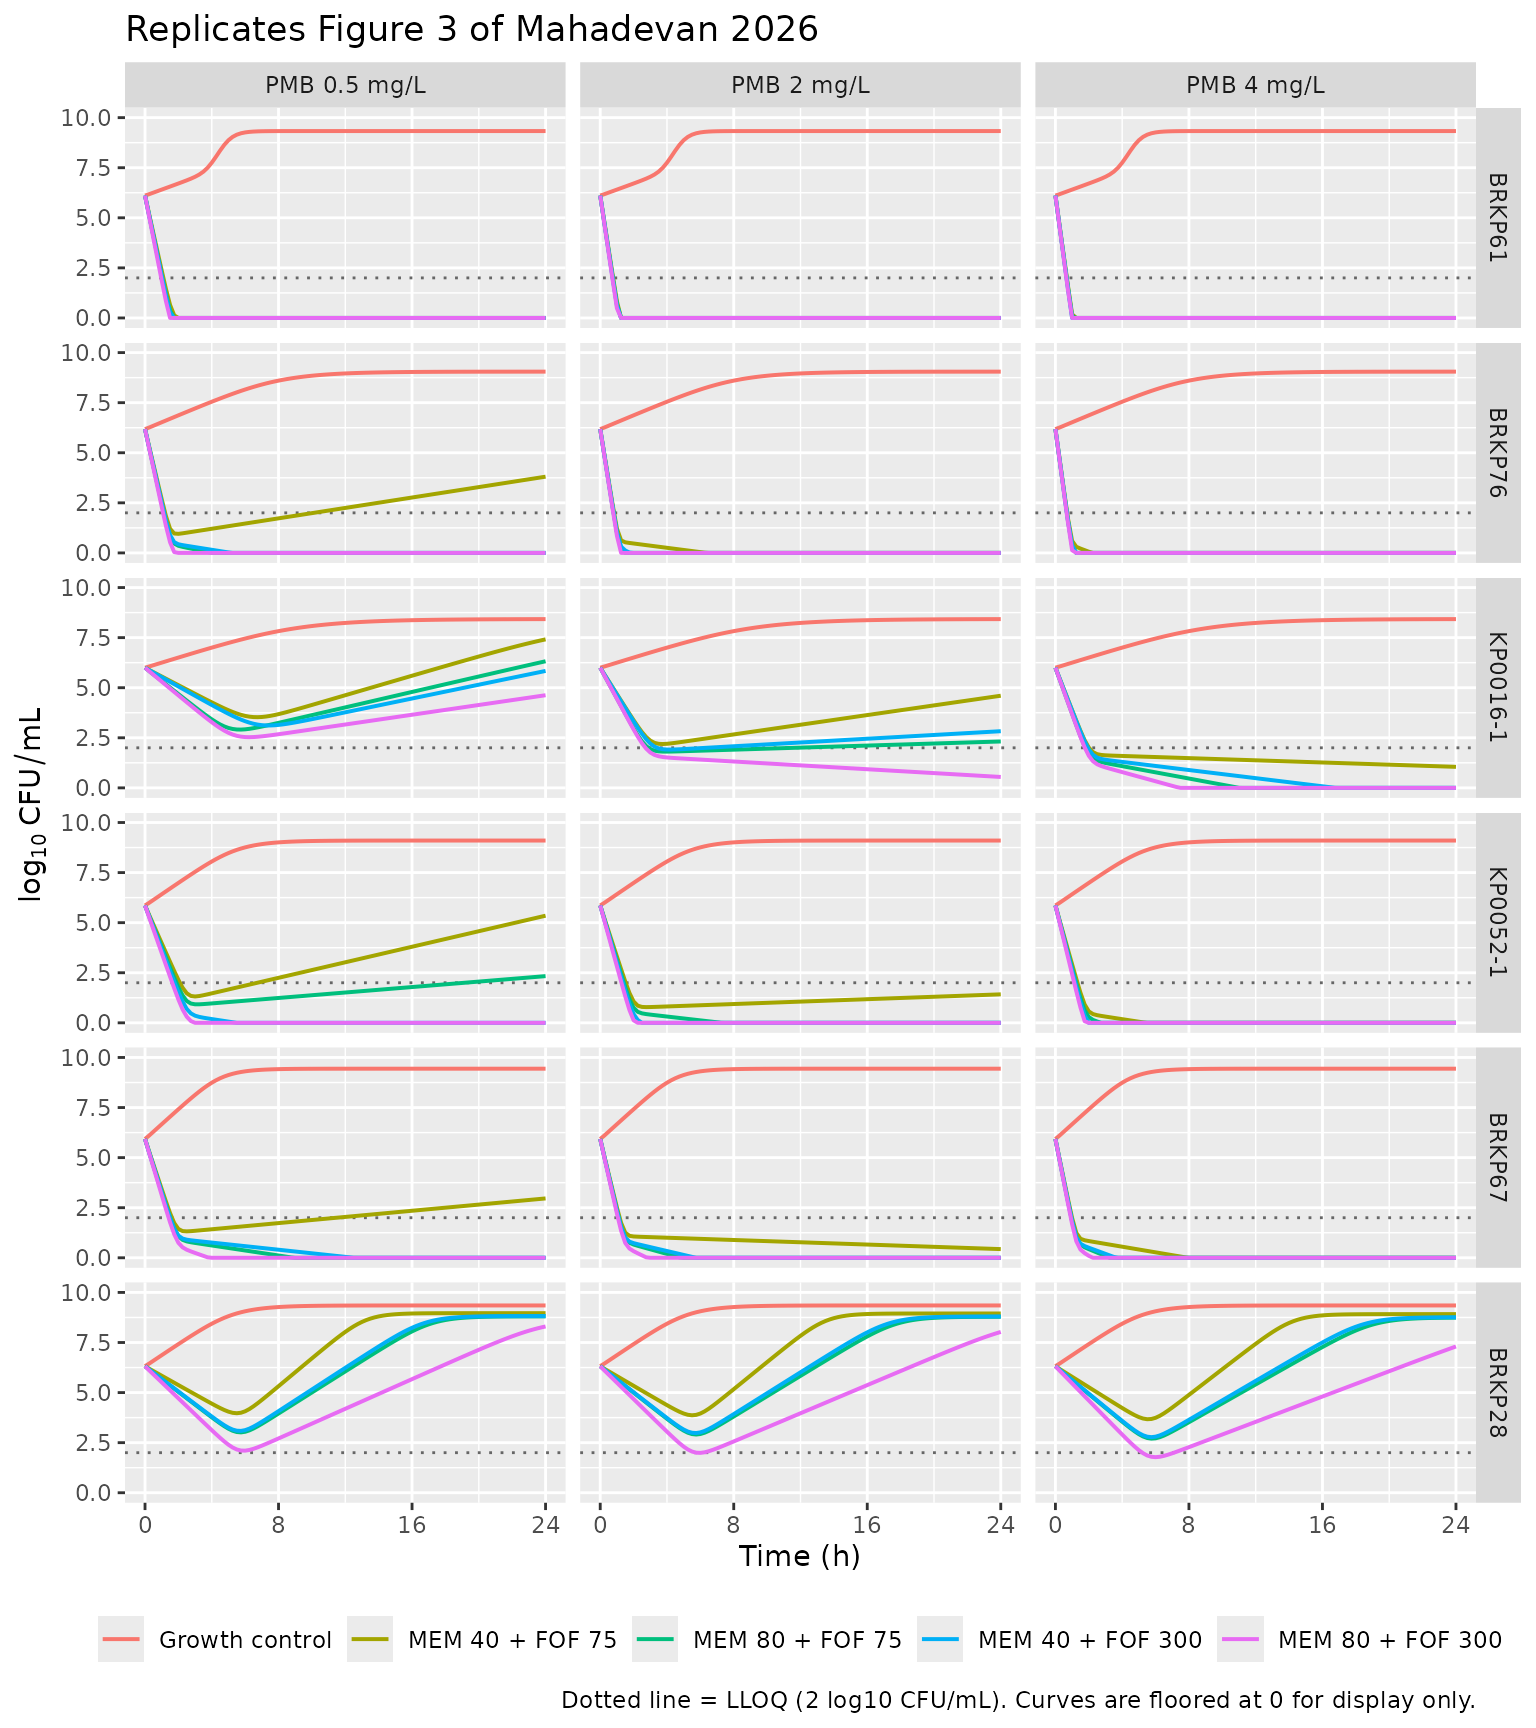
fig3 |>
  filter(time %in% c(0, 6, 8, 24)) |>
  mutate(log10cfu = round(pmax(log10cfu, 0), 2)) |>
  select(isolate, panel, arm, time, log10cfu) |>
  tidyr::pivot_wider(names_from = time, values_from = log10cfu,
                     names_prefix = "t") |>
  filter(arm %in% c("Growth control", "MEM 40 + FOF 75")) |>
  dplyr::rename("Isolate" = isolate, "Polymyxin B" = panel, "Regimen" = arm,
                "0 h" = t0, "6 h" = t6, "8 h" = t8, "24 h" = t24) |>
knitr::kable(caption = "Simulated log10 viable counts at the sampling times of Figure 3, for the growth control and the MEM 40 + FOF 75 triple combination.")| Isolate | Polymyxin B | Regimen | 0 h | 6 h | 8 h | 24 h |
|---|---|---|---|---|---|---|
| BRKP28 | PMB 0.5 mg/L | Growth control | 6.32 | 9.06 | 9.27 | 9.35 |
| BRKP28 | PMB 0.5 mg/L | MEM 40 + FOF 75 | 6.32 | 4.07 | 5.32 | 8.96 |
| BRKP28 | PMB 2 mg/L | Growth control | 6.32 | 9.06 | 9.27 | 9.35 |
| BRKP28 | PMB 2 mg/L | MEM 40 + FOF 75 | 6.32 | 3.95 | 5.17 | 8.95 |
| BRKP28 | PMB 4 mg/L | Growth control | 6.32 | 9.06 | 9.27 | 9.35 |
| BRKP28 | PMB 4 mg/L | MEM 40 + FOF 75 | 6.32 | 3.74 | 4.88 | 8.92 |
| BRKP61 | PMB 0.5 mg/L | Growth control | 6.11 | 9.26 | 9.33 | 9.33 |
| BRKP61 | PMB 0.5 mg/L | MEM 40 + FOF 75 | 6.11 | 0.00 | 0.00 | 0.00 |
| BRKP61 | PMB 2 mg/L | Growth control | 6.11 | 9.26 | 9.33 | 9.33 |
| BRKP61 | PMB 2 mg/L | MEM 40 + FOF 75 | 6.11 | 0.00 | 0.00 | 0.00 |
| BRKP61 | PMB 4 mg/L | Growth control | 6.11 | 9.26 | 9.33 | 9.33 |
| BRKP61 | PMB 4 mg/L | MEM 40 + FOF 75 | 6.11 | 0.00 | 0.00 | 0.00 |
| BRKP67 | PMB 0.5 mg/L | Growth control | 5.93 | 9.31 | 9.42 | 9.44 |
| BRKP67 | PMB 0.5 mg/L | MEM 40 + FOF 75 | 5.93 | 1.58 | 1.73 | 2.96 |
| BRKP67 | PMB 2 mg/L | Growth control | 5.93 | 9.31 | 9.42 | 9.44 |
| BRKP67 | PMB 2 mg/L | MEM 40 + FOF 75 | 5.93 | 0.95 | 0.89 | 0.43 |
| BRKP67 | PMB 4 mg/L | Growth control | 5.93 | 9.31 | 9.42 | 9.44 |
| BRKP67 | PMB 4 mg/L | MEM 40 + FOF 75 | 5.93 | 0.27 | 0.00 | 0.00 |
| BRKP76 | PMB 0.5 mg/L | Growth control | 6.18 | 8.16 | 8.60 | 9.05 |
| BRKP76 | PMB 0.5 mg/L | MEM 40 + FOF 75 | 6.18 | 1.47 | 1.73 | 3.81 |
| BRKP76 | PMB 2 mg/L | Growth control | 6.18 | 8.16 | 8.60 | 9.05 |
| BRKP76 | PMB 2 mg/L | MEM 40 + FOF 75 | 6.18 | 0.04 | 0.00 | 0.00 |
| BRKP76 | PMB 4 mg/L | Growth control | 6.18 | 8.16 | 8.60 | 9.05 |
| BRKP76 | PMB 4 mg/L | MEM 40 + FOF 75 | 6.18 | 0.00 | 0.00 | 0.00 |
| KP0016-1 | PMB 0.5 mg/L | Growth control | 6.00 | 7.46 | 7.82 | 8.42 |
| KP0016-1 | PMB 0.5 mg/L | MEM 40 + FOF 75 | 6.00 | 3.59 | 3.68 | 7.41 |
| KP0016-1 | PMB 2 mg/L | Growth control | 6.00 | 7.46 | 7.82 | 8.42 |
| KP0016-1 | PMB 2 mg/L | MEM 40 + FOF 75 | 6.00 | 2.43 | 2.67 | 4.60 |
| KP0016-1 | PMB 4 mg/L | Growth control | 6.00 | 7.46 | 7.82 | 8.42 |
| KP0016-1 | PMB 4 mg/L | MEM 40 + FOF 75 | 6.00 | 1.54 | 1.48 | 1.05 |
| KP0052-1 | PMB 0.5 mg/L | Growth control | 5.86 | 8.76 | 9.01 | 9.10 |
| KP0052-1 | PMB 0.5 mg/L | MEM 40 + FOF 75 | 5.86 | 1.86 | 2.25 | 5.35 |
| KP0052-1 | PMB 2 mg/L | Growth control | 5.86 | 8.76 | 9.01 | 9.10 |
| KP0052-1 | PMB 2 mg/L | MEM 40 + FOF 75 | 5.86 | 0.88 | 0.94 | 1.42 |
| KP0052-1 | PMB 4 mg/L | Growth control | 5.86 | 8.76 | 9.01 | 9.10 |
| KP0052-1 | PMB 4 mg/L | MEM 40 + FOF 75 | 5.86 | 0.00 | 0.00 | 0.00 |
The qualitative features the paper emphasises are all reproduced: BRKP61, BRKP76, KP0052-1 and BRKP67 are driven below the LLOQ and held there; KP0016-1 regrows at polymyxin B 0.5 and 2 mg/L but is suppressed at 4 mg/L, matching the Results statement that this non-carbapenemase producer needed the higher exposure; and BRKP28 dips early and then regrows to the carrying capacity under every regimen.
Relative bacterial burden across isolates
The paper summarises the extent of killing as the area under the bacterial load-versus-time curve, AUC_CFU, in log10 CFU-h/mL. The Methods state only that “AUC_CFU from 0 to 24 hours was calculated”; neither the trapezoid rule nor the handling of counts below the LLOQ is specified, so the absolute published values cannot be reproduced (see the Errata). The ranking the paper draws from them is reproduced here, computed with an explicitly stated convention: linear trapezoid of log10 CFU/mL over 0-24 h with values floored at the LLOQ of 2 log10 CFU/mL.
auc_cfu <- function(m, pmb, mem, fof) {
  s <- solve_sctk(uis[[m]], pmb = pmb, mem = mem, fof = fof, tmax = 24, by = 0.25)
  y <- pmax(s$log_cfu, 2)
  sum(diff(s$time) * (head(y, -1) + tail(y, -1)) / 2)
}

burden <- data.frame(
  isolate = unname(isolate_label[mahadevan_models]),
  auc_cfu = unname(vapply(mahadevan_models, auc_cfu, numeric(1),
                          pmb = 4, mem = 40, fof = 75))
)

stopifnot(
  # The paper's ordering claim: BRKP28 retains the largest bacterial burden of
  # the six, and BRKP28 > BRKP67 (published 50.3 vs 40.1 log10 CFU-h/mL).
  burden$isolate[which.max(burden$auc_cfu)] == "BRKP28",
  burden$auc_cfu[burden$isolate == "BRKP28"] >
    burden$auc_cfu[burden$isolate == "BRKP67"]
)
knitr::kable(
  burden |> arrange(auc_cfu) |> mutate(auc_cfu = round(auc_cfu, 1)) |>
    dplyr::rename("Isolate" = isolate,
                  "AUC_CFU 0-24 h (log10 CFU-h/mL)" = auc_cfu),
  caption = "Model-predicted bacterial burden under PMB 4 + MEM 40 + FOF 75 mg/L, floored at the LLOQ. BRKP28 retains by far the largest burden, as reported."
)| Isolate | AUC_CFU 0-24 h (log10 CFU-h/mL) |
|---|---|
| BRKP61 | 49.4 |
| BRKP76 | 49.5 |
| BRKP67 | 49.9 |
| KP0052-1 | 50.5 |
| KP0016-1 | 51.8 |
| BRKP28 | 166.7 |
Assumptions and deviations
-
Model class and species. This is an in-vitro
mechanism-based PK/PD model, not a population PK model.
population$speciesrecords the K. pneumoniae isolate. There is no drug NCA to compute, so PKNCA validation is replaced by the mechanistic checks above, per the endogenous / mechanistic validation strategy. - Six files, one paper. The authors applied a consistent structural growth model across the six isolates but estimated every parameter separately per isolate, and let the supported subpopulation phenotypes and synergy terms vary by isolate. Following the policy of building models as their authors built them, these are six independent fits, hence six files sharing this one vignette.
-
Filename isolate tokens.
KP0016-1andKP0052-1carry hyphens, which are not valid in R function names; the file stems drop them (KP00161,KP00521), following the precedent ofCheah_2016_polymyxin_FADDIAB008.RforFADDI-AB008. -
Which subpopulation takes which KC50. Table 2
labels every KC50 with an
I(intermediate) orR(resistant) suffix per drug, and labels each isolate’s two subpopulations with a phenotype triple (for examplePMB_I/MEM_R/FOF_R). Each subpopulation is therefore assigned, drug by drug, the KC50 matching its own phenotype letter. This is what makes the “-” cells of Table 2 self-consistent: BRKP28 has noKC50,PMB,Iand noKC50,MEM,Iprecisely because both of its subpopulations are PMB-resistant and MEM-resistant. -
Which KC50 the synergy multiplies. Equations 6 and
7 are each written for a single subpopulation (
Kill_MEM,IandKill_FOF,R), which on its own would leave the other subpopulation ambiguous. Three independent statements in the source resolve it the same way. The sentence introducing equations 6 and 7 says the synergy enhances “the sensitivity of the intermediate and resistant subpopulations to meropenem and fosfomycin (KC50,MEM,I, KC50,FOF,I, KC50,MEM,R, KC50,FOF,R)” – all four terms. The Table 2 row labels read “KC50,MEM,I and/or KC50,MEM,R”. And in the Figure 2B schematic the two “Mechanistic synergy” boxes feed the MEM node and the FOF node as a whole, each of which then carries a killing arrow into both subpopulations (KC50,R,MEM and KC50,I,MEM; KC50,R,FOF and KC50,I,FOF). The synergy factor is therefore applied to both subpopulations, for both companion drugs, in the three isolates that carry it. -
Figure 2B corroborates the per-subpopulation KC50
assignment. The schematic is drawn for the BRKP61 phenotype
pair and labels each arrow explicitly: the PMB-I / MEM-R / FOF-R
subpopulation takes
KC50,I,PMB,KC50,R,MEMandKC50,R,FOF, and the PMB-R / MEM-I / FOF-I subpopulation takesKC50,R,PMB,KC50,I,MEMandKC50,I,FOF. That is the assignment implemented inMahadevan_2026_polymyxinB_meropenem_fosfomycin_BRKP61.R, and the same phenotype-letter rule is applied to the other five isolates. -
Initial conditions. Equation 2 gives
IC = CFU0 * MFfor the vegetative state and equation 3 gives 0 for the replicating state, so all bacteria start in state 1. Table 2 reports a single mutant frequency per isolate, for the minority subpopulation; the majority subpopulation is therefore seeded withCFU0 * (1 - 10^log10MF)so that the two initial conditions sum toCFU0. The correction is at most 5e-5 of the inoculum. -
Mean generation time to k12. Table 2 tabulates the
mean generation time in minutes while the Methods define
k12as its inverse in 1/h, so the model computesk12 = 60 / mgt. This matches the convention of the sibling Bulitta-lineage filesYadav_2017_imipenem_*.RandLandersdorfer_2018_meropenem_tobramycin_*.R. - KmaxPMB for BRKP61. Table 2 rounds this estimate to 13.4 1/h while the Results text quotes the range “6.61-13.42 h-1” for the non-BRKP28 isolates. The file carries the more precise 13.42; the in-file comment records both.
- Imax for fosfomycin against BRKP61. Table 2 and the Results both give 0.99; the Abstract quotes the range as “81%-98%”. The file carries the Table 2 / Results value of 0.99, and the 98% in the Abstract appears to be a rounding of the same estimate.
- Meropenem 80 mg/L in Figure 3. The Methods list the studied meropenem concentrations as 10, 20 and 40 mg/L (clinically achievable) plus 60 and 120 mg/L (supra-therapeutic); 80 mg/L is not among them, yet the Figure 3 legend includes “MEM 80 mg/L” arms. The figure legend is used here because it is what the replicated figure plots. The discrepancy is in the source.
- AUC_CFU convention. The published per-isolate AUC_CFU values (for example 40.1 for BRKP67 and 50.3 for BRKP28 under PMB 4 + MEM 40 + FOF 75) could not be reproduced in absolute terms, because the Methods do not state how the 0-24 h integral treats counts below the LLOQ, nor whether it is taken over the observed sampling times or over the fitted curve. The ordering claim the paper makes from those numbers is reproduced and asserted above; the absolute values are not asserted.
-
Monte Carlo clinical simulations not reproduced.
The paper’s percentage reductions in AUC_CFU for critically ill patients
(Figure 4, Figure S5) drive these MBMs with three previously published
population PK models – polymyxin B (reference 17), meropenem (reference
46) and fosfomycin (reference 47) – none of which was available when
this model was built, and whose parameters are not reproduced in this
paper. Those simulations are therefore outside the scope of this
vignette. A user can reproduce them by overriding
d/dt(cpmb),d/dt(cmem)andd/dt(cfof)with the corresponding unbound-concentration profiles (the paper used fu = 0.42 for polymyxin B, 0.98 for meropenem, and negligible protein binding for fosfomycin). -
Observation floor. The paper’s observation is
log10(CFUtot). The model files computelog10(CFUtot + 1e-6)so that a regimen driving the population to numerical extinction returns a finite value rather thanNaNfrom a solver undershoot into negative counts. The regularisation is eight orders of magnitude below the 2 log10 CFU/mL LLOQ and never perturbs an observable count. The same device is used byHernandezLozano_2025_apramycin_invitro.R. -
Residual variability. The additive residual SD from
Table 2 is carried in
ini()but the vignette’s checks are all typical-value (deterministic); the models declare no between-subject random effects, since each fit describes a single isolate. -
Solver.
method = "lsoda"withatol = rtol = 1e-10andmaxsteps = 1e6is used throughout: the fixedk21 = 50per h against killing rates of order 1-13 per h makes the system stiff during the kill transient, and the defaultliblsodasolver is unreliable for this model family near the stationary plateau (the same setting is used by the sibling Yadav and Landersdorfer vignettes). - Erratum check. No erratum, corrigendum or author correction is referenced in the article PDF or its supplement. Any later correction on the AAC journal page should be checked before using these models in a regulatory context.
-
Convention check.
nlmixr2lib::checkModelConventions()is clean for all six files. Of the three bath-concentration states,cmemis a registered canonical;cpmbandcfofare well-formed members of the samec<drug>bath-state family but are not yet registered, so those two are declared throughpaper_specific_compartments(the routeKroemer_2024_ceftazidime_avibactam_fosfomycin_hfim.Ralso takes for its fosfomycin state). The four bacterial states of each file need no such declaration: this paper is the founding three-drug example of the canonicalbact_<pheno>..._<pheno><digit>subpopulation scheme, which carries one spelled-out phenotype token per drug in the model’s drug order (here PMB, MEM, FOF) and a trailing life-cycle digit.bacterialSubpopRegexinR/conventions.Rpreviously admitted at most two phenotype tokens; it was widened to any number in this same change, andinst/references/compartment-names.mdnow documents the scheme as N-drug rather than two-drug. Nothing already registered changes meaning – the existing one- and two-token names still match.